

Weekly training frequency effects on strength gain: a meta-analysis.
Open accessThe DOI matches its Crossref record; 73 of the 75 references it cites were found in a registry or an index.
Abstract
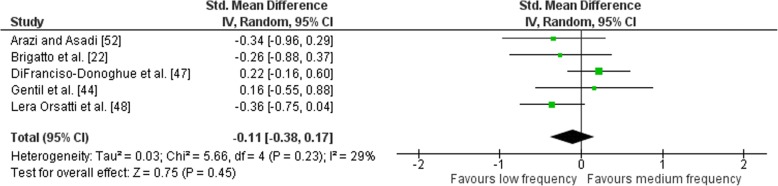
The current recommendations for resistance training (RT) frequency range from 2 to 5 days per week (days week − 1 ) depending on the subjects’ training status. However, the relationship between RT frequency and muscular strength remains controversial with reported variances existing across different population groups. We conducted a meta-analysis that (1) quantified the effects of low (LF; 1 day week − 1 ), medium (MF; 2 days week − 1 ), or high (HF; ≥ 3 days week − 1 ) RT frequency on muscular strength per exercise; (2) examined the effects of different RT frequency on one repetition maximum (1RM) strength gain profiles (multi-joint exercises and single joint exercises); (3) examined the effects of different RT frequency on 1RM strength gain when RT volume is equated; and (4) examined the effects of different RT frequency on 1RM strength gains on upper and lower body. Computerised searches were performed using the terms ‘strength training frequency’, ‘resistance training frequency’, ‘training frequency’, and ‘weekly training frequency’. After review, 12 studies were deemed suitable according to pre-set eligibility criteria. Primary data were pooled using a random-effects model. Outcomes analysed for main effects were pre- to post strength change with volume-equated studies that combined multi-joint and isolation exercise; isolation-only exercise and untrained subjects only. Heterogeneity between studies was assessed using I 2 and Cochran’s Q statistics with funnel plots used to assess publication bias and sensitivity analyses calculated for subgroups. Pre- versus post-training strength analysis comprised of 74 treatment groups from 12 studies. For combined multi-joint and isolation exercises, there was a trend towards higher RT frequency compared with lower frequency [mean effect size (ES) 0.09 (95% CI − 0.06–0.24)] however not significant ( p = 0.25). Volume-equated pre- to post-intervention strength gain was similar when LF was compared to HF [mean ES 0.03 (95% CI − 0.20–0.27); p = 0.78]. Upper body pre- to post-intervention strength gain was greater when HF was compared with LF [mean ES 0.48 (95% CI 0.20–0.76)] with significant differences between frequencies ( p < 0.01). Upper body pre- to post-intervention strength gain was similar when MF was compared with LF (ES 0.12; 95% CI − 0.22–0.47); p = 0.48]. There was no significant difference in lower body mean ES between HF and LF [mean ES 0.21(95% CI − 0.55–0.13); p = 0.22]. There was a trend towards a difference in mean ES between MF and HF [mean ES 0.41(95% CI − 0.26–1.09); however, the effect was not significant ( p = 0.23). The existing data does not provide a strong correlation between increased weekly training frequency (HF) and maximal strength gain in upper and lower body resistance exercises for a mixed population group. When RT is volume-equated for combined multi-joint and isolation exercises, there is no significant effect of RT frequency on muscular strength gain. More investigations are required to explore the effects of varying weekly training frequencies adequately.
Overview
The claims and statistics of this paper haven’t been checked yet.
Free: it reads the open-access text and checks the first 5 claims that cite a source we can check. Create a free account to check every claim.
Integrity signals
Registry
Cites
Statistics
Figures




Verification
Claims the paper makes
The claims and statistics of this paper haven’t been checked yet.
Free: it reads the open-access text and checks the first 5 claims that cite a source we can check. Create a free account to check every claim.
Claims other papers make about this one
Each is checked against this paper’s own text: does it say what the citing paper says it does?
The source backs part of the claim, not all of it — or backs it for a different population, condition or comparison.
In the citing paper
“However, voluntary strength was enhanced by lifting heavier loads (≥80% one-repetition maximum), through a complete range of motion, for 2–3 sets, at the beginning of training sessions, and ≥2 sessions/wk.”
From American College of Sports Medicine Position Stand. Resistance Training Prescription for Muscle Function, Hypertrophy, and Physical Performance in Healthy Adults: An Overview of Reviews (2026) · cites this paper as [75]
Experimental — accuracy not yet measured
Self-check
Percentages, sums and reported differences re-computed from the paper’s own numbers.
The self-check needs the paper’s full text.
Citations
Cites
Statistical Power Analysis for the Behavioral Sciences
Muller, K. (1989) · Technometrics · doi:10.1080/00401706.1989.10488618 · Cited by 99,167
Statistical power analysis for the behavioral sciences
(1990) · Computers, Environment and Urban Systems · doi:10.1016/0198-9715(90)90050-4 · Cited by 65,269
Measuring inconsistency in meta-analyses
Higgins, J. P. T., Thompson, S. G., Deeks, J. J., & Altman, D. G. (2003) · BMJ · doi:10.1136/bmj.327.7414.557 · Cited by 63,139
Meta-analysis in clinical trials
DerSimonian, R., & Laird, N. (1986) · Controlled Clinical Trials · doi:10.1016/0197-2456(86)90046-2 · Cited by 39,552
Liberati, A., Altman, D. G., Tetzlaff, J., Mulrow, C., Gøtzsche, P. C., Ioannidis, J. P. A., Clarke, M., Devereaux, P. J., Kleijnen, J., & Moher, D. (2009) · PLoS Medicine · doi:10.1371/journal.pmed.1000100 · Cited by 28,164 · cited 1×
“Methods Literature Search A systematic search of the literature was conducted by the recommendations and criteria outlined in the Preferred Reporting Items for Systematic Reviews and Meta-Analyses (PRISMA) statement [24].”
MethodDermyshi, E., Wang, Y., Yan, C., Hong, W., Qiu, G., Gong, X., & Zhang, T. (2017) · Neonatology · doi:10.1159/000454668 · Cited by 24,451
Duval, S., & Tweedie, R. (2000) · Biometrics · doi:10.1111/j.0006-341x.2000.00455.x · Cited by 14,099
Liberati, A., Altman, D. G., Tetzlaff, J., Mulrow, C., Gøtzsche, P. C., Ioannidis, J. P. A., Clarke, M., Devereaux, P. J., Kleijnen, J., & Moher, D. (2009) · Journal of Clinical Epidemiology · doi:10.1016/j.jclinepi.2009.06.006 · Cited by 10,578
Statistical Methods for Psychology.
Gudgeon, A. C., & Howell, D. C. (1994) · The Statistician · doi:10.2307/2348956 · Cited by 8,278 · cited 1×
“When the standard error of measurement (SEM) of the mean was specified, the SD was calculated according to the formula (SD = SEM*square root of N) [28].”
MethodThe combination of estimates from different experiments
Cochran, W. G. (1954) · Biometrics · doi:10.2307/3001666 · Cited by 5,380
Research works printed but not linked: 3
- Van Rhee HJ, Suurmond R, Hak T. User manual for meta-essentials: workbooks for meta-analysis (version 1.0). Rotterdam: Erasmus Research Institute of Management; 2015. Retrieved from www.erim.eur.nl/research-support/meta-essentials
- Arazi H, Asadi A. Effects of 8 weeks equal-volume resistance training with different workout frequency on maximal strength, endurance and body composition. Int J Sports Sci Eng. 2011;5(2):112–8.
- Stowers T, McMillan J, Scala D, et al. The short-term effects of three different strength-power training methods. Nat Strength Conditioning Assoc J. 1983;5:24–7. · doi:10.1519/0744-0049(1983)005
Cited by
Ross, R., Chaput, J.-P., Giangregorio, L. M., Janssen, I., Saunders, T. J., Kho, M. E., Poitras, V. J., Tomasone, J. R., El-Kotob, R., McLaughlin, E. C., et al. (2020) · Applied Physiology, Nutrition, and Metabolism · doi:10.1139/apnm-2020-0467 · Cited by 941
“When comparing effects on muscle strength, the effect of frequency was inconsistent when it came to muscles of the upper and lower body, and estimates were imprecise (very low-quality evidence; Ralston et al. 2018).”
ResultResistance exercise as a treatment for sarcopenia: prescription and delivery
Hurst, C., Robinson, S. M., Witham, M. D., Dodds, R. M., Granic, A., Buckland, C., De Biase, S., Finnegan, S., Rochester, L., Skelton, D. A., et al. (2022) · Age and Ageing · doi:10.1093/ageing/afac003 · Cited by 319
“Uncertainty remains as to what the optimal training frequency is for increasing muscle strength and it remains unknown whether RE frequency alone has a significant effect on traininginduced gains [37, 38].”
BackgroundKrzysztofik, M., Wilk, M., Wojdała, G., & Gołaś, A. (2019) · International Journal of Environmental Research and Public Health · doi:10.3390/ijerph16244897 · Cited by 264
Currier, B. S., Mcleod, J. C., Banfield, L., Beyene, J., Welton, N. J., D'Souza, A. C., Keogh, J. A. J., Lin, L., Coletta, G., Yang, A., et al. (2023) · British Journal of Sports Medicine · doi:10.1136/bjsports-2023-106807 · Cited by 179
Mcleod, J. C., Currier, B. S., Lowisz, C. V., & Phillips, S. M. (2024) · Journal of Sport and Health Science · doi:10.1016/j.jshs.2023.06.005 · Cited by 176
“In contrast, a high-quality meta-analysis (QoE: Level 4; 12 studies; n = 299 participants) done by Ralston and colleagues 42 concluded there was no significant impact of weekly frequency on muscular strength, regardless of whether RT volume was equated or not.”
Background
Metadata
- Authors
- Ralston, G. W., Kilgore, L., Wyatt, F. B., Buchan, D., & Baker, J. S.
- Affiliations
- University of the West of Scotland (GB)
- Kilgore College (US)
- Midwestern State University (US)
- Corresponding author
- Ralston, Grant W.
- Venue
- Sports Medicine - Open
- Published
- 2018-08-03
- Volume
- 4
- Issue
- 1
- Pages
- 36-36
- ISSN
- 2198-9761 (ISSN-L)
- 2199-1170
- PMC
- PMC6081873
- OpenAlex
- W2886723159
- Cited by
- 109
- References
- 75
- Citations by year
- 2026: 8 · 2025: 8 · 2024: 9 · 2023: 30 · 2022: 19 · 2021: 18 · 2020: 12 · 2019: 5
- FWCI
- 1.79
- Type
- journal article
- Language
- en
- Open access
- gold
- doi.org
- Licence
- cc-by
- creativecommons.org/licenses/by/4.0 (tdm)
- Locations
- Sports Medicine - Open (publishedVersion, cc-by)
- Europe PMC (PubMed Central) (publishedVersion, cc-by)
- PubMed Central (publishedVersion, cc-by)
- PubMed (publishedVersion)
- The UWS Academic Portal (University of the West of Scotland) (publishedVersion, cc-by)
- DOAJ (DOAJ: Directory of Open Access Journals) (submittedVersion)
- Topics
- Health Sciences › Medicine › Orthopedics and Sports Medicine › Sports Performance and Training
- Health Sciences › Medicine › Physiology (medical) › Cardiovascular and exercise physiology
- Health Sciences › Nursing › Nutrition and Dietetics › Muscle metabolism and nutrition
- Keywords
- one-repetition maximum, multi-joint exercises, upper body strength, lower limb strength, resistance training, training volume, untrained subjects, trained subjects, training status, sex differences, age differences, body mass index, body fat percentage, training load
About these checks
Registry, retraction, Cites and statistics results are computed, not judged, with one exception: a printed reference that no index lists is read once by a model before it counts as a citation error. Claims are extracted by a model and kept only when their quote appears verbatim in the text; each cited source is then checked, with a model’s help, for whether it says what the claim relies on. Those verdicts can be wrong — read the claim’s quote and the cited source before relying on one.
Statistics and arithmetic are recomputed, not judged.
Confidence bands are shown only for fields calibrated on our annotated test set. None is calibrated yet, so no band is shown.
What counts as a claim ›How we measure confidence ›How we check this ›
Are you an author, or do you see a problem with this page? Request a review
How to cite
Cite CoChat for the checks on this page, and the paper for its own findings.
- This page
- CoChat. (2026). Citation check: Weekly training frequency effects on strength gain: a meta-analysis. https://app.cochat.ai/papers/10.1186/s40798-018-0149-9
- The paper
- Ralston, G. W., Kilgore, L., Wyatt, F. B., Buchan, D., & Baker, J. S. (2018). Weekly training frequency effects on strength gain: a meta-analysis. Sports Medicine - Open. https://doi.org/10.1186/s40798-018-0149-9
Data sources
Bibliographic data: Semantic Scholar, OpenAlex, Crossref.
Contains information from the Semantic Scholar Academic Graph Datasets, made available under the ODC Attribution License (ODC-BY 1.0).
Semantic Scholar’s data is described in: Kinney, R., et al. (2023). The Semantic Scholar Open Data Platform. arXiv:2301.10140.
