Student or educator? Sign up with your school email and get 6 months of Pro free.
Cited by 75

The DOI matches its Crossref record; 49 of the 49 references it cites were found in a registry or an index.

The level and compartmentalization of phosphatidate phosphatase-1 (lipin-1) control the assembly and secretion of hepatic VLDL

Khalil, Maroun Bou, Sundaram, Meenakshi, Zhang, Hong-Yu, Links, Philip H., Raven, Jennifer F., Manmontri, Boripont, Sariahmetoglu, Meltem, Tran, Khai, Reue, Karen, Brindley, David N., Yao, Zemin·2009·Journal of Lipid Research

Abstract

Phosphatidate phosphatase-1 (PAP-1) converts phosphatidate to diacylglycerol and plays a key role in the biosynthesis of phospholipids and triacylglycerol (TAG). PAP-1 activity is encoded by members of the lipin family, including lipin-1 (1alpha and 1beta), -2, and -3. We determined the effect of lipin-1 expression on the assembly and secretion of very low density lipoproteins (VLDL) using McA-RH7777 cells. Expression of lipin-1alpha or -1beta increased the synthesis and secretion of [(3)H]glycerol-labeled lipids under either basal- or oleate-supplemented conditions. In the presence of oleate, the increased TAG secretion was mainly associated with VLDL(1) (S(f) > 100) and VLDL(2) (S(f) 20-100). Expression of lipin-1alpha or -1beta increased secretion efficiency and decreased intracellular degradation of [(35)S]apolipoprotein B-100 (apoB100). Knockdown of lipin-1 using specific short interfering RNA decreased secretion of [(3)H]glycerolipids and [(35)S]apoB100 even though total PAP-1 activity was not decreased, owing to the presence of lipin-2 and -3 in the cells. Deletion of the nuclear localization signal sequences within lipin-1alpha not only abolished nuclear localization but also resulted in impaired association with microsomal membranes. Cells expressing the cytosolic lipin-1alpha mutant failed to promote [(35)S]apoB100 synthesis or secretion, and showed compromised stimulation in [(3)H]TAG synthesis and secretion. Thus, alteration in hepatic expression of lipin-1 and its compartmentalization control VLDL assembly/secretion.

Overview

The claims and statistics of this paper haven’t been checked yet.

Run the check — free, no account needed. It reads the open-access text and checks the sources it cites.

A few free checks a day · papers already verified open instantly · results are public

Integrity signals

Registry

Crossref · 10.1194/jlr.m800204-jlr200

Cites

49 of 49 references verified0 citation errors · 0 not checkable

Statistics

Figures

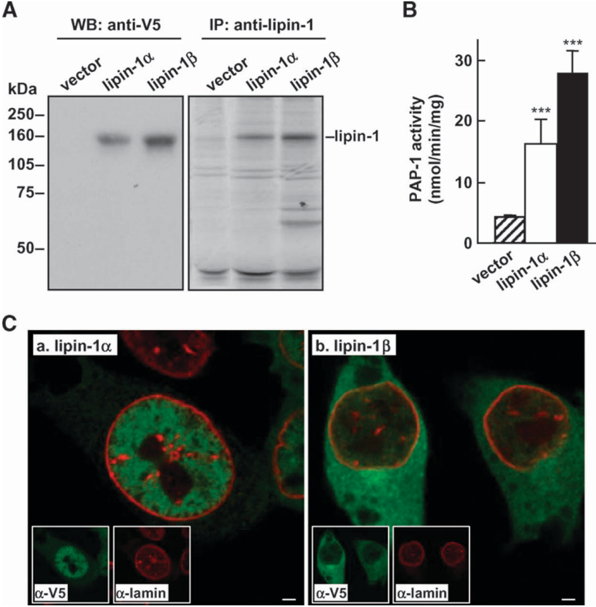
Fig. 1 Transient expression of lipin-1. McA-RH7777 cells were transfected with 5 m g of lipin-1 a , lipin-1 b , or pCMV5 vector for 48 h. A: Left panel , immunoblots of recombinant lipin-1. Cells were incubated with media containing 20% FBS and 0.4 mM oleate for 4 h, and full cell lysate was subjected to SDS-PAGE and immunoblotting using anti-V5 monoclonal antibody for lipin-1. Right panel, fluorograms of [ 35 S]lipin-1 immunoprecipitated from [ 35 S]methionine-labeled cells using polyclonal anti-lipin-1 antiserum. B: Phosphatidate phosphatase 1 (PAP-1) activity. Cells were incubated with media containing 20% FBS and 0.4 mM oleate for 4 h. Cells were lysed, and the total cell lysate was used to measure PAP-1 activity [determined by the conversion of diacylglycerol (DAG) from [ 3 H]palmitatelabeled phosphatidate]. *** P , 0.001 (Student ʼ s t -test of lipin vs. control). Error bars indicate 6 SD (n 5 3). C: Representative double immunofluorescent microscopic images of lipin-1 a - (panel a) or -1 b - (panel b) expressing cells. Images of lipin-1 (green) or lamin (red) staining are shown in insets. Scale bar 5 2 m m.
Fig. 1 Transient expression of lipin-1. McA-RH7777 cells were transfected with 5 m g of lipin-1 a , lipin-1 b , or pCMV5 vector for 48 h. A: Left panel , immunoblots of recombinant lipin-1. Cells were incubated with media containing 20% FBS and 0.4 mM oleate for 4 h, and full cell lysate was subjected to SDS-PAGE and immunoblotting using anti-V5 monoclonal antibody for lipin-1. Right panel, fluorograms of [ 35 S]lipin-1 immunoprecipitated from [ 35 S]methionine-labeled cells using polyclonal anti-lipin-1 antiserum. B: Phosphatidate phosphatase 1 (PAP-1) activity. Cells were incubated with media containing 20% FBS and 0.4 mM oleate for 4 h. Cells were lysed, and the total cell lysate was used to measure PAP-1 activity [determined by the conversion of diacylglycerol (DAG) from [ 3 H]palmitatelabeled phosphatidate]. *** P , 0.001 (Student ʼ s t -test of lipin vs. control). Error bars indicate 6 SD (n 5 3). C: Representative double immunofluorescent microscopic images of lipin-1 a - (panel a) or -1 b - (panel b) expressing cells. Images of lipin-1 (green) or lamin (red) staining are shown in insets. Scale bar 5 2 m m.CC-BY · From the PDF
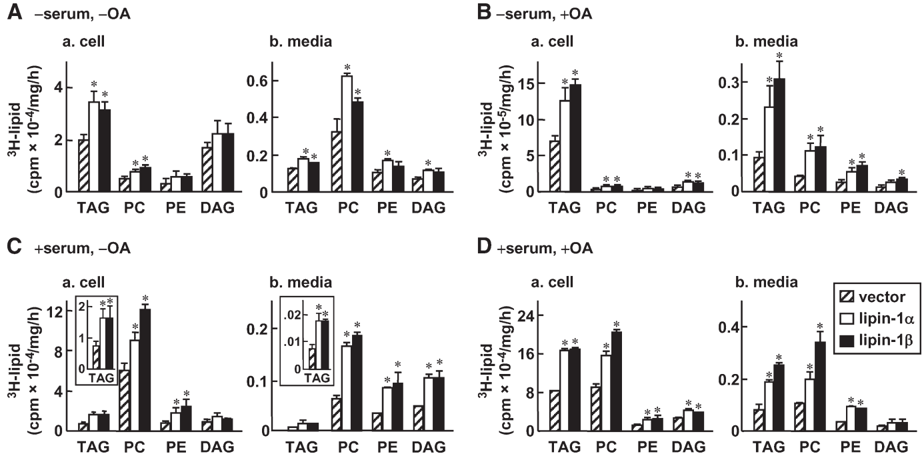
Fig. 2 Expression of lipin-1 stimulates [ 3 H]glycerolipid synthesis and secretion. McA-RH7777 cells were transiently transfected with lipin-1 a or -1 b as described in the legend of Fig. 1. Cells were labeled with [ 3 H]glycerol (4 m Ci/ml) for 1, 2, and 4 h in lipid-poor media (A), in media supplemented with 0.4 mM oleate (B), in media supplemented with 20% FBS (C), or in media supplemented with 20% FBS and 0.4 mM oleate (D). The 3 H-lipids were extracted from the cells and media, respectively, at each time point, resolved by TLC, and quantified by scintillation counting. Data are presented as radioactivity counts associated with cell or media per milligram cell protein per hour. Insets in panel C show [ 3 H]TAG in expanded y axis. TAG, triacylglycerol; PC, phosphatidylcholine; PE, phosphatidylethanolamine. * P , 0.05 (Student ʼ s t -test of lipin vs. control). Error bars indicate 6 SD (n 5 3).
Fig. 2 Expression of lipin-1 stimulates [ 3 H]glycerolipid synthesis and secretion. McA-RH7777 cells were transiently transfected with lipin-1 a or -1 b as described in the legend of Fig. 1. Cells were labeled with [ 3 H]glycerol (4 m Ci/ml) for 1, 2, and 4 h in lipid-poor media (A), in media supplemented with 0.4 mM oleate (B), in media supplemented with 20% FBS (C), or in media supplemented with 20% FBS and 0.4 mM oleate (D). The 3 H-lipids were extracted from the cells and media, respectively, at each time point, resolved by TLC, and quantified by scintillation counting. Data are presented as radioactivity counts associated with cell or media per milligram cell protein per hour. Insets in panel C show [ 3 H]TAG in expanded y axis. TAG, triacylglycerol; PC, phosphatidylcholine; PE, phosphatidylethanolamine. * P , 0.05 (Student ʼ s t -test of lipin vs. control). Error bars indicate 6 SD (n 5 3).CC-BY · From the PDF
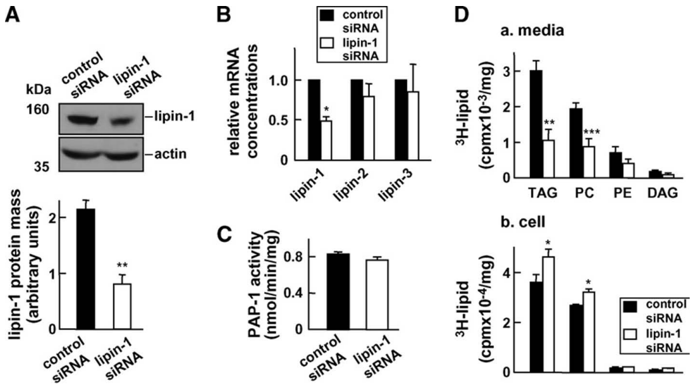
Fig. 3 Lipin-1 knockdown. A: McA-RH7777 cells (50% confluent) were incubated with 80 pmol lipin-1 or control siRNA for 48 h in media supplemented with 20% FBS and 0.4 mM oleate, as described in the Methods section. Endogenous lipin-1 after short interfering RNA (siRNA) treatment was detected by immunoblotting (top panel) as described in the legend of Fig. 1A. The intensity of the lipin bands was semi-quantified by scanning densitometry (bottom panel). B: The relative mRNA concentrations of lipin-1, -2, and -3 (with respect to cyclophilin A) were quantified by real-time RT-PCR. C: PAP-1 activity in control and lipin-1 knockdown cells was determined as in the legend to Fig. 1B. D: Metabolic labeling of medium (panel a) and cell (panel b) glycerolipids with [ 3 H]glycerol as described in Fig. 2D. * P , 0.05; ** P , 0.01; *** P , 0.001 (Student ʼ s t -test of lipin vs. control). Error bars indicate 6 SD (n 5 3).
Fig. 3 Lipin-1 knockdown. A: McA-RH7777 cells (50% confluent) were incubated with 80 pmol lipin-1 or control siRNA for 48 h in media supplemented with 20% FBS and 0.4 mM oleate, as described in the Methods section. Endogenous lipin-1 after short interfering RNA (siRNA) treatment was detected by immunoblotting (top panel) as described in the legend of Fig. 1A. The intensity of the lipin bands was semi-quantified by scanning densitometry (bottom panel). B: The relative mRNA concentrations of lipin-1, -2, and -3 (with respect to cyclophilin A) were quantified by real-time RT-PCR. C: PAP-1 activity in control and lipin-1 knockdown cells was determined as in the legend to Fig. 1B. D: Metabolic labeling of medium (panel a) and cell (panel b) glycerolipids with [ 3 H]glycerol as described in Fig. 2D. * P , 0.05; ** P , 0.01; *** P , 0.001 (Student ʼ s t -test of lipin vs. control). Error bars indicate 6 SD (n 5 3).CC-BY · From the PDF
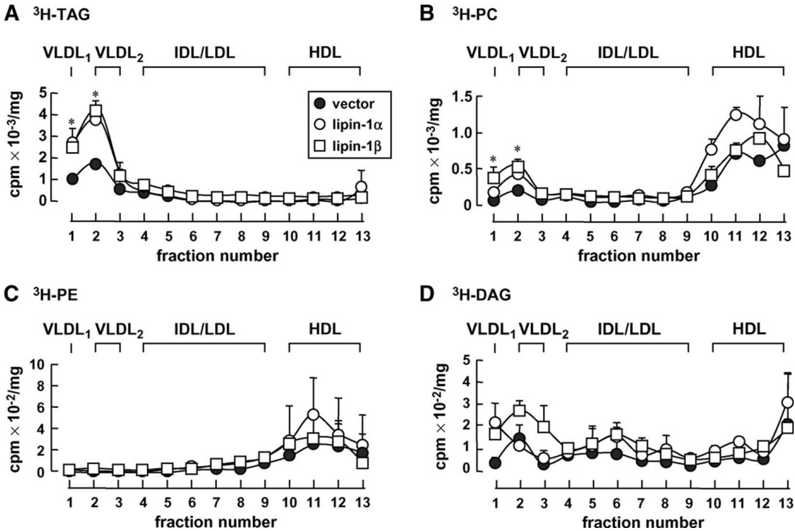
Fig. 4 Increased [ 3 H]TAG association with VLDL1 and VLDL2 secreted from lipin-1 expressing cells. Control or lipin-1-expressing cells were labeled with [ 3 H]glycerol as described in the legend of Fig. 2D. The secreted lipoproteins in the conditioned media were subjected to cumulative rate floatation ultracentrifugation. The 3 H-labeled lipids were extracted from each fraction, and TAG (A), PC (B), PE (C), and DAG (D) were resolved by TLC and quantified by scintillation counting. * P , 0.05 (Student ʼ s t -test of lipin vs. control). Error bars indicate 6 SD (n 5 3).
Fig. 4 Increased [ 3 H]TAG association with VLDL1 and VLDL2 secreted from lipin-1 expressing cells. Control or lipin-1-expressing cells were labeled with [ 3 H]glycerol as described in the legend of Fig. 2D. The secreted lipoproteins in the conditioned media were subjected to cumulative rate floatation ultracentrifugation. The 3 H-labeled lipids were extracted from each fraction, and TAG (A), PC (B), PE (C), and DAG (D) were resolved by TLC and quantified by scintillation counting. * P , 0.05 (Student ʼ s t -test of lipin vs. control). Error bars indicate 6 SD (n 5 3).CC-BY · From the PDF
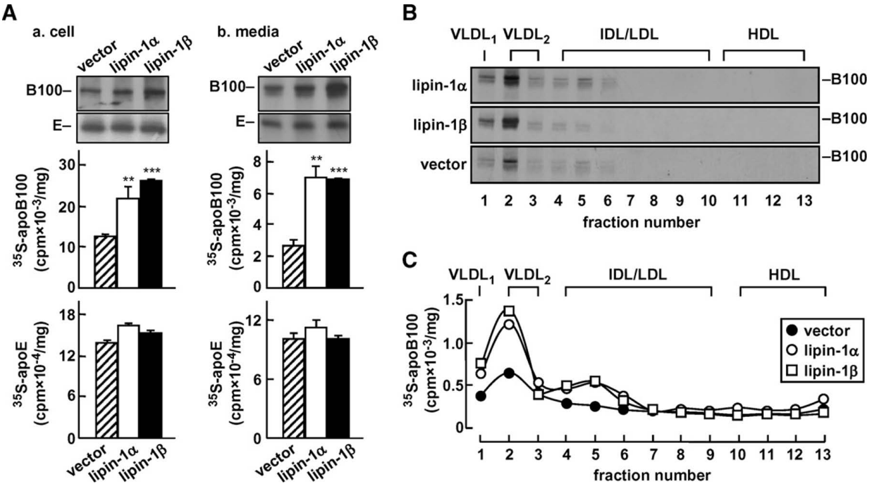
Fig. 5 Expression of lipin-1 stimulates [ 35 S]apolipoprotein B100 (apoB100) secretion as VLDL1 and VLDL2. Control or lipin-1 expressing cells were continuously labeled with [ 35 S]methionine/cysteine (75 m Ci/dish) for 4 h in media containing 20% FBS and 0.4 mM oleate. The [ 35 S]apoB100 or -apoE was recovered from cells or media by immunoprecipitation and subjected to SDS-PAGE and fluorography. A: Top, representative fluorograms of [ 35 S]apoB100 and -apoE associated with cells or media. Bottom, radioactivity associated with apoB and apoE. ** P , 0.01; *** P , 0.001 (Student ʼ s t -test of lipin vs. control). Error bars indicate 6 SD (n 5 3). B: Representative fluorograms of 35 S-labeled apoB100 associated with fractionated medium lipoproteins. C: Radioactivity associated with [ 35 S]apoB100 in each lipoprotein fraction was quantified by scintillation counting.
Fig. 5 Expression of lipin-1 stimulates [ 35 S]apolipoprotein B100 (apoB100) secretion as VLDL1 and VLDL2. Control or lipin-1 expressing cells were continuously labeled with [ 35 S]methionine/cysteine (75 m Ci/dish) for 4 h in media containing 20% FBS and 0.4 mM oleate. The [ 35 S]apoB100 or -apoE was recovered from cells or media by immunoprecipitation and subjected to SDS-PAGE and fluorography. A: Top, representative fluorograms of [ 35 S]apoB100 and -apoE associated with cells or media. Bottom, radioactivity associated with apoB and apoE. ** P , 0.01; *** P , 0.001 (Student ʼ s t -test of lipin vs. control). Error bars indicate 6 SD (n 5 3). B: Representative fluorograms of 35 S-labeled apoB100 associated with fractionated medium lipoproteins. C: Radioactivity associated with [ 35 S]apoB100 in each lipoprotein fraction was quantified by scintillation counting.CC-BY · From the PDF
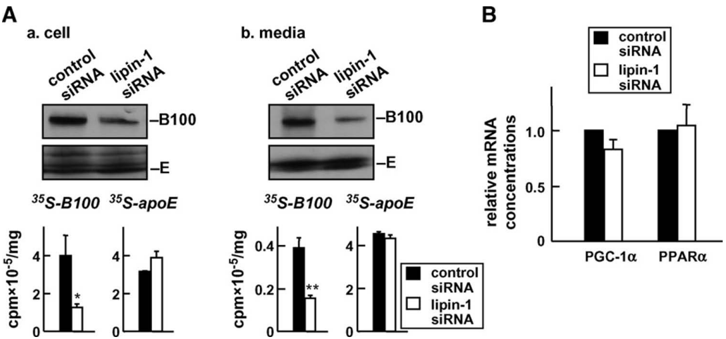
Fig. 6 Synthesis and secretion of [ 35 S]apoB100 in lipin-1 knockdown cells. A: Control or lipin-1 siRNAtreated cells were labeled with [ 35 S]methionine/cysteine as described in the legend of Fig. 5. Top, representative fluorograms of cell-associated (left panel) or secreted (right panel) [ 35 S]apoB100 and -apoE. Bottom, radioactivity associated with apoB and apoE. * P , 0.05; ** P , 0.01 (Student ʼ s t -test of lipin vs. control). B: Effect of lipin-1 knockdown on the relative concentrations of peroxisome proliferator-activated receptora (PPAR a ) and PPAR coactivator protein-1 a (PGC-1 a ) mRNAs. Error bars indicate 6 SD (n 5 3).
Fig. 6 Synthesis and secretion of [ 35 S]apoB100 in lipin-1 knockdown cells. A: Control or lipin-1 siRNAtreated cells were labeled with [ 35 S]methionine/cysteine as described in the legend of Fig. 5. Top, representative fluorograms of cell-associated (left panel) or secreted (right panel) [ 35 S]apoB100 and -apoE. Bottom, radioactivity associated with apoB and apoE. * P , 0.05; ** P , 0.01 (Student ʼ s t -test of lipin vs. control). B: Effect of lipin-1 knockdown on the relative concentrations of peroxisome proliferator-activated receptora (PPAR a ) and PPAR coactivator protein-1 a (PGC-1 a ) mRNAs. Error bars indicate 6 SD (n 5 3).CC-BY · From the PDF
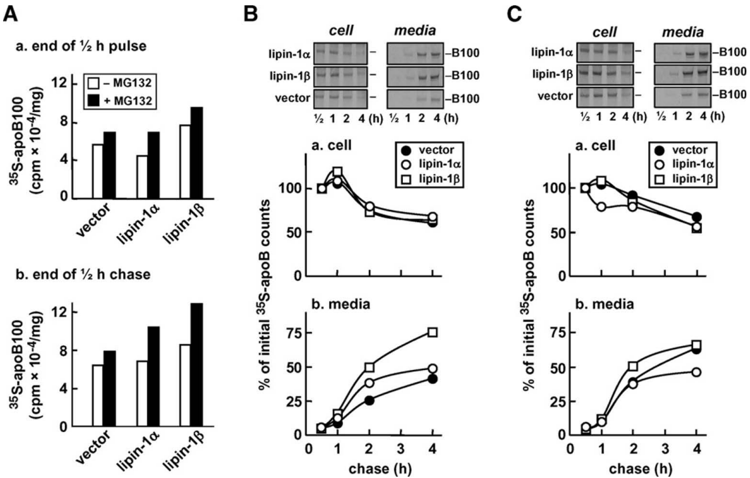
Fig. 7 Pulse-chase analysis of apoB100. Cells were pulse-labeled with [ 35 S]methionine/cysteine (75 m Ci/dish) for 30 min in the absence or presence of the proteasomal inhibitor MG132 (25 m M)and ' chased ' for up to 4 h. Both pulse and chase media contained 20% serum and 0.4 mM oleate. The 35 S-labeled apoB100 was recovered from cells and media, respectively, at the indicated times by immunoprecipitation, resolved by SDS-PAGE, and subjected to fluorography. A: Radioactivity counts associated with cell [ 35 S]apoB100 at the end of a 30 min pulse (panel a) and at the end of a 30 min chase (panel b) in the absence (open bars) or presence (closed bars) of MG132. B, C: Top, representative fluorograms of [ 35 S]apoB100 associated with cell or media in the absence (B) or presence (C) of MG132 during chase. Radioactivity associated with apoB100 in cells (panel a) or media (panel b) was quantified, and data are presented as percent of initial counts, which are counts associated with cell [ 35 S]apoB100 at the end of a 30 min chase. The experiment was repeated, and identical results were obtained.
Fig. 7 Pulse-chase analysis of apoB100. Cells were pulse-labeled with [ 35 S]methionine/cysteine (75 m Ci/dish) for 30 min in the absence or presence of the proteasomal inhibitor MG132 (25 m M)and ' chased ' for up to 4 h. Both pulse and chase media contained 20% serum and 0.4 mM oleate. The 35 S-labeled apoB100 was recovered from cells and media, respectively, at the indicated times by immunoprecipitation, resolved by SDS-PAGE, and subjected to fluorography. A: Radioactivity counts associated with cell [ 35 S]apoB100 at the end of a 30 min pulse (panel a) and at the end of a 30 min chase (panel b) in the absence (open bars) or presence (closed bars) of MG132. B, C: Top, representative fluorograms of [ 35 S]apoB100 associated with cell or media in the absence (B) or presence (C) of MG132 during chase. Radioactivity associated with apoB100 in cells (panel a) or media (panel b) was quantified, and data are presented as percent of initial counts, which are counts associated with cell [ 35 S]apoB100 at the end of a 30 min chase. The experiment was repeated, and identical results were obtained.CC-BY · From the PDF
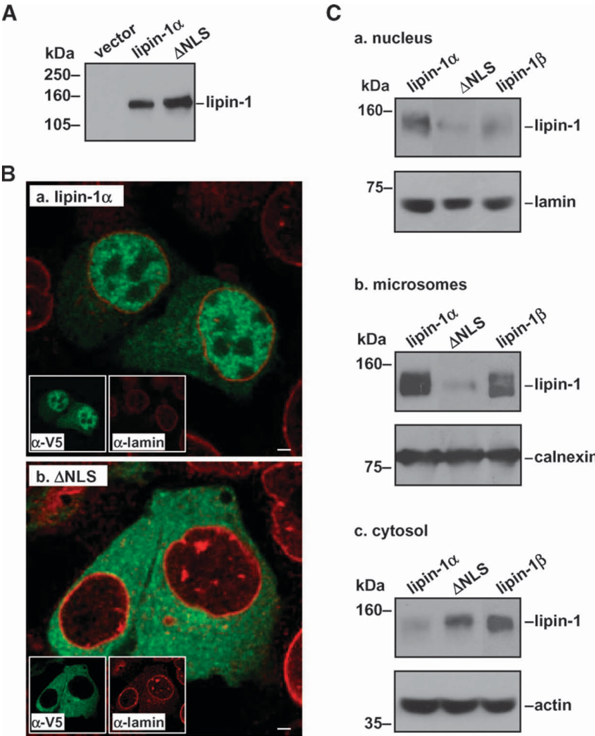
Fig. 8 Expression of the nuclear localization signal deletion ( D NLS) mutant form of lipin-1 a . A: Western blot analysis of the expressed lipin-1 a and D NLS in transfected cells. The experiment was performed essentially the same as described in the legend of Fig. 1A. B: Representative double immunofluorescent microscopic images of lipin-1 a (panel a) or D NLS (panel b) expressing cells. Images of lipin-1 (green) or lamin (red) staining are shown in insets. Scale bar 5 2 m m. C: Western blots of lipin-1 a , D NLS, and lipin-1 b in the nucleus (panel a), microsomes (panel b), and cytosol (panel c) fractions. Lamin, calnexin, and actin were probed as markers for nucleus, endoplasmic reticulum, and cytosol, respectively.
Fig. 8 Expression of the nuclear localization signal deletion ( D NLS) mutant form of lipin-1 a . A: Western blot analysis of the expressed lipin-1 a and D NLS in transfected cells. The experiment was performed essentially the same as described in the legend of Fig. 1A. B: Representative double immunofluorescent microscopic images of lipin-1 a (panel a) or D NLS (panel b) expressing cells. Images of lipin-1 (green) or lamin (red) staining are shown in insets. Scale bar 5 2 m m. C: Western blots of lipin-1 a , D NLS, and lipin-1 b in the nucleus (panel a), microsomes (panel b), and cytosol (panel c) fractions. Lamin, calnexin, and actin were probed as markers for nucleus, endoplasmic reticulum, and cytosol, respectively.CC-BY · From the PDF
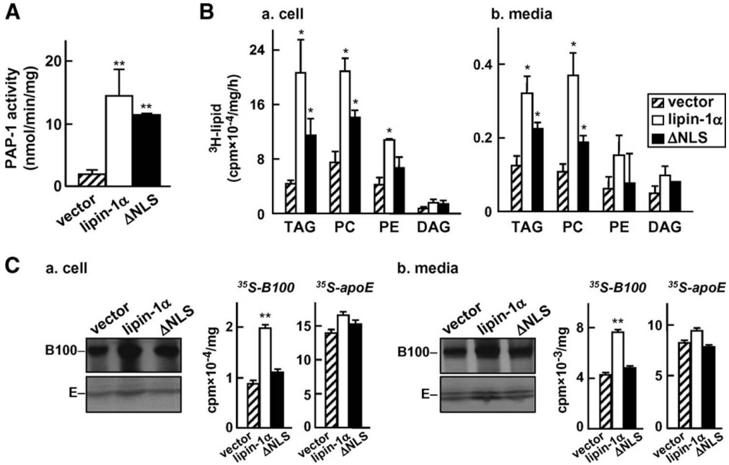
Fig. 9 The D NLS mutation compromised the effect of lipin-1 a on [ 35 S]apoB100 and [ 3 H]TAG synthesis/ secretion. A: PAP-1 activity in control, lipin-1 a , and D NLS transfected cells. The experiment was performed as described in the legend of Fig. 1B. B: Metabolic labeling of lipids in control, lipin-1 a , and D NLS transfected cells. The experiment was performed as described in the legend of Fig. 2D. C: Metabolic labeling of apoB and apoE in control, lipin-1 a , and D NLS transfected cells. The experiment was performed as described in the legend of Fig. 5A. * P , 0.05; ** P , 0.01 (Student ʼ s t -test of lipin vs. control). Error bars indicate 6 SD (n 5 3).
Fig. 9 The D NLS mutation compromised the effect of lipin-1 a on [ 35 S]apoB100 and [ 3 H]TAG synthesis/ secretion. A: PAP-1 activity in control, lipin-1 a , and D NLS transfected cells. The experiment was performed as described in the legend of Fig. 1B. B: Metabolic labeling of lipids in control, lipin-1 a , and D NLS transfected cells. The experiment was performed as described in the legend of Fig. 2D. C: Metabolic labeling of apoB and apoE in control, lipin-1 a , and D NLS transfected cells. The experiment was performed as described in the legend of Fig. 5A. * P , 0.05; ** P , 0.01 (Student ʼ s t -test of lipin vs. control). Error bars indicate 6 SD (n 5 3).CC-BY · From the PDF

Verification

Claims the paper makes

The claims and statistics of this paper haven’t been checked yet.

Run the check — free, no account needed. It reads the open-access text and checks the sources it cites.

A few free checks a day · papers already verified open instantly · results are public

Claims other papers make about this one

Each is checked against this paper’s own text: does it say what the citing paper says it does?

Self-check

Percentages, sums and reported differences re-computed from the paper’s own numbers.

The self-check needs the paper’s full text.

Citations

Cites

Show all 49 references

Cited by

Metadata

Authors
Khalil, M. B., Sundaram, M., Zhang, H.-Y., Links, P. H., Raven, J. F., Manmontri, B., Sariahmetoglu, M., Tran, K., Reue, K., Brindley, D. N., & Yao, Z.
Venue
Journal of Lipid Research
Publisher
Elsevier BV
Published
2009-01
Volume
50
Issue
1
Pages
47-58
ISSN
0022-2275
Cited by
75
References
49
Language
en
Licence

About these checks

Registry, retraction, Cites and statistics results are computed, not judged, with one exception: a printed reference that no index lists is read once by a model before it counts as a citation error. Claims are extracted by a model and kept only when their quote appears verbatim in the text; each cited source is then checked, with a model’s help, for whether it says what the claim relies on. Those verdicts can be wrong — read the claim’s quote and the cited source before relying on one.

Statistics and arithmetic are recomputed, not judged.

Confidence bands are shown only for fields calibrated on our annotated test set. None is calibrated yet, so no band is shown.

What counts as a claim ›How we measure confidence ›How we check this ›

Are you an author, or do you see a problem with this page? Request a review

Data sources

Bibliographic data: Semantic Scholar, OpenAlex, Crossref.

Contains information from the Semantic Scholar Academic Graph Datasets, made available under the ODC Attribution License (ODC-BY 1.0).

Semantic Scholar’s data is described in: Kinney, R., et al. (2023). The Semantic Scholar Open Data Platform. arXiv:2301.10140.