

The DOI matches its Crossref record; 43 of the 43 references it cites were found in a registry or an index.
The Programming of Cardiac Hypertrophy in the Offspring by Maternal Obesity Is Associated with Hyperinsulinemia, AKT, ERK, and mTOR Activation
Open accessAbstract
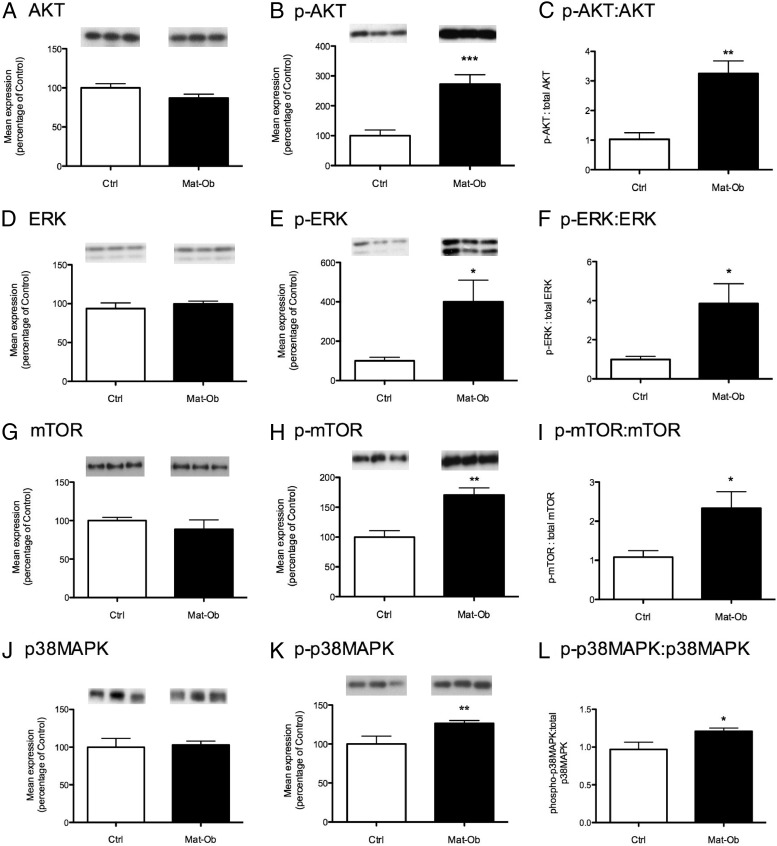
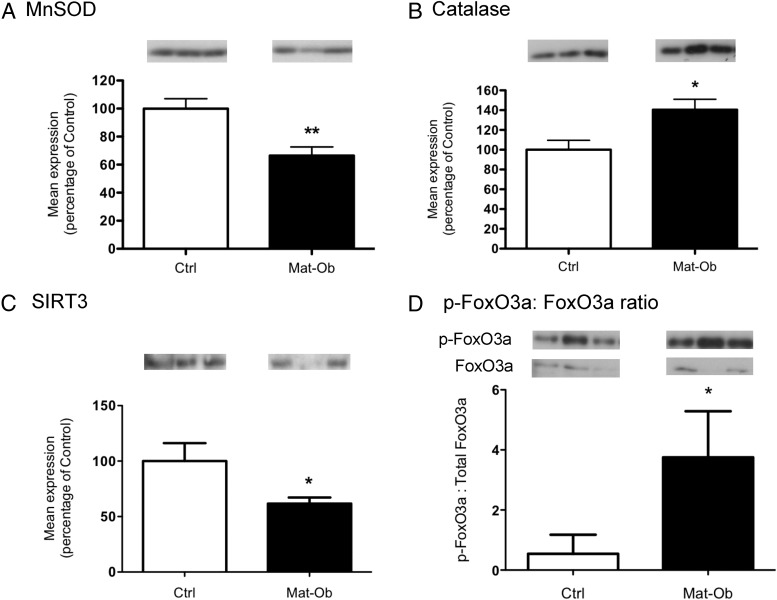
Human and animal studies suggest that suboptimal early nutrition during critical developmental periods impacts long-term health. For example, maternal overnutrition during pregnancy and lactation in mice programs insulin resistance, obesity, and endothelial dysfunction in the offspring. Here we investigated the effects of diet-induced maternal obesity on the offspring cardiac phenotype and explored potential underlying molecular mechanisms. Dams fed the obesogenic diet were heavier (P < 0.01) and fatter (P < 0.0001) than controls throughout pregnancy and lactation. There was no effect of maternal obesity on offspring body weight or body composition up to 8 wk of age. However, maternal obesity resulted in increased offspring cardiac mass (P < 0.05), increased heart-body weight (P < 0.01), heart weight-tibia length (P < 0.05), increased left ventricular free wall thickness and area (P < 0.01 and P < 0.05, respectively), and increased myocyte width (P < 0.001). Consistent with these structural changes, the expression of molecular markers of cardiac hypertrophy were also increased [Nppb(BNP), Myh7-Myh6(βMHC-αMHC) (both P < 0.05) and mir-133a (P < 0.01)]. Offspring were hyperinsulinemic and displayed increased insulin action through AKT (P < 0.01), ERK (P < 0.05), and mammalian target of rapamycin (P < 0.05). p38MAPK phosphorylation was also increased (P < 0.05), suggesting pathological remodeling. Increased Ncf2(p67(phox)) expression (P < 0.05) and impaired manganese superoxide dismutase levels (P < 0.01) suggested oxidative stress, which was consistent with an increase in levels of 4-hydroxy-2-trans-nonenal (a measure of lipid peroxidation). We propose that maternal diet-induced obesity leads to offspring cardiac hypertrophy, which is independent of offspring obesity but is associated with hyperinsulinemia-induced activation of AKT, mammalian target of rapamycin, ERK, and oxidative stress.
Overview
The claims and statistics of this paper haven’t been checked yet.
Run the check — free, no account needed. It reads the open-access text and checks the sources it cites.
Integrity signals
Registry
Cites
Statistics
Figures
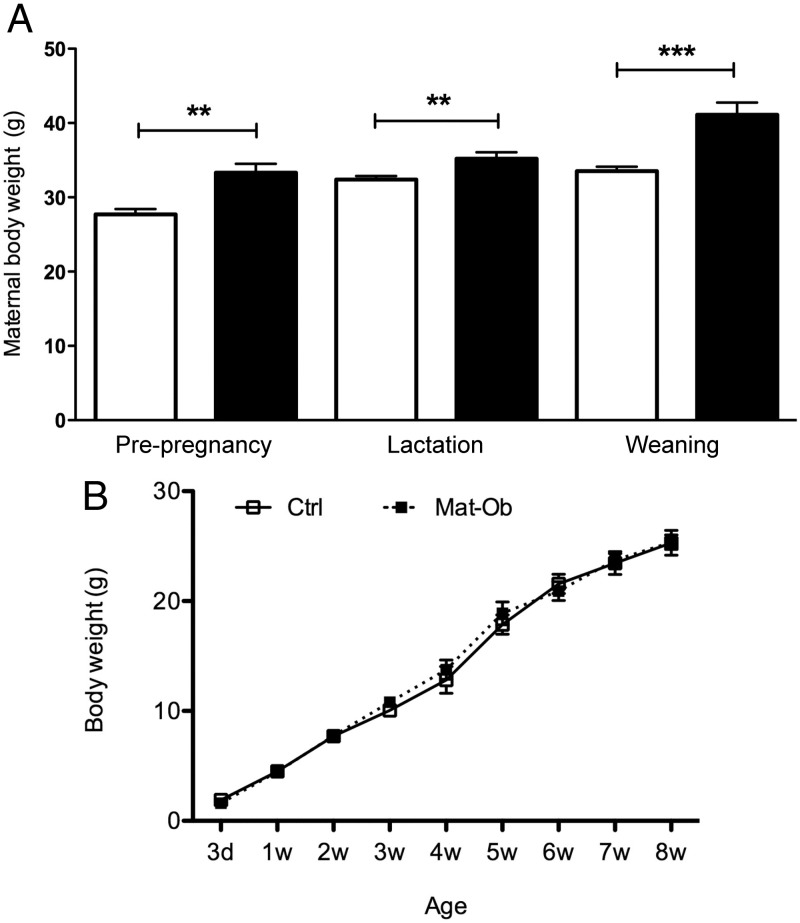
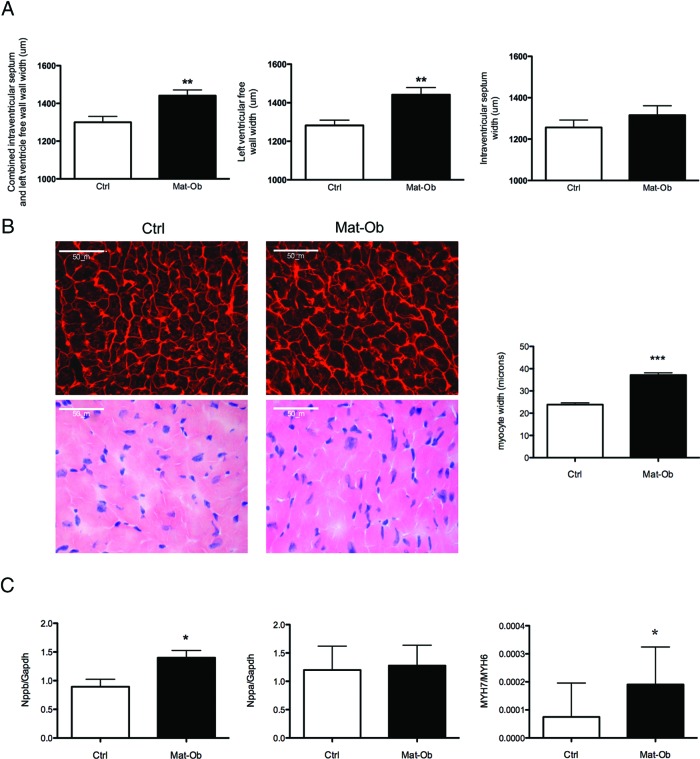
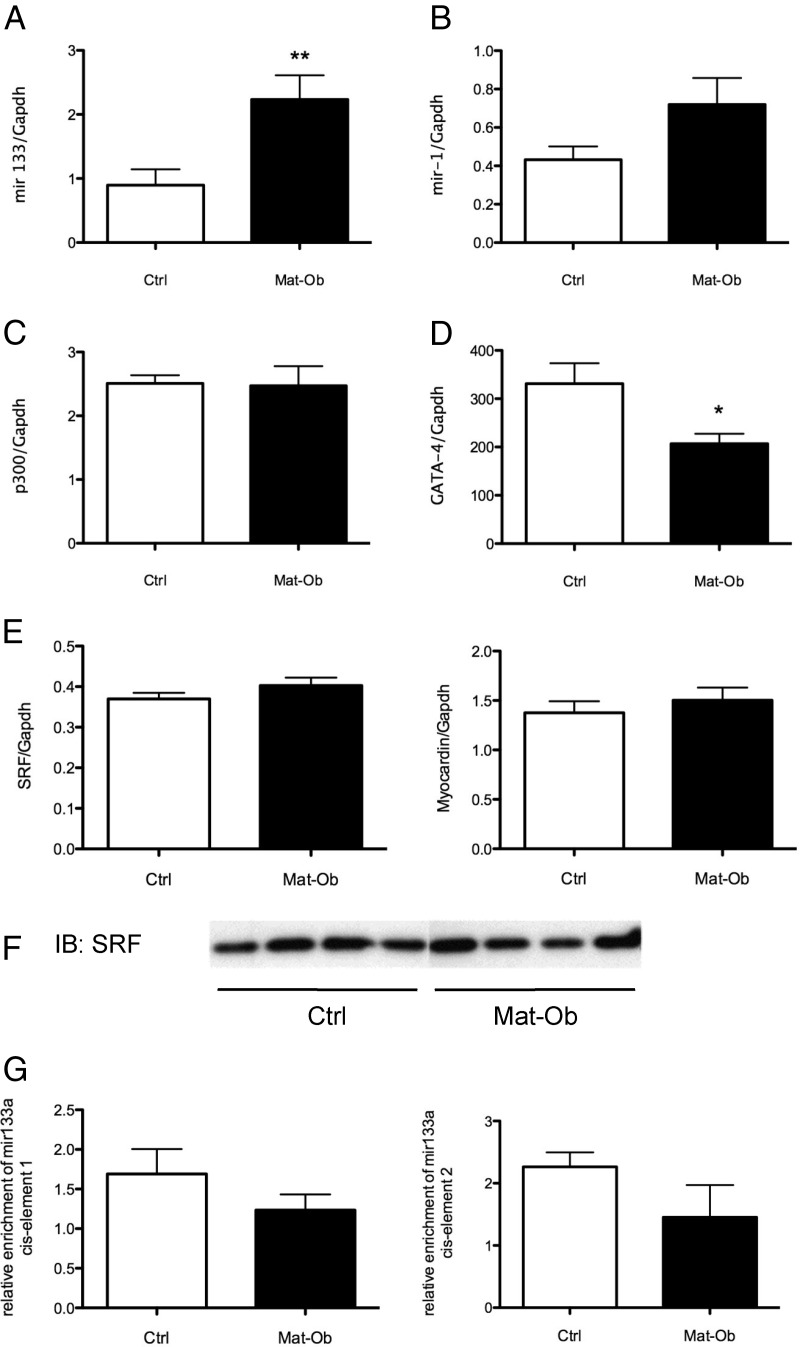
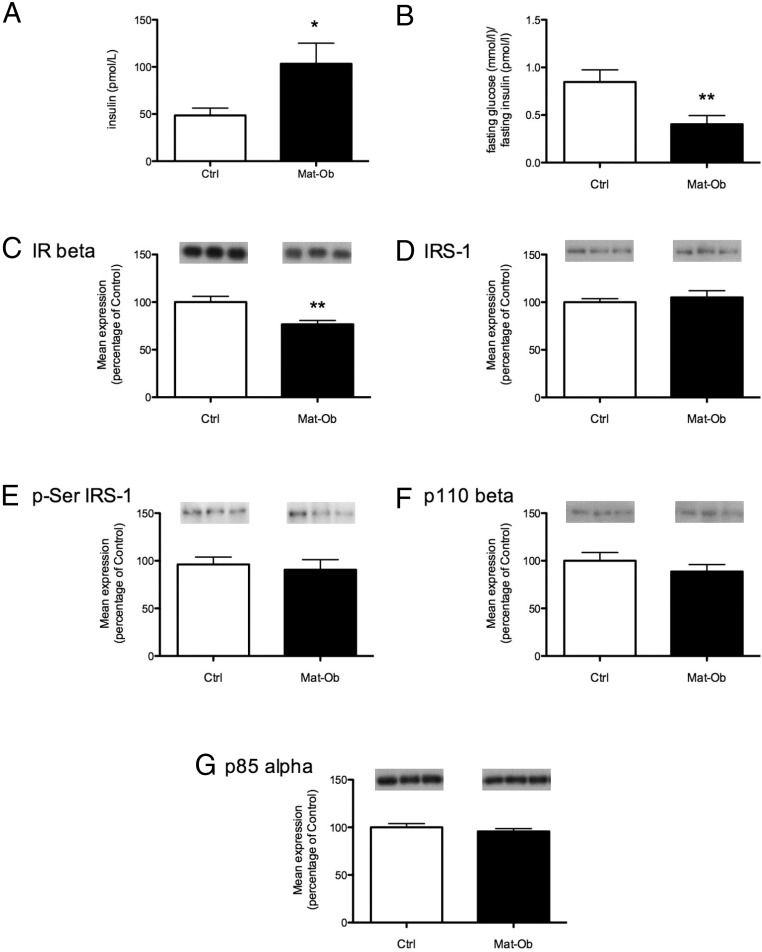
Verification
Claims the paper makes
The claims and statistics of this paper haven’t been checked yet.
Run the check — free, no account needed. It reads the open-access text and checks the sources it cites.
Claims other papers make about this one
Each is checked against this paper’s own text: does it say what the citing paper says it does?
The source backs part of the claim, not all of it — or backs it for a different population, condition or comparison.
In the citing paper
“the Ozanne group showed that young adult male offspring (at 3 and 8 weeks of age) from obese dams have increased heart weight, LV wall thickness and increased heart weight to body weight ratio, compared to offspring from control dams [93,112].”
From Recent Experimental Studies of Maternal Obesity, Diabetes during Pregnancy and the Developmental Origins of Cardiovascular Disease (2022) · cites this paper as [93]
Experimental — accuracy not yet measuredThe source backs part of the claim, not all of it — or backs it for a different population, condition or comparison.
In the citing paper
“In line with cardiac hypertrophy, increased expression of Nppb, Acta1 and the ratio of Myh7:Myh6 gene expression were observed in the offspring of obese dams [93,112].”
From Recent Experimental Studies of Maternal Obesity, Diabetes during Pregnancy and the Developmental Origins of Cardiovascular Disease (2022) · cites this paper as [93]
Experimental — accuracy not yet measuredThe source backs part of the claim, not all of it — or backs it for a different population, condition or comparison.
In the citing paper
“Moreover, the effect of maternal obesity on cellular cardiomyocyte hypertrophy were only observed in the 3- and 8-week-old offspring [93,112] and not 12-week-old offspring [112].”
From Recent Experimental Studies of Maternal Obesity, Diabetes during Pregnancy and the Developmental Origins of Cardiovascular Disease (2022) · cites this paper as [93]
Experimental — accuracy not yet measuredThe source backs part of the claim, not all of it — or backs it for a different population, condition or comparison.
In the citing paper
“Interestingly, phosphorylation of Akt at the activating Ser-473 site was elevated in hearts of offspring from obese dams, although this appeared to be mediated by increased p38-Mitogen-activated protein kinase signalling through Erk and mTOR [93]”
From Recent Experimental Studies of Maternal Obesity, Diabetes during Pregnancy and the Developmental Origins of Cardiovascular Disease (2022) · cites this paper as [93]
Experimental — accuracy not yet measuredThe cited source says what the claim attributes to it.
In the citing paper
“Interestingly, phosphorylation of Akt at the activating Ser-473 site was elevated in hearts of offspring from obese dams, although this appeared to be mediated by increased p38-Mitogen-activated protein kinase signalling through Erk and mTOR [93]”
From Recent Experimental Studies of Maternal Obesity, Diabetes during Pregnancy and the Developmental Origins of Cardiovascular Disease (2022) · cites this paper as [93]
The cited source says what the claim attributes to it.
In the citing paper
“Reduced levels of mitochondrial localized superoxide dismutase-2 in the hearts of offspring of obese dams [93] suggest that maternal obesity increases the sensitivity of the offspring myocardium to oxidative damage.”
From Recent Experimental Studies of Maternal Obesity, Diabetes during Pregnancy and the Developmental Origins of Cardiovascular Disease (2022) · cites this paper as [93]
The cited source says what the claim attributes to it.
In the citing paper
“In 8-week-old offspring of obese dams, the expression of insulin receptor-β, a key component for mediating insulin signalling in the heart, was reduced [93].”
From Recent Experimental Studies of Maternal Obesity, Diabetes during Pregnancy and the Developmental Origins of Cardiovascular Disease (2022) · cites this paper as [93]
The cited source says what the claim attributes to it.
In the citing paper
“Fernandez-Twinn et al. [93] discovered that exposure of the offspring to maternal obesity increased the cardiac expression of miR-133 and reduced the mRNA expression of one of its putative targets, Gata-4, which is upregulated in cardiac hypertrophy.”
From Recent Experimental Studies of Maternal Obesity, Diabetes during Pregnancy and the Developmental Origins of Cardiovascular Disease (2022) · cites this paper as [93]
The cited source says what the claim attributes to it.
In the citing paper
“Fernandez-Twinn et al. [93] discovered that exposure of the offspring to maternal obesity increased the cardiac expression of miR-133 and reduced the mRNA expression of one of its putative targets, Gata-4, which is upregulated in cardiac hypertrophy.”
From Recent Experimental Studies of Maternal Obesity, Diabetes during Pregnancy and the Developmental Origins of Cardiovascular Disease (2022) · cites this paper as [93]
The cited source says what the claim attributes to it.
In the citing paper
“Fernandez-Twinn et al. [93] discovered that exposure of the offspring to maternal obesity increased the cardiac expression of miR-133 and reduced the mRNA expression of one of its putative targets, Gata-4, which is upregulated in cardiac hypertrophy.”
From Recent Experimental Studies of Maternal Obesity, Diabetes during Pregnancy and the Developmental Origins of Cardiovascular Disease (2022) · cites this paper as [93]
The cited source says what the claim attributes to it.
In the citing paper
“Reduced levels of mitochondrial localized superoxide dismutase-2 in the hearts of offspring of obese dams [93] suggest that maternal obesity increases the sensitivity of the offspring myocardium to oxidative damage.”
From Recent Experimental Studies of Maternal Obesity, Diabetes during Pregnancy and the Developmental Origins of Cardiovascular Disease (2022) · cites this paper as [93]
The cited source says what the claim attributes to it.
In the citing paper
“suggesting that protein translation supporting pathologic cardiac hypertrophy was activated.”
From Recent Experimental Studies of Maternal Obesity, Diabetes during Pregnancy and the Developmental Origins of Cardiovascular Disease (2022) · cites this paper as [93]
Self-check
Percentages, sums and reported differences re-computed from the paper’s own numbers.
The self-check needs the paper’s full text.
Citations
Cites
2 retracted
Xu, C., Lu, Y., Pan, Z., Chu, W., Luo, X., Lin, H., Xiao, J., Shan, H., Wang, Z., & Yang, B. (2007) · Journal of Cell Science · doi:10.1242/jcs.010728 · Cited by 437
RetractedXiao, J., Luo, X., Lin, H., Zhang, Y., Lu, Y., Wang, N., Zhang, Y., Yang, B., & Wang, Z. (2007) · Journal of Biological Chemistry · doi:10.1074/jbc.c700015200 · Cited by 233
RetractedGUNDERSEN, H. J. G., BENDTSEN, T. F., KORBO, L., MARCUSSEN, N., MØLLER, A., NIELSEN, K., NYENGAARD, J. R., PAKKENBERG, B., SØRENSEN, F. B., VESTERBY, A., et al. (1988) · APMIS · doi:10.1111/j.1699-0463.1988.tb05320.x · Cited by 2,929
The Developmental Origins of Adult Disease
Barker, D. J. P. (2004) · Journal of the American College of Nutrition · doi:10.1080/07315724.2004.10719428 · Cited by 1,854
MicroRNA-133 controls cardiac hypertrophy
Carè, A., Catalucci, D., Felicetti, F., Bonci, D., Addario, A., Gallo, P., Bang, M., Segnalini, P., Gu, Y., Dalton, N. D., et al. (2007) · Nature Medicine · doi:10.1038/nm1582 · Cited by 1,785
Jia, Q.-W., Chen, Z.-H., Ding, X.-Q., Liu, J.-Y., Ge, P.-C., An, F.-H., Li, L.-H., Wang, L.-S., Ma, W.-Z., Yang, Z.-J., et al. (2017) · Cellular Physiology and Biochemistry · doi:10.1159/000478071 · Cited by 1,694
Oxygen, oxidative stress, hypoxia, and heart failure
Giordano, F. J. (2005) · Journal of Clinical Investigation · doi:10.1172/jci24408 · Cited by 1,515
Dysregulation of Cardiogenesis, Cardiac Conduction, and Cell Cycle in Mice Lacking miRNA-1-2
Zhao, Y. B., Ransom, J. F., Li, A., Vedantham, V., von Drehle, M., Muth, A. N., Tsuchihashi, T., McManus, M. T., Schwartz, R. J., & Srivastava, D. (2007) · Cell · doi:10.1016/j.cell.2007.03.030 · Cited by 1,445
Fetal nutrition and adult disease
Godfrey, K. M., & Barker, D. J. P. (2000) · American Journal of Clinical Nutrition · doi:10.1093/ajcn/71.5.1344s · Cited by 1,329
Shiojima, I. (2005) · Journal of Clinical Investigation · doi:10.1172/jci24682 · Cited by 935
Samuelsson, A.-M., Matthews, P. A., Argenton, M., Christie, M. R., McConnell, J. M., Jansen, E. H. J. M., Piersma, A. H., Ozanne, S. E., Twinn, D. F., Remacle, C., et al. (2008) · Hypertension · doi:10.1161/hypertensionaha.107.101477 · Cited by 923
Self-citationTao, R., Coleman, M. C., Pennington, J. D., Ozden, O., Park, S.-H., Jiang, H., Kim, H.-S., Flynn, C. R., Hill, S., Hayes McDonald, W., et al. (2010) · Molecular Cell · doi:10.1016/j.molcel.2010.12.013 · Cited by 899
Liu, N., Bezprozvannaya, S., Williams, A. H., Qi, X., Richardson, J. A., Bassel‐Duby, R., & Olson, E. N. (2008) · Genes & Development · doi:10.1101/gad.1738708 · Cited by 809
Tumour suppressor SIRT3 deacetylates and activates manganese superoxide dismutase to scavenge ROS
Chen, Y., Zhang, J., Lin, Y., Lei, Q., Guan, K., Zhao, S., & Xiong, Y. (2011) · The EMBO Reports · doi:10.1038/embor.2011.65 · Cited by 572
Poornima, I. G., Parikh, P., & Shannon, R. P. (2006) · Circulation Research · doi:10.1161/01.res.0000207406.94146.c2 · Cited by 567
Akt1 Is Required for Physiological Cardiac Growth
DeBosch, B. J., Treskov, I., Lupu, T. S., Weinheimer, C. J., Kovács, A. D., COURTOIS, M. R., & Muslin, A. J. (2006) · Circulation · doi:10.1161/circulationaha.105.595231 · Cited by 536
McMullen, J., Sherwood, M., Tarnavski, O., Zhang, L., Dorfman, A., Shioi, T., & Izumo, S. (2004) · Circulation · doi:10.1161/01.cir.0000130641.08705.45 · Cited by 530
The role of natriuretic peptides in cardioprotection
Nishikimi, T., MAEDA, N., & MATSUOKA, H. (2005) · Cardiovascular Research · doi:10.1016/j.cardiores.2005.10.001 · Cited by 493
Role of oxidative stress in transition of hypertrophy to heart failure
Dhalla, A. K., Hill, M. F., & Singal, P. K. (1996) · Journal of the American College of Cardiology · doi:10.1016/0735-1097(96)00140-4 · Cited by 422
Takeya, R., Ueno, N., Kami, K., Taura, M., Kohjima, M., Izaki, T., Nunoi, H., & Sumimoto, H. (2003) · Journal of Biological Chemistry · doi:10.1074/jbc.m212856200 · Cited by 380
Maternal metabolism and obesity: modifiable determinants of pregnancy outcome
Nelson, S. M., Matthews, P., & Poston, L. (2009) · Human Reproduction Update · doi:10.1093/humupd/dmp050 · Cited by 372
Effects of Prenatal Exposure to the Dutch Famine on Adult Disease in Later Life: An Overview
Roseboom, T. J., van der Meulen, J., Ravelli, A. C. J., Osmond, C., Barker, D. J. P., & Bleker, O. P. (2001) · Twin Research · doi:10.1375/1369052012605 · Cited by 356
MTORC1 regulates cardiac function and myocyte survival through 4E-BP1 inhibition in mice
Zhang, D., Contu, R., Latronico, M. V. G., Zhang, J. L., Rizzi, R., Catalucci, D., Miyamoto, S., Huang, K., Ceci, M., Gu, Y., et al. (2010) · Journal of Clinical Investigation · doi:10.1172/jci43008 · Cited by 338
The in vivo role of p38 MAP kinases in cardiac remodeling and restrictive cardiomyopathy
Liao, P., Georgakopoulos, D., Kovács, A., Zheng, M., Lerner, D. L., Pu, H., Saffitz, J. E., Chien, K. R., Xiao, R.-P., Kass, D. A., et al. (2001) · Proceedings of the National Academy of Sciences · doi:10.1073/pnas.211086598 · Cited by 333
Gene Expression of Antioxidative Enzymes in the Human Heart
Dieterich, S., Bieligk, U., Beulich, K., Hasenfuss, G. P., & Prestle, J. (2000) · Circulation · doi:10.1161/01.cir.101.1.33 · Cited by 327
Clerk, A., Michael, A., & Sugden, P. H. (1998) · The Journal of Cell Biology · doi:10.1083/jcb.142.2.523 · Cited by 313
Oxidative Stress Causes Heart Failure with Impaired Mitochondrial Respiration
Nojiri, H., Shimizu, T., Funakoshi, M., Yamaguchi, O., Zhou, H., Kawakami, S., Ohta, Y., Sami, M., Tachibana, T., Ishikawa, H., et al. (2006) · Journal of Biological Chemistry · doi:10.1074/jbc.m602118200 · Cited by 230
Krishnaveni, G. V., Veena, S. R., Hill, J. C., Kehoe, S., Karat, S. C., & Fall, C. H. D. (2010) · Diabetes Care · doi:10.2337/dc09-1393 · Cited by 203
Oxidative stress and heart failure
Singh, N., Dhalla, A. K., Seneviratne, C. K., & Singal, P. K. (1995) · Molecular and Cellular Biochemistry · doi:10.1007/bf00944786 · Cited by 194
Horie, T., Ono, K., Nishi, H., Iwanaga, Y., Nagao, K., Kinoshita, M., Kuwabara, Y., Takanabe, R., Hasegawa, K., Kita, T., et al. (2009) · Biochemical and Biophysical Research Communications · doi:10.1016/j.bbrc.2009.08.136 · Cited by 188
Effects of Prenatal Exposure to the Dutch Famine on Adult Disease in Later Life: An Overview
Roseboom, T. J., van der Meulen, J., Ravelli, A. C. J., Osmond, C., Barker, D. J. P., & Bleker, O. P. (2001) · Twin Research · doi:10.1375/twin.4.5.293 · Cited by 181
Early life nutrition and metabolic programming
Fernandez‐Twinn, D. S., & Ozanne, S. E. (2010) · Annals of the New York Academy of Sciences · doi:10.1111/j.1749-6632.2010.05798.x · Cited by 180
Self-citationBoerschmann, H., Pflüger, M., Henneberger, L., Ziegler, A., & Hummel, S. (2010) · Diabetes Care · doi:10.2337/dc10-0139 · Cited by 170
Maternal obesity and congenital heart defects: a population-based study
Mills, J. L., Troendle, J. F., Conley, M. R., Carter, T., & Druschel, C. M. (2010) · American Journal of Clinical Nutrition · doi:10.3945/ajcn.2009.28865 · Cited by 169
Shelley, P., Martin‐Gronert, M. S., Rowlerson, A. M., Poston, L., Heales, S., Hargreaves, I. P., McConnell, J. M. L., Ozanne, S. E., & Fernandez‐Twinn, D. S. (2009) · American Journal of Physiology-Regulatory, Integrative and Comparative Physiology · doi:10.1152/ajpregu.00146.2009 · Cited by 110
Self-citationMolkentin, J. D., & Robbins, J. M. (2008) · Journal of Molecular and Cellular Cardiology · doi:10.1016/j.yjmcc.2008.09.002 · Cited by 104
Selective insulin action on skin, ovary, and heart in insulin-resistant states
Geffner, M. E., & Golde, D. W. (1988) · Diabetes Care · doi:10.2337/diacare.11.6.500 · Cited by 97
Zarrouki, B., Soares, A. F., Guichardant, M., Lagarde, M., & Géloën, A. (2007) · FEBS Letters · doi:10.1016/j.febslet.2007.04.048 · Cited by 76
Lee, H., Jang, H. C., Park, H. K., & Cho, N. H. (2007) · Diabetes Research and Clinical Practice · doi:10.1016/j.diabres.2007.03.023 · Cited by 72
Myocardial hypertrophy and dysfunction in maternal diabetes
Zielinsky, P., & Piccoli, A. L., Jr. (2012) · Early Human Development · doi:10.1016/j.earlhumdev.2012.02.006 · Cited by 62
Diminished GATA4 Protein Levels Contribute to Hyperglycemia-induced Cardiomyocyte Injury
Kobayashi, S., Mao, K., Zheng, H., Wang, X., Patterson, C., O’Connell, T. D., & Liang, Q. (2007) · Journal of Biological Chemistry · doi:10.1074/jbc.m703048200 · Cited by 55
Kumagai, T., Nakamura, Y., Osawa, T., & Uchida, K. (2002) · Archives of Biochemistry and Biophysics · doi:10.1006/abbi.2001.2601 · Cited by 52
Clark, W. A., Rudnick, S. J., Andersen, L. C., & LaPres, J. J. (1994) · Journal of Biological Chemistry · doi:10.1016/s0021-9258(18)47286-9 · Cited by 14
Cited by
Sorted by citations
Cheong, J. N., Wlodek, M. E., Moritz, K. M., & Cuffe, J. S. M. (2016) · The Journal of Physiology · doi:10.1113/jp271745 · Cited by 152
Blackmore, H. L., Niu, Y., Fernandez-Twinn, D. S., Tarry-Adkins, J. L., Giussani, D. A., & Ozanne, S. E. (2014) · Endocrinology · doi:10.1210/en.2014-1383 · Cited by 127
Self-citationKeleher, M. R., Zaidi, R., Shah, S., Oakley, M. E., Pavlatos, C., Idrissi, S. E., Xing, X., Li, D., Wang, T., & Cheverud, J. M. (2018) · PLoS ONE · doi:10.1371/journal.pone.0192606 · Cited by 124
Fernandez-Twinn, D. S., Alfaradhi, M. Z., Martin-Gronert, M. S., Duque-Guimaraes, D. E., Piekarz, A., Ferland-McCollough, D., Bushell, M., & Ozanne, S. E. (2014) · Molecular Metabolism · doi:10.1016/j.molmet.2014.01.007 · Cited by 114
Self-citationMaternal obesity and the developmental programming of hypertension: a role for leptin
Taylor, P. D., Samuelsson, A., & Poston, L. (2014) · Acta Physiologica · doi:10.1111/apha.12223 · Cited by 103
Metadata
- Authors
- Fernandez-Twinn, D. S., Blackmore, H. L., Siggens, L., Giussani, D. A., Cross, C. M., Foo, R., & Ozanne, S. E.
- Affiliations
- Metabolic Research Laboratories (D.S.F.-T., H.L.B., S.E.O.), University of Cambridge, Institute of Metabolic Science, Addenbrooke's Hospital, Cambridge CB2 0QQ, United Kingdom
- University of Cambridge (GB)
- Venue
- Endocrinology
- Publisher
- The Endocrine Society
- Published
- 2012-12-01
- Volume
- 153
- Issue
- 12
- Pages
- 5961-5971
- ISSN
- 0013-7227 (ISSN-L)
- 1945-7170
- PMC
- PMC3568261
- OpenAlex
- W2075074527
- Cited by
- 141
- References
- 43
- Citations by year
- 2026: 4 · 2025: 8 · 2024: 5 · 2023: 8 · 2022: 17 · 2021: 7 · 2020: 10 · 2019: 7 · 2018: 18 · 2017: 9 · 2016: 14 · 2015: 11 · 2014: 13 · 2013: 10
- FWCI
- 9.53
- Type
- journal article
- Language
- en
- Open access
- hybrid
- doi.org
- Licence
- Locations
- Endocrinology (publishedVersion, cc-by-nc)
- Europe PMC (PubMed Central) (publishedVersion, cc-by-nc)
- PubMed Central (publishedVersion, cc-by-nc)
- PubMed (publishedVersion)
- Funders
- Wellcome Trust (EU-FP7-, 086797, 086797/Z/08/Z)
- British Heart Foundation (FS/09/050, FS/09/029/27902)
- European Commission (289346)
- Directorate for Biological Sciences
- Medical Research Council (EU FP7)
- Biotechnology and Biological Sciences Research Council (BB/F015364/1)
- Topics
- Health Sciences › Medicine › Pediatrics, Perinatology and Child Health › Birth, Development, and Health
- Health Sciences › Medicine › Cardiology and Cardiovascular Medicine › Cardiac Fibrosis and Remodeling
- Health Sciences › Medicine › Cardiology and Cardiovascular Medicine › Cardiovascular Function and Risk Factors
- Keywords
- maternal obesity, diet-induced obesity, cardiac hypertrophy, hyperinsulinemia, Akt signaling, ERK signaling, mTOR signaling, p38 MAPK, oxidative stress, manganese superoxide dismutase, lipid peroxidation, cardiomyocyte hypertrophy, developmental programming, cardiac remodeling
- MeSH terms
- Animals, Body Composition, Body Weight, Female, Cardiomegaly, Hyperinsulinism, Male, Mice, Inbred C57BL, Mothers, Obesity, Phenotype, Pregnancy, Pregnancy, Animal, Prenatal Exposure Delayed Effects, Lipid Peroxidation, Oxidative Stress, Maternal Nutritional Physiological Phenomena, Extracellular Signal-Regulated MAP Kinases, Proto-Oncogene Proteins c-akt, Mice, TOR Serine-Threonine Kinases
About these checks
Registry, retraction, Cites and statistics results are computed, not judged, with one exception: a printed reference that no index lists is read once by a model before it counts as a citation error. Claims are extracted by a model and kept only when their quote appears verbatim in the text; each cited source is then checked, with a model’s help, for whether it says what the claim relies on. Those verdicts can be wrong — read the claim’s quote and the cited source before relying on one.
Statistics and arithmetic are recomputed, not judged.
Confidence bands are shown only for fields calibrated on our annotated test set. None is calibrated yet, so no band is shown.
What counts as a claim ›How we measure confidence ›How we check this ›
Are you an author, or do you see a problem with this page? Request a review
