

The DOI matches its Crossref record; 44 of the 46 references it cites were found in a registry or an index.
Link Between Increased Satiety Gut Hormones and Reduced Food Reward After Gastric Bypass Surgery for Obesity
Open accessAbstract
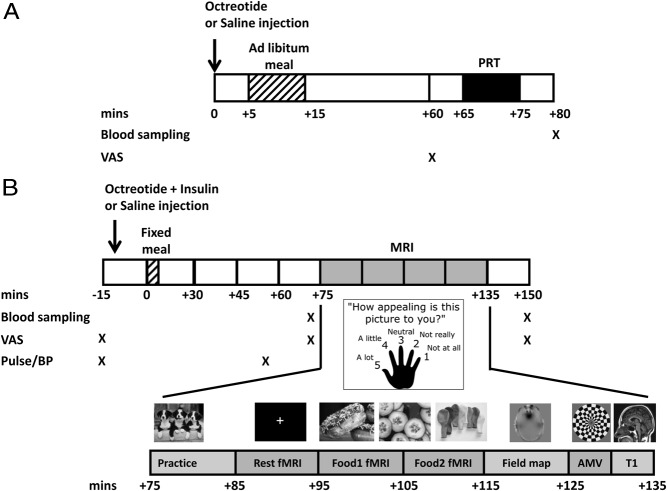
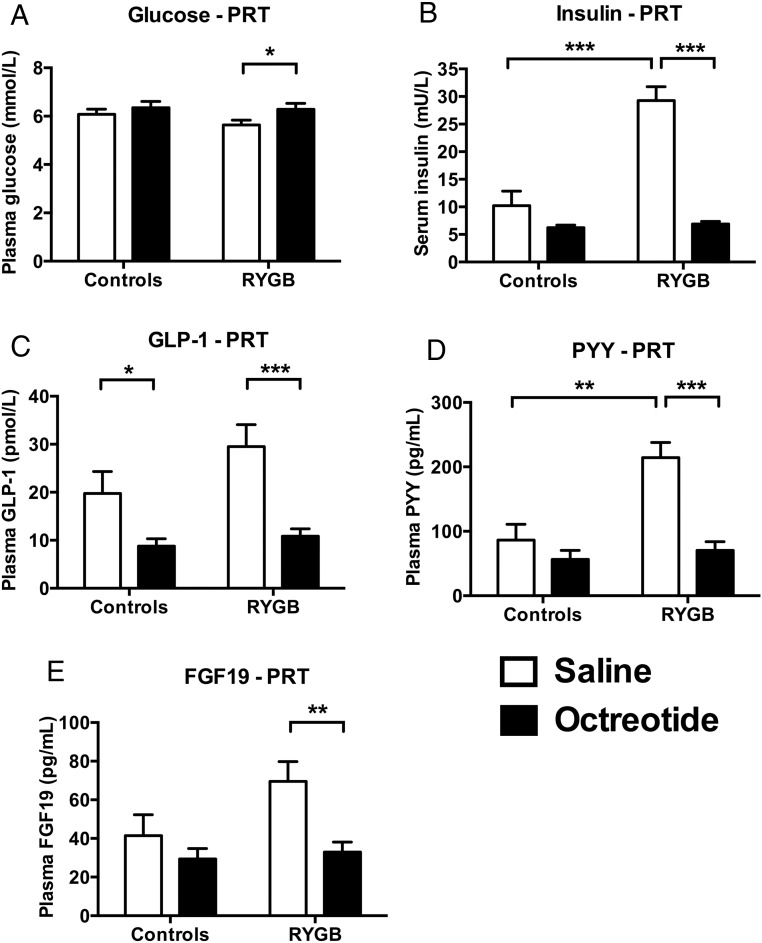
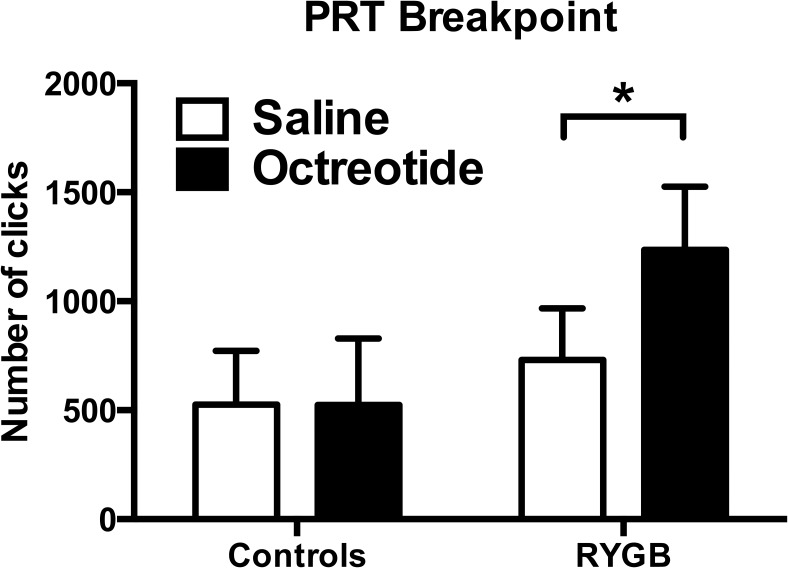
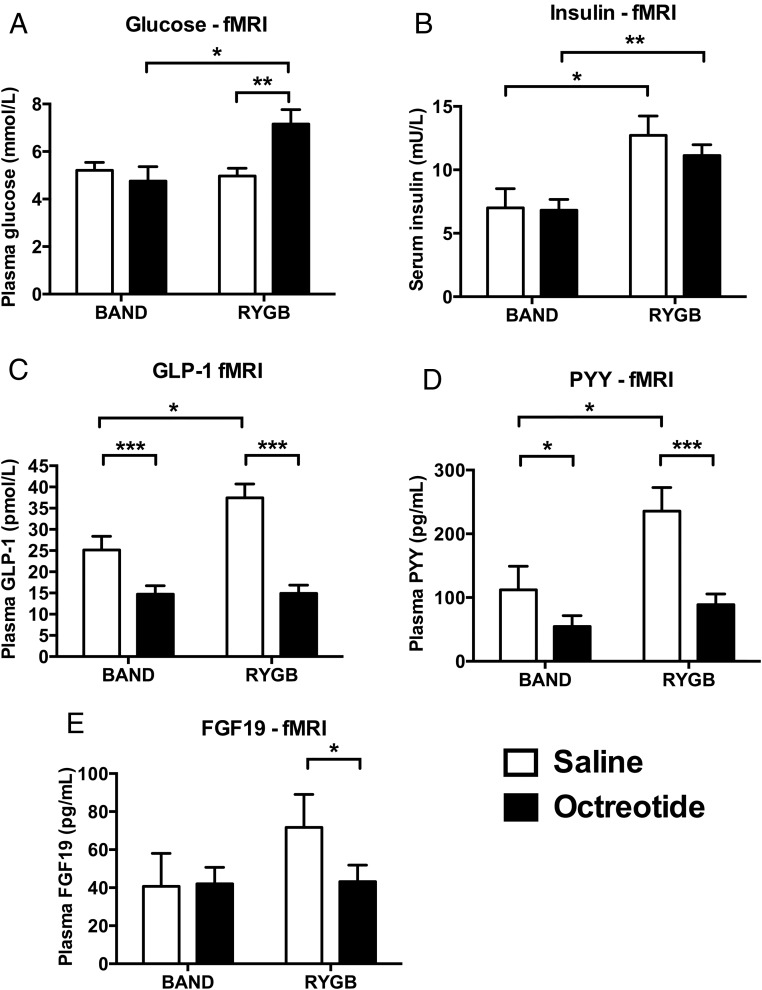
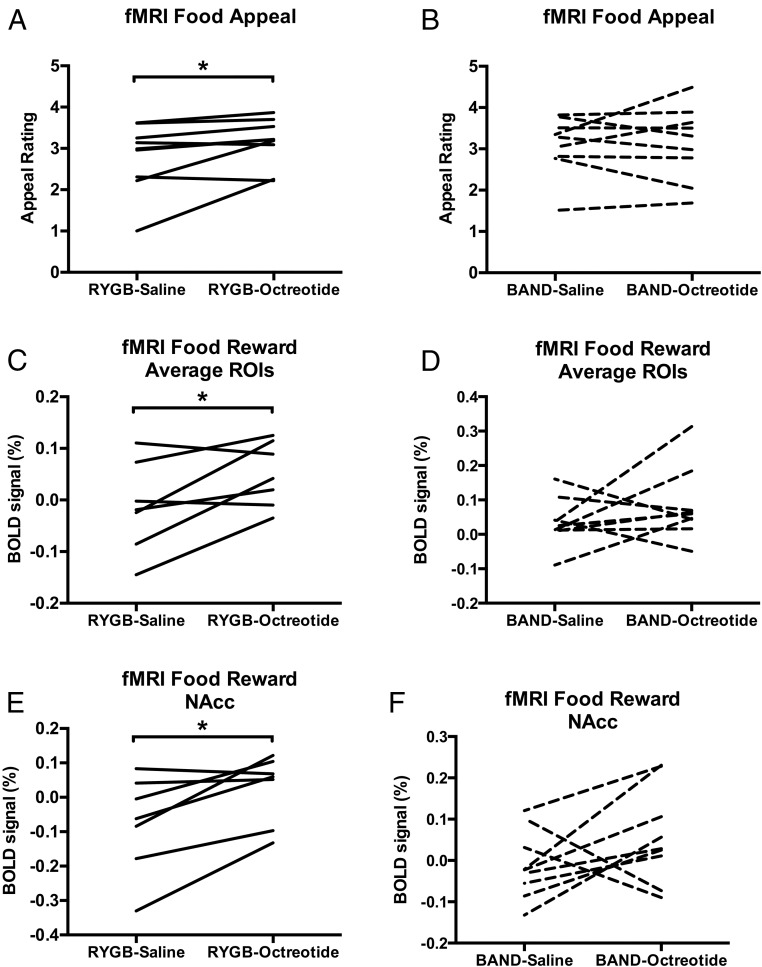
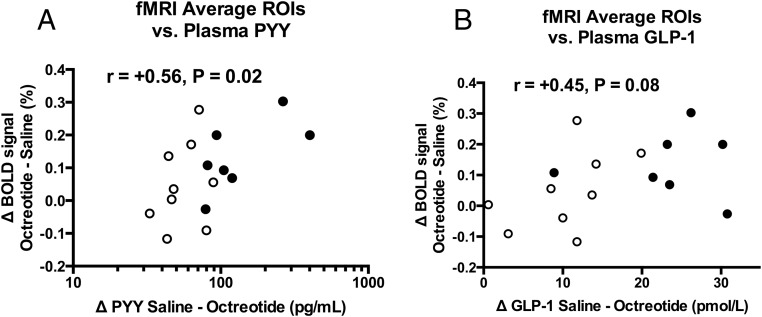
CONTEXT: Roux-en-Y gastric bypass (RYGB) surgery is an effective long-term intervention for weight loss maintenance, reducing appetite, and also food reward, via unclear mechanisms. OBJECTIVE: To investigate the role of elevated satiety gut hormones after RYGB, we examined food hedonic-reward responses after their acute post-prandial suppression. DESIGN: These were randomized, placebo-controlled, double-blind, crossover experimental medicine studies. PATIENTS: Two groups, more than 5 months after RYGB for obesity (n = 7-11), compared with nonobese controls (n = 10), or patients after gastric banding (BAND) surgery (n = 9) participated in the studies. INTERVENTION: Studies were performed after acute administration of the somatostatin analog octreotide or saline. In one study, patients after RYGB, and nonobese controls, performed a behavioral progressive ratio task for chocolate sweets. In another study, patients after RYGB, and controls after BAND surgery, performed a functional magnetic resonance imaging food picture evaluation task. MAIN OUTCOME MEASURES: Octreotide increased both appetitive food reward (breakpoint) in the progressive ratio task (n = 9), and food appeal (n = 9) and reward system blood oxygen level-dependent signal (n = 7) in the functional magnetic resonance imaging task, in the RYGB group, but not in the control groups. RESULTS: Octreotide suppressed postprandial plasma peptide YY, glucagon-like peptide-1, and fibroblast growth factor-19 after RYGB. The reduction in plasma peptide YY with octreotide positively correlated with the increase in brain reward system blood oxygen level-dependent signal in RYGB/BAND subjects, with a similar trend for glucagon-like peptide-1. CONCLUSIONS: Enhanced satiety gut hormone responses after RYGB may be a causative mechanism by which anatomical alterations of the gut in obesity surgery modify behavioral and brain reward responses to food.
Overview
The claims and statistics of this paper haven’t been checked yet.
Run the check — free, no account needed. It reads the open-access text and checks the sources it cites.
Integrity signals
Registry
Cites
Statistics
Figures
Verification
Claims the paper makes
The claims and statistics of this paper haven’t been checked yet.
Run the check — free, no account needed. It reads the open-access text and checks the sources it cites.
Claims other papers make about this one
Each is checked against this paper’s own text: does it say what the citing paper says it does?
The check wasn’t confident either way, so it gives no verdict — never disputed.
In the citing paper
“Some research has also suggested that, compared to normal-weight control groups, those who have obesity have higher levels of reward-based eating (45, 48–51).”
From Behavioral Interventions to Attenuate Driven Overeating and Weight Regain After Bariatric Surgery (2022) · cites this paper as [51]
Experimental — accuracy not yet measured
Self-check
Percentages, sums and reported differences re-computed from the paper’s own numbers.
The self-check needs the paper’s full text.
Citations
Cites
Bariatric Surgery and Long-term Cardiovascular Events
Sjöström, L., Peltonen, M., Jacobson, P., Sjöström, C. D., Karason, K., Wedel, H., Ahlin, S., Anveden, Å., Bengtsson, C., Bergmark, G., et al. (2012) · JAMA · doi:10.1001/jama.2011.1914 · Cited by 1,656
Roux, C. W. L., Aylwin, S. J. B., Batterham, R. L., Borg, C. M., Coyle, F., Prasad, V., Shurey, S., Ghatei, M. A., Patel, A. G., & Bloom, S. R. (2006) · Annals of Surgery · doi:10.1097/01.sla.0000183349.16877.84 · Cited by 985
FXR is a molecular target for the effects of vertical sleeve gastrectomy
Ryan, K. K., Tremaroli, V., Clemmensen, C., Kovatcheva-Datchary, P., Myronovych, A., Karns, R., Wilson-Pérez, H. E., Sandoval, D. A., Kohli, R., Bäckhed, F., et al. (2014) · Nature · doi:10.1038/nature13135 · Cited by 931
Gut hormones as mediators of appetite and weight loss after Roux-en-Y gastric bypass
le Roux, C. W., Welbourn, R., Werling, M., Osborne, A., Kokkinos, A., Laurenius, A., Lönroth, H., Fändriks, L., Ghatei, M. A., Bloom, S. R., et al. (2007) · Annals of Surgery · doi:10.1097/sla.0b013e3180caa3e3 · Cited by 741
PYY modulation of cortical and hypothalamic brain areas predicts feeding behaviour in humans
Batterham, R. L., Ffytche, D. H., Rosenthal, J., Zelaya, F. O., Barker, G. J., Withers, D. J., & Williams, S. (2007) · Nature · doi:10.1038/nature06212 · Cited by 489
GLP-1 Receptor Activation Modulates Appetite- and Reward-Related Brain Areas in Humans
van Bloemendaal, L., IJzerman, R. G., ten Kulve, J. S., Barkhof, F., Konrad, R. J., Drent, M. L., Veltman, D. J., & Diamant, M. (2014) · Diabetes · doi:10.2337/db14-0849 · Cited by 427
Dickson, S. L., Shirazi, R. H., Hansson, C., Bergquist, F., Nissbrandt, H., & Skibicka, K. P. (2012) · The Journal of Neuroscience · doi:10.1523/jneurosci.6326-11.2012 · Cited by 414
Pournaras, D. J., Glicksman, C., Vincent, R. P., Kuganolipava, S., Alaghband-Zadeh, J., Mahon, D., Bekker, J. H. R., Ghatei, M. A., Bloom, S. R., Walters, J. R. F., et al. (2012) · Endocrinology · doi:10.1210/en.2011-2145 · Cited by 383
Peptide YY3–36 and Glucagon-Like Peptide-17–36 Inhibit Food Intake Additively
Neary, N. M., Small, C. J., Druce, M. R., Park, A. J., Ellis, S. M., Semjonous, N. M., Dakin, C. L., Filipsson, K., Wang, F., Kent, A. S., et al. (2005) · Endocrinology · doi:10.1210/en.2005-0237 · Cited by 371
Mechanisms underlying weight loss after bariatric surgery
Miras, A. D., & le Roux, C. W. (2013) · Nature Reviews Gastroenterology & Hepatology · doi:10.1038/nrgastro.2013.119 · Cited by 360
Self-citation
Cited by
Sorted by citations
Items 101–119 of 119
Imágenes en obesidad: contribuyendo a un entendimiento más profundo de la enfermedad
Labbé, T., Arriagada, C. E. A., Leal, J. A. R., Araneda, P. V., & Ojeda, C. N. (2020) · Revista de Fomento Social · doi:10.4067/s0717-93082020000100017
Metabolic Surgery; Indications and Outcomes
Castagneto‐Gissey, L., Casella-Mariolo, J. R., & Mingrone, G. (2018) · Elsevier eBooks · doi:10.1016/b978-0-12-801238-3.65824-5
Wolf, L. S. (2020) · Digital Library of Theses and Dissertations (Universidade de São Paulo) · doi:10.11606/d.17.2020.tde-19082020-225251
Cancer Cachexia: The Comparative Mechanisms of Weight Loss after Esophagectomy and Bariatric Surgery
Tansey, D. J., & le Roux, C. W. (2021) · OBM Integrative and Complementary Medicine · doi:10.21926/obm.icm.2102017
Martini, F., Petrucciani, N., & Liagre, A. (2021) · Surgery for Obesity and Related Diseases · doi:10.1016/j.soard.2021.09.013
Functional connectivity of the reward circuit predicts changes in appetite in depressionPreprint
Kroemer, N. B., Opel, N., Teckentrup, V., Li, M., Grotegerd, D., Meinert, S. L., Lemke, H., Kircher, T. T. J., Nenadić, I., Krug, A., et al. (2022) · doi:10.31234/osf.io/4ua8x
Social Cognition and Food Decisions in Obesity
Tonelli, H. A., & Rotenberg, L. D. S. (2022) · Integrated science · doi:10.1007/978-3-030-96814-4_10 · Cited by 1
Melvin, A., le Roux, C. W., & Docherty, N. G. (2016) · EMJ Gastroenterology · doi:10.33590/emjgastroenterol/10310586
Microbiota as a factor influencing the change in taste preferences after bariatric surgery
Dzgoeva, F. K., & Silina, N. V. (2023) · Endocrine Surgery · doi:10.14341/serg12755
Lytvyak, E., Zarrinpar, A., Ore, C. L. D., Lee, E., Yazdani-Boset, K., Horgan, S., & Grunvald, E. L. (2024) · Obesity Pillars · doi:10.1016/j.obpill.2024.100111
Taste and odor interactions after metabolic surgery
Nicanor-Carreón, J. G., Rowitz, B. M., & Pepino, M. Y. (2024) · Chemical Senses · doi:10.1093/chemse/bjae034
Alharbi, A., Alfawaz, W., Al-Musharaf, S., & Aldhwayan, M. (2025) · Topics in Clinical Nutrition · doi:10.1097/tin.0000000000000401
Tolbert, L., Borden, S., Leskowitz, J., Ramakrishnan, R., Reid, T. J., Krikhely, A., Bessler, M., & Körner, J. (2026) · Obesity Surgery · doi:10.1007/s11695-025-08473-5
Mechanisms of postoperative anorexia in surgical patients: a narrative review
Sun, Y., Li, Z., Cai, Y., Cen, Y., Li, Y., & Li, C. (2026) · Frontiers in Neuroscience · doi:10.3389/fnins.2026.1710656
Herlinger, K., Long, Y. Y., Nestor, L. J., Pannekoek, J. N., Lababidi, M. A., Ertl, N., Vanelli, F., Alabdulkader, S., Chhibbar, P., Guerrero, E., et al. (2026) · medRxiv · doi:10.64898/2026.03.13.26348339
Self-citationHerlinger, K., Ling, Y. Y., Nestor, L. J., Pannekoek, J. N., Lababidi, M. A., Ertl, N., Vanelli, F., Alabdulkader, S., Chhibbar, P., Guerrero, E., et al. (2026) · Frontiers in Psychiatry · doi:10.3389/fpsyt.2026.1830228
Self-citationTauber, M., Diene, G., Poitou, C., Höybye, C., Gevers, E. F., Goldstone, A. P., Haqq, A. M., Cho, Y. H., Shoemaker, A. H., Forster, J. L., et al. (2026) · Orphanet Journal of Rare Diseases · doi:10.1186/s13023-026-04601-1
Self-citationAnsari, W. E., El-Ansari, K., & Hany, M. (2026) · Current Obesity Reports · doi:10.1007/s13679-026-00768-7
Muehling, C. A., Schmidt, R., Schreglmann, B., Mansfeld, T., Sander, J., Seyfried, F., Kaiser, S., Stroh, C., Dietrich, A., & Hilbert, A. (2026) · Appetite · doi:10.1016/j.appet.2026.108821
Metadata
- Authors
- Goldstone, A. P., Miras, A. D., Scholtz, S., Jackson, S., Neff, K. J., Pénicaud, L., Geoghegan, J., Chhina, N., Durighel, G., Bell, J. D., Meillon, S., & le Roux, C. W.
- Affiliations
- Centre National de la Recherche Scientifique (FR)
- University College Dublin (IE)
- Corresponding author
- Goldstone, Anthony P.
- ORCID
- Venue
- The Journal of Clinical Endocrinology & Metabolism
- Publisher
- The Endocrine Society
- Published
- 2016-02
- Volume
- 101
- Issue
- 2
- Pages
- 599-609
- ISSN
- 0021-972X (ISSN-L)
- 1945-7197
- PMC
- PMC4880130
- OpenAlex
- W2177986650
- Cited by
- 121
- References
- 46
- Citations by year
- 2026: 8 · 2025: 6 · 2024: 6 · 2023: 12 · 2022: 12 · 2021: 16 · 2020: 14 · 2019: 8 · 2018: 18 · 2017: 12 · 2016: 8
- FWCI
- 13.10
- Type
- journal article
- Language
- en
- Open access
- hybrid
- doi.org
- Licence
- cc-by
- Locations
- The Journal of Clinical Endocrinology & Metabolism (publishedVersion, cc-by)
- PubMed Central (publishedVersion, cc-by)
- PubMed (publishedVersion)
- WestminsterResearch (University of Westminster) (acceptedVersion)
- WestminsterResearch (University of Westminster) (acceptedVersion, cc-by)
- HAL (submittedVersion)
- Spiral (Imperial College London) (submittedVersion, cc-by)
- Funders
- Wellcome Trust (087745/Z/08/Z)
- Imperial College Healthcare Charity
- National Institute for Health and Care Research
- Imperial College London
- Imperial College Healthcare NHS Trust
- Science Foundation Ireland (12/YI/B2480)
- Medical Research Council
- NIHR Imperial Biomedical Research Centre
- Topics
- Health Sciences › Medicine › Surgery › Bariatric Surgery and Outcomes
- Life Sciences › Neuroscience › Endocrine and Autonomic Systems › Regulation of Appetite and Obesity
- Health Sciences › Medicine › Pharmacology (medical) › Pharmacology and Obesity Treatment
- Keywords
- Roux-en-Y gastric bypass, bariatric surgery, food reward, octreotide, somatostatin analogues, peptide YY, glucagon-like peptide-1, FGF19, brain reward system, gastric banding
- MeSH terms
- Adult, Appetite, Cacao, Double-Blind Method, Female, Food, Gastrointestinal Hormones, Humans, Magnetic Resonance Imaging, Male, Middle Aged, Obesity, Oxygen, Photic Stimulation, Reward, Satiation, Octreotide, Gastric Bypass, Cross-Over Studies
About these checks
Registry, retraction, Cites and statistics results are computed, not judged, with one exception: a printed reference that no index lists is read once by a model before it counts as a citation error. Claims are extracted by a model and kept only when their quote appears verbatim in the text; each cited source is then checked, with a model’s help, for whether it says what the claim relies on. Those verdicts can be wrong — read the claim’s quote and the cited source before relying on one.
Statistics and arithmetic are recomputed, not judged.
Confidence bands are shown only for fields calibrated on our annotated test set. None is calibrated yet, so no band is shown.
What counts as a claim ›How we measure confidence ›How we check this ›
Are you an author, or do you see a problem with this page? Request a review
