

The DOI matches its Crossref record; 5 of the 5 references it cites were found in a registry or an index.
Racial and Ethnic Disparities in Multiple Sclerosis Prevalence
Open accessAbstract
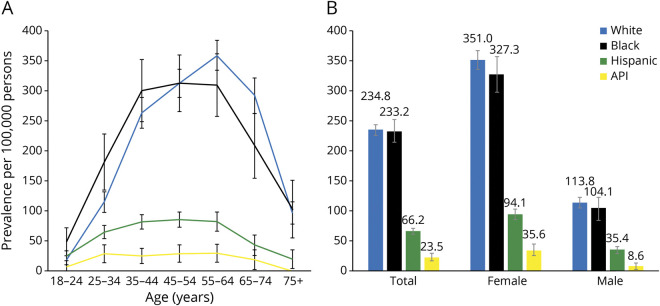
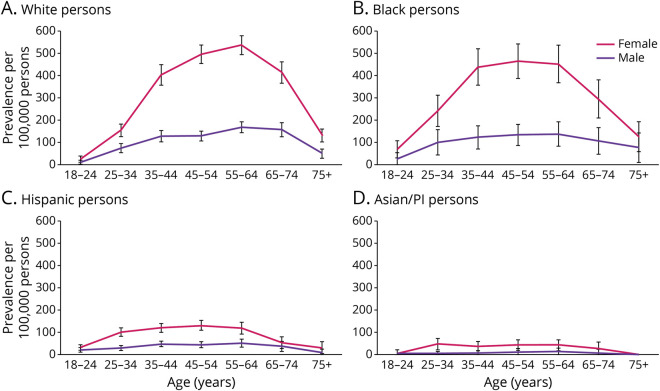
BACKGROUND AND OBJECTIVES: The goal of this work was to determine whether the prevalence of multiple sclerosis (MS) varies by race and ethnicity. METHODS: code for MS between January 1, 2008 and December 31, 2010 were reviewed. MS prevalence and 95% CIs stratified by age, sex, and race and ethnicity among 2010 members were estimated with binomial regression. Age- and sex-standardized prevalence was estimated according to the 2010 US Census population. RESULTS: We identified 3,863 patients with MS. The average age of patients with prevalent MS was 51.7 years (SD 13.1 years), and 76.8% were women. The female preponderance was more pronounced among Black (81.2%) and Asian (83.6%) than White (76.3%) or Hispanic (74.5%) individuals with MS. Age- and sex-standardized MS prevalence per 100,000 was similarly high among Black (225.8, 95% CI 207.1-244.5) and White (237.7, 95% CI 228.2-247.2) and significantly lower among Hispanic (69.9, 95% CI 64.4-75.5) and Asian (22.6, 95% CI 17.1-28.1) persons. MS prevalence was highest between the ages of 35 and 64 years and declined after 65 years of age across all racial and ethnic groups. Among adults 18 to 24 years of age, the crude MS prevalence was low but was highest among Black and Hispanic young adults, lower in White people, and lowest in Asian/Pacific Islander individuals (48.5, 25.0, 18.0, and 7.1 per 100,000, respectively). DISCUSSION: MS prevalence varies by race and ethnicity, being similarly high in White and Black and significantly lower in Hispanic and Asian persons in Southern California. Taken together with previous studies, these findings indicate that the burden of MS in the US Black community has long been underrecognized. More studies are needed to determine whether MS is an emerging disease among US Hispanic adults and whether MS susceptibility and prevalence vary among Hispanic or Asian individuals from different cultures or ancestral backgrounds.
Overview
The claims and statistics of this paper haven’t been checked yet.
Run the check — free, no account needed. It reads the open-access text and checks the sources it cites.
Integrity signals
Registry
Cites
Statistics
Figures
Verification
Claims the paper makes
The claims and statistics of this paper haven’t been checked yet.
Run the check — free, no account needed. It reads the open-access text and checks the sources it cites.
Claims other papers make about this one
Each is checked against this paper’s own text: does it say what the citing paper says it does?
The check wasn’t confident either way, so it gives no verdict — never disputed.
In the citing paper
“Moreover, CADASIL in Asian patients often lacks classic radiologic phenotype, such as anterior temporal pole involvement, and may present later in life with confluent WMHs and cognitive impairment, increasing the risk of misdiagnosis.16-18”
From Multiple Sclerosis Misdiagnosis in Cerebral Autosomal Dominant Arteriopathy With Subcortical Infarcts and Leukoencephalopathy (2026) · cites this paper as [18]
Experimental — accuracy not yet measured
Self-check
Percentages, sums and reported differences re-computed from the paper’s own numbers.
The self-check needs the paper’s full text.
Citations
Cites
Diagnosis of multiple sclerosis: 2017 revisions of the McDonald criteria
Thompson, A. J., Banwell, B. L., Barkhof, F., Carroll, W. M., Coetzee, T., Comi, G., Correale, J., Fazekas, F., Filippi, M., Freedman, M. S., et al. (2018) · The Lancet Neurology · doi:10.1016/s1474-4422(17)30470-2 · Cited by 8,167
Wallin, M. T., Culpepper, W. J., Nichols, E., Bhutta, Z. A., Gebrehiwot, T. T., Hay, S. I., Khalil, I. A., Krohn, K. J., Liang, X., Naghavi, M., et al. (2019) · The Lancet Neurology · doi:10.1016/s1474-4422(18)30443-5 · Cited by 1,134
Elliott, M. N., Morrison, P. A., Fremont, A., McCaffrey, D. F., Pantoja, P., & Lurie, N. (2009) · Health Services and Outcomes Research Methodology · doi:10.1007/s10742-009-0047-1 · Cited by 224
Incidence of multiple sclerosis misdiagnosis in referrals to two academic centers
Kaisey, M., Solomon, A. J., Luu, M., Giesser, B. S., & Sicotte, N. L. (2019) · Multiple Sclerosis and Related Disorders · doi:10.1016/j.msard.2019.01.048 · Cited by 148
Derose, S. F., Contreras, R., Coleman, K. J., Koebnick, C., & Jacobsen, S. J. (2013) · Medical Care Research and Review · doi:10.1177/1077558712466293 · Cited by 102
Research works printed but not linked: 28
- 10.1212/WNL.0b013e3182918cc2 · DOI
- US Census Bureau. The chance that two people chosen at random are of different race or ethnicity groups has increased since 2010. Accessed August 19, 2021. census.gov/library/stories/2021/08/2020-united-states-population-more-racially-ethnically-diverse-than-2010.html
- 10.1159/000342779 · DOI
- 10.1212/01.WNL.0000094316.90240.EB · DOI
- Williamson DM, Henry JP, Schiffer R, Wagner L. Prevalence of multiple sclerosis in 19 Texas counties, 1998-2000. J Environ Health. 2007;69(10):41-45.
- 10.1186/s12883-020-01749-6 · DOI
- 10.1177/1352458519864681 · DOI
- 10.1159/000504050 · DOI
- 10.7812/TPP/12-031 · DOI · Paper page
- US Census Bureau. Census 2000 surname list. US Census Bureau; 2009.
- Breslow NE, Day NE. Statistical Methods in Cancer Research, Volume II: The Design and Analysis of Cohort Studies. IARC Scientific Publications; 1987:1-406.
- 10.1093/brain/aws099 · DOI · Paper page
- 10.1159/000484213 · DOI
- 10.1212/WNL.29.9_Part_1.1228 · DOI
- 10.1177/2055217317715050 · DOI
- 10.1007/s10072-016-2637-3 · DOI
- 10.1159/000484090 · DOI
- 10.1001/jamaneurol.2014.2633 · DOI
- Vespa J, Medina L, Armstrong D. Demographic Turning Points for the United States: Population Projections for 2020 to 2060. In: Current Population Reports. US Census Bureau; 2020:P25-1144. Accessed August 19, 2021. census.gov/content/dam/Census/library/publications/2020/demo/p25-1144.pdf
- 10.1177/1352458516638746 · DOI
- 10.1007/s100720170011 · DOI
- 10.1017/cjn.2015.36 · DOI
- WorldAtlas. Largest ethnic groups in Mexico. 2019. Accessed August 19, 2021. worldatlas.com/articles/largest-ethnic-groups-in-mexico.html.
- US Census Bureau. QuickFacts Puerto Rico. 2019. Accessed August 19, 2021. census.gov/quickfacts/PR.
- Los Angeles Almanac. Asian ethnic origin Los Angeles County: 2010 Census & 2019 Census estimates.Accessed August 19, 2021. laalmanac.com/population/po16.php
- 10.1212/WNL.0000000000007035 · DOI
- 10.1212/WNL.0000000000006583 · DOI
- 10.1001/jamaneurol.2019.2711 · DOI
Cited by
Sorted by citations
Mendis, D. D., Vallamchetla, S. K., Marin Collazo, I. V., Sandhu, S. J. S., & Meschia, J. F. (2026) · Neurology Genetics · doi:10.1212/nxg.0000000000200430
Metadata
- Authors
- Langer-Gould, A. M., Gonzales, E. G., Smith, J. B., Li, B. H., & Nelson, L. M.
- Affiliations
- Los Angeles Medical Center (US)
- Venue
- Neurology
- Published
- 2022-05-03
- Volume
- 98
- Issue
- 18
- Pages
- e1818-e1827
- ISSN
- 0028-3878 (ISSN-L)
- 1526-632X
- PMC
- PMC9109151
- OpenAlex
- W4225006257
- Cited by
- 123
- References
- 5
- Citations by year
- 2026: 17 · 2025: 28 · 2024: 33 · 2023: 38 · 2022: 7
- FWCI
- 17.95
- Type
- journal article
- Language
- en
- Open access
- hybrid
- doi.org
- Licence
- cc-by-nc-nd
- Locations
- Neurology (publishedVersion, cc-by-nc-nd)
- PubMed Central (publishedVersion, cc-by-nc-nd)
- PubMed (publishedVersion)
- Topics
- Health Sciences › Medicine › Clinical Neurology › Multiple Sclerosis Research Studies
- Health Sciences › Medicine › Oncology › Polyomavirus and related diseases
- Social Sciences › Health › Health disparities and outcomes
- Keywords
- multiple sclerosis, racial and ethnic disparities, disease prevalence, African Americans, Hispanic Americans, Asian Americans, sex differences, age differences, young adults, Southern California
- MeSH terms
- Adult, Ethnicity, Female, Humans, Male, Middle Aged, Multiple Sclerosis, Retrospective Studies, Prevalence, Racial Groups, Young Adult
About these checks
Registry, retraction, Cites and statistics results are computed, not judged, with one exception: a printed reference that no index lists is read once by a model before it counts as a citation error. Claims are extracted by a model and kept only when their quote appears verbatim in the text; each cited source is then checked, with a model’s help, for whether it says what the claim relies on. Those verdicts can be wrong — read the claim’s quote and the cited source before relying on one.
Statistics and arithmetic are recomputed, not judged.
Confidence bands are shown only for fields calibrated on our annotated test set. None is calibrated yet, so no band is shown.
What counts as a claim ›How we measure confidence ›How we check this ›
Are you an author, or do you see a problem with this page? Request a review
