

The DOI matches its Crossref record.
Assessment of cortical and striatal involvement in 523 Huntington disease brains
Abstract
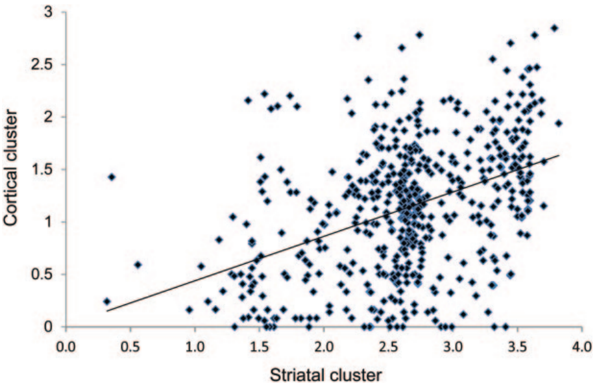
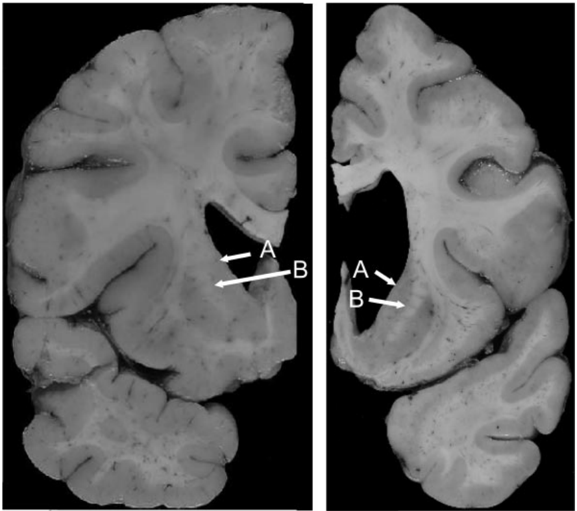
Objective To evaluate the relationship of striatal involvement in Huntington disease (HD) to involvement in other brain regions, CAG repeat size, onset age, and other factors. Methods We examined patterns of neuropathologic involvement in 664 HD brains submitted to the Harvard Brain Tissue Resource Center. Brains with concomitant Alzheimer or Parkinson changes (n = 82), more than 20% missing data (n = 46), incomplete sample submission (n = 12), or CAG repeat less than 36 (n = 1) were excluded, leaving 523 cases. Standardized ratings from 0 (absent) to 4 (severe) of gross and microscopic involvement were performed for 50 regions. Cluster analysis reduced the data to 2 main measures of involvement: striatal and cortical. Results The clusters were correlated with each other (r = 0.42) and with disease duration (striatal: r = 0.35; cortical: r = 0.31). The striatal cluster was correlated with HD repeat size (r = 0.50). The cortical cluster showed a stronger correlation with decreased brain weight (r = -0.52) than the striatal cluster (r = -0.33). The striatal cluster was correlated with younger death age (r = -0.31) and onset age (r = -0.46) while the cortical cluster was not (r = 0.09, r = -0.04, respectively). Conclusions The 2 brain clusters had different relationships to the HD CAG repeat size, onset age, and brain weight, suggesting that neuropathologic involvement does not proceed in a strictly coupled fashion. The pattern and extent of involvement varies substantially from…
Overview
The claims and statistics of this paper haven’t been checked yet.
Run the check — free, no account needed. It reads the open-access text and checks the sources it cites.
Integrity signals
Registry
Cites
Statistics
Figures

Verification
Claims the paper makes
The claims and statistics of this paper haven’t been checked yet.
Run the check — free, no account needed. It reads the open-access text and checks the sources it cites.
Claims other papers make about this one
Each is checked against this paper’s own text: does it say what the citing paper says it does?
In the citing paper
“but experiences less extreme changes than the striatum [28,29]”
From miR-10b-5p expression in Huntington’s disease brain relates to age of onset and the extent of striatal involvement (2015) · cites this paper as [28]
In the citing paper
“To avoid confounding the analysis of these clinical features by the known, strong relationship between HTT CAG repeat size and disease pathology and onset [4,28,31,32], CAG-adjusted residuals were calculated for all continuous clinical traits”
From miR-10b-5p expression in Huntington’s disease brain relates to age of onset and the extent of striatal involvement (2015) · cites this paper as [28]
In the citing paper
“H-V scores are a continuous metric and therefore more amenable to adjustment of covariates such as CAG repeat size in modeling of neuropathological involvement and independently assesses striatal and cortical involvement.”
From miR-10b-5p expression in Huntington’s disease brain relates to age of onset and the extent of striatal involvement (2015) · cites this paper as [28]
Self-check
Percentages, sums and reported differences re-computed from the paper’s own numbers.
The self-check needs the paper’s full text.
Citations
Cites
No references could be resolved yet.
Research works printed but not linked: 20
- 10.1016/0092-8674(93)90585-E · DOI · Paper page
- 10.1073/pnas.0308679101 · DOI · Paper page
- 10.1097/00005072-198511000-00003 · DOI · Paper page
- Kassubek J, Juengling FD, Kioschies T , et al. . Topography of cerebral atrophy in early Huntington's disease: a voxel based morphometric MRI study. J Neurol Neurosurg Psychiatry 2004; 75: 213– 220.
- 10.1093/brain/awn025 · DOI · Paper page
- 10.1136/jnnp.2010.208264 · DOI
- 10.1002/ana.410270217 · DOI
- 10.1212/WNL.43.10.2088 · DOI · Paper page
- 10.1212/WNL.41.7.1117 · DOI
- 10.1097/00005072-198809000-00003 · DOI
- 10.1002/mds.20979 · DOI
- 10.1017/S0033291700016032 · DOI
- 10.1007/BF00230496 · DOI
- 10.1212/WNL.38.3.341 · DOI · Paper page
- 10.1016/j.nbd.2004.07.006 · DOI
- 10.1016/j.brainres.2010.11.020 · DOI
- 10.1093/hmg/ddl013 · DOI · Paper page
- 10.1073/pnas.0606373103 · DOI
- 10.1086/378133 · DOI · Paper page
- 10.1093/brain/awq047 · DOI
Cited by
Sorted by citations
Hoss, A. G., Labadorf, A., Latourelle, J. C., Kartha, V. K., Hadzi, T. C., Gusella, J. F., MacDonald, M. E., Chen, J.-F., Akbarian, S., Weng, Z., et al. (2015) · BMC Medical Genomics · doi:10.1186/s12920-015-0083-3 · Cited by 151
Self-citation
Metadata
- Authors
- Hadzi, T. C., Hendricks, A. E., Latourelle, J. C., Lunetta, K. L., Cupples, L. A., Gillis, T., Mysore, J. S., Gusella, J. F., MacDonald, M. E., Myers, R. H., & Vonsattel, J.-P.
- Affiliations
- From the Department of Neurology (T.C.H., J.C.L., R.H.M.), Boston University School of Medicine, Boston; Department of Biostatistics (A.E.H., K.L.L., L.A.C.), Boston University School of Public Health, Boston, MA; Center for Human Genetic Research (T.G., J.S.M., J.F.G., M.E.M.), Massachusetts General Hospital, Harvard Medical School, Boston; The Taub Institute for Research on Alzheimer's Disease and the Aging Brain (J.-P.V.), The Department of Pathology and Cell Biology, Columbia University Medical...
- Venue
- Neurology
- Published
- 2012-10-16
- Volume
- 79
- Issue
- 16
- Pages
- 1708-1715
- ISSN
- 0028-3878
- 1526-632X
- Cited by
- 46
- References
- 0
- Language
- en
About these checks
Registry, retraction, Cites and statistics results are computed, not judged, with one exception: a printed reference that no index lists is read once by a model before it counts as a citation error. Claims are extracted by a model and kept only when their quote appears verbatim in the text; each cited source is then checked, with a model’s help, for whether it says what the claim relies on. Those verdicts can be wrong — read the claim’s quote and the cited source before relying on one.
Statistics and arithmetic are recomputed, not judged.
Confidence bands are shown only for fields calibrated on our annotated test set. None is calibrated yet, so no band is shown.
What counts as a claim ›How we measure confidence ›How we check this ›
Are you an author, or do you see a problem with this page? Request a review
