

The DOI matches its Crossref record; 2 of the 2 references it cites were found in a registry or an index.
Concealed expansion of immature precursors underpins acute burst of adult HSC activity in foetal liver
Abstract
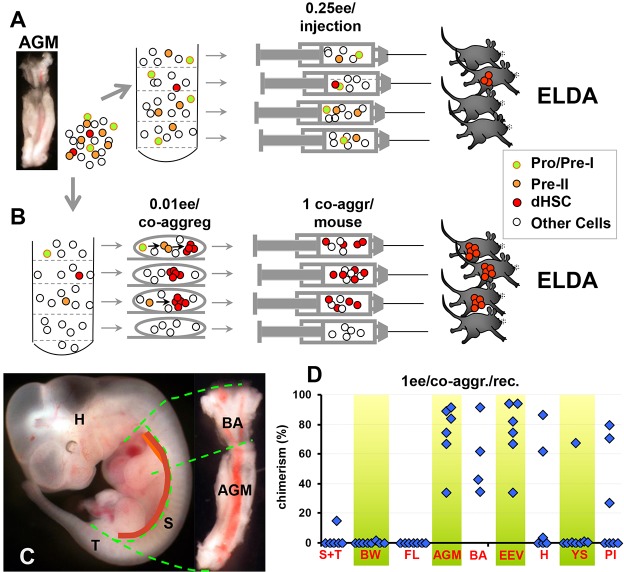
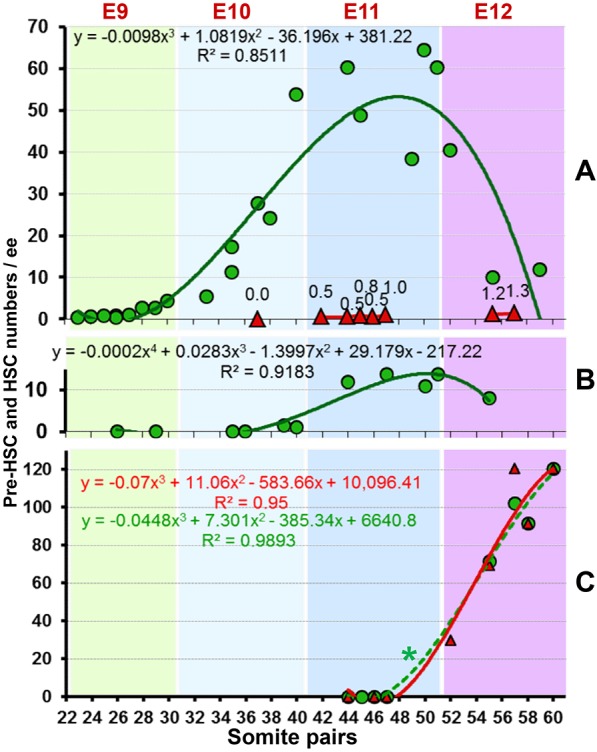
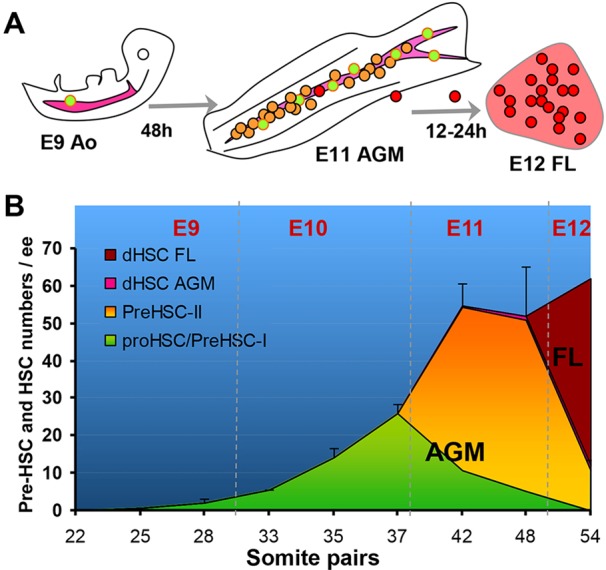
One day prior to mass emergence of haematopoietic stem cells (HSCs) in the foetal liver at E12.5, the embryo contains only a few definitive HSCs. It is thought that the burst of HSC activity in the foetal liver is underpinned by rapid maturation of immature embryonic precursors of definitive HSCs, termed pre-HSCs. However, because pre-HSCs are not detectable by direct transplantations into adult irradiated recipients, the size and growth of this population, which represents the embryonic rudiment of the adult haematopoietic system, remains uncertain. Using a novel quantitative assay, we demonstrate that from E9.5 the pre-HSC pool undergoes dramatic growth in the aorta-gonad-mesonephros region and by E11.5 reaches the size that matches the number of definitive HSCs in the E12.5 foetal liver. Thus, this study provides for the first time a quantitative basis for our understanding of how the large population of definitive HSCs emerges in the foetal liver.
Overview
The claims and statistics of this paper haven’t been checked yet.
Run the check — free, no account needed. It reads the open-access text and checks the sources it cites.
Integrity signals
Registry
Cites
Statistics
Figures
Verification
Claims the paper makes
The claims and statistics of this paper haven’t been checked yet.
Run the check — free, no account needed. It reads the open-access text and checks the sources it cites.
Claims other papers make about this one
Each is checked against this paper’s own text: does it say what the citing paper says it does?
In the citing paper
“HSC arise beginning at embryonic day (E) 9.5 in the mouse embryo13, and colonize the bone marrow around birth.”
From Polylox barcoding reveals haematopoietic stem cell fates realized in vivo (2017) · cites this paper as [13]
Self-check
Percentages, sums and reported differences re-computed from the paper’s own numbers.
The self-check needs the paper’s full text.
Citations
Cites
Wilson, A., Laurenti, E., Oser, G., van der Wath, R. C., Blanco-Bose, W., Jaworski, M., Offner, S., Dunant, C. F., Eshkind, L., Bockamp, E., et al. (2008) · Cell · doi:10.1016/j.cell.2008.10.048 · Cited by 1,908
Of lineage and legacy: the development of mammalian hematopoietic stem cells
Dzierzak, E., & Speck, N. A. (2008) · Nature Immunology · doi:10.1038/ni1560 · Cited by 707
Research works printed but not linked: 39
- Arora, 2014, Effect of developmental stage of HSC and recipient on transplant outcomes, Dev. Cell, 29, 621, 10.1016/j.devcel.2014.04.013 · DOI
- Boisset, 2014, Progressive maturation towards hematopoietic stem cells in the mouse embryo aorta, Blood, 125, 465, 10.1182/blood-2014-07-588954 · DOI
- Chen, 2009, Runx1 is required for the endothelial to haematopoietic cell transition but not thereafter, Nature, 457, 887, 10.1038/nature07619 · DOI
- Ciau-Uitz, 2014, Developmental hematopoiesis: ontogeny, genetic programming and conservation, Exp. Hematol., 42, 669, 10.1016/j.exphem.2014.06.001 · DOI
- Clements, 2013, Signalling pathways that control vertebrate haematopoietic stem cell specification, Nat. Rev. Immunol., 13, 336, 10.1038/nri3443 · DOI
- de Bruijn, 2000, Definitive hematopoietic stem cells first develop within the major arterial regions of the mouse embryo, EMBO J., 19, 2465, 10.1093/emboj/19.11.2465 · DOI
- Dieterlen-Lievre, 1975, On the origin of haemopoietic stem cells in the avian embryo: an experimental approach, J. Embryol. Exp. Morphol., 33, 607
- Ema, 2000, Expansion of hematopoietic stem cells in the developing liver of a mouse embryo, Blood, 95, 2284, 10.1182/blood.V95.7.2284 · DOI
- Galloway, 2003, Ontogeny of hematopoiesis: examining the emergence of hematopoietic cells in the vertebrate embryo, Curr. Top. Dev. Biol., 53, 139, 10.1016/S0070-2153(03)53004-6 · DOI
- Gekas, 2005, The placenta is a niche for hematopoietic stem cells, Dev. Cell, 8, 365, 10.1016/j.devcel.2004.12.016 · DOI · Paper page
- Gordon-Keylock, 2013, Mouse extraembryonic arterial vessels harbor precursors capable of maturing into definitive HSCs, Blood, 122, 2338, 10.1182/blood-2012-12-470971 · DOI
- Hadland, 2015, Endothelium and NOTCH specify and amplify aorta-gonad-mesonephros–derived hematopoietic stem cells, J. Clin. Invest., 125, 2032, 10.1172/JCI80137 · DOI
- Hu, 2009, ELDA: extreme limiting dilution analysis for comparing depleted and enriched populations in stem cell and other assays, J. Immunol. Methods, 347, 70, 10.1016/j.jim.2009.06.008 · DOI
- Ivanovs, 2011, Highly potent human hematopoietic stem cells first emerge in the intraembryonic aorta-gonad-mesonephros region, J. Exp. Med., 208, 2417, 10.1084/jem.20111688 · DOI
- Ivanovs, 2013, Postmenstrual gestational age should be used with care in studies of early human hematopoietic development, Blood, 121, 3051, 10.1182/blood-2013-01-475673 · DOI
- Ivanovs, 2014, Identification of the niche and phenotype of the first human hematopoietic stem cells, Stem Cell Rep., 2, 449, 10.1016/j.stemcr.2014.02.004 · DOI
- Kiel, 2005, SLAM family receptors distinguish hematopoietic stem and progenitor cells and reveal endothelial niches for stem cells, Cell, 121, 1109, 10.1016/j.cell.2005.05.026 · DOI · Paper page
- Kieusseian, 2012, Immature hematopoietic stem cells undergo maturation in the fetal liver, Development, 139, 3521, 10.1242/dev.079210 · DOI
- Kumaravelu, 2002, Quantitative developmental anatomy of definitive haematopoietic stem cells/long-term repopulating units (HSC/RUs): role of the aorta-gonad-mesonephros (AGM) region and the yolk sac in colonisation of the mouse embryonic liver, Development, 129, 4891, 10.1242/dev.129.21.4891 · DOI
- Li, 2012, Mouse embryonic head as a site for hematopoietic stem cell development, Cell Stem Cell, 11, 663, 10.1016/j.stem.2012.07.004 · DOI
- Liakhovitskaia, 2014, Runx1 is required for progression of CD41+ embryonic precursors into HSCs but not prior to this, Development, 141, 3319, 10.1242/dev.110841 · DOI
- Matsuzaki, 2004, Unexpectedly efficient homing capacity of purified murine hematopoietic stem cells, Immunity, 20, 87, 10.1016/S1074-7613(03)00354-6 · DOI
- Medvinsky, 1996, Definitive hematopoiesis is autonomously initiated by the AGM region, Cell, 86, 897, 10.1016/S0092-8674(00)80165-8 · DOI
- Medvinsky, 1993, An early pre-liver intraembryonic source of CFU-S in the developing mouse, Nature, 364, 64, 10.1038/364064a0 · DOI
- Medvinsky, 2011, Embryonic origin of the adult hematopoietic system: advances and questions, Development, 138, 1017, 10.1242/dev.040998 · DOI
- Mikkola, 2005, Placenta as a site for hematopoietic stem cell development, Exp. Hematol., 33, 1048, 10.1016/j.exphem.2005.06.011 · DOI
- Müller, 1994, Development of hematopoietic stem cell activity in the mouse embryo, Immunity, 1, 291, 10.1016/1074-7613(94)90081-7 · DOI
- Ottersbach, 2005, The murine placenta contains hematopoietic stem cells within the vascular labyrinth region, Dev. Cell, 8, 377, 10.1016/j.devcel.2005.02.001 · DOI
- Robin, 2009, Human placenta is a potent hematopoietic niche containing hematopoietic stem and progenitor cells throughout development, Cell Stem Cell, 5, 385, 10.1016/j.stem.2009.08.020 · DOI
- Rybtsov, 2011, Hierarchical organization and early hematopoietic specification of the developing HSC lineage in the AGM region, J. Exp. Med., 208, 1305, 10.1084/jem.20102419 · DOI
- Rybtsov, 2014, Tracing the origin of the HSC hierarchy reveals an SCF-dependent, IL-3-independent CD43(−) embryonic precursor, Stem Cell Rep., 3, 489, 10.1016/j.stemcr.2014.07.009 · DOI
- Sheridan, 2009, A novel method for the generation of reaggregated organotypic cultures that permits juxtaposition of defined cell populations, Genesis, 47, 346, 10.1002/dvg.20505 · DOI
- Sutherland, 1990, Functional characterization of individual human hematopoietic stem cells cultured at limiting dilution on supportive marrow stromal layers, Proc. Natl. Acad. Sci. USA, 87, 3584, 10.1073/pnas.87.9.3584 · DOI
- Szilvassy, 2002, Quantitation of murine and human hematopoietic stem cells by limiting-dilution analysis in competitively repopulated hosts, Methods Mol. Med., 63, 167
- Taoudi, 2005, Progressive divergence of definitive haematopoietic stem cells from the endothelial compartment does not depend on contact with the foetal liver, Development, 132, 4179, 10.1242/dev.01974 · DOI
- Taoudi, 2008, Extensive hematopoietic stem cell generation in the AGM region via maturation of VE-cadherin+CD45+ pre-definitive HSCs, Cell Stem Cell, 3, 99, 10.1016/j.stem.2008.06.004 · DOI
- Taylor, 2010, Hematopoietic stem cell activity in the aorta-gonad-mesonephros region enhances after mid-day 11 of mouse development, Int. J. Dev. Biol., 54, 1055, 10.1387/ijdb.103152et · DOI
- Yoder, 1997, Characterization of definitive lymphohematopoietic stem cells in the day 9 murine yolk sac, Immunity, 7, 335, 10.1016/S1074-7613(00)80355-6 · DOI
- Yokomizo, 2011, Three-dimensional imaging of whole midgestation murine embryos shows an intravascular localization for all hematopoietic clusters, Blood, 117, 6132, 10.1182/blood-2011-02-334037 · DOI
Cited by
Polylox barcoding reveals haematopoietic stem cell fates realized in vivo
Pei, W., Feyerabend, T. B., Rössler, J., Wang, X., Postrach, D., Busch, K., Rode, I., Klapproth, K., Dietlein, N., Quedenau, C., et al. (2017) · Nature · doi:10.1038/nature23653 · Cited by 443
Lifelong haematopoiesis is established by hundreds of precursors throughout mammalian ontogeny
Ganuza, M., Hall, T., Finkelstein, D., Chabot, A., Kang, G., & McKinney-Freeman, S. (2017) · Nature Cell Biology · doi:10.1038/ncb3607 · Cited by 94
Metadata
- Authors
- Rybtsov, S., Ivanovs, A., Zhao, S., & Medvinsky, A.
- Venue
- Development
- Publisher
- The Company of Biologists
- Published
- 2016-04-15
- Volume
- 143
- Issue
- 8
- Pages
- 1284-1289
- ISSN
- 1477-9129
- 0950-1991
- PMC
- PMC4852516
- Cited by
- 136
- References
- 2
- Language
- en
- Funders
- Biotechnology and Biological Sciences Research Council
- Leukaemia and Lymphoma Research
- Medical Research Council
- Wellcome Trust
About these checks
Registry, retraction, Cites and statistics results are computed, not judged, with one exception: a printed reference that no index lists is read once by a model before it counts as a citation error. Claims are extracted by a model and kept only when their quote appears verbatim in the text; each cited source is then checked, with a model’s help, for whether it says what the claim relies on. Those verdicts can be wrong — read the claim’s quote and the cited source before relying on one.
Statistics and arithmetic are recomputed, not judged.
Confidence bands are shown only for fields calibrated on our annotated test set. None is calibrated yet, so no band is shown.
What counts as a claim ›How we measure confidence ›How we check this ›
Are you an author, or do you see a problem with this page? Request a review
