

The DOI matches its Crossref record; 48 of the 48 references it cites were found in a registry or an index.
Art2 mediates selective endocytosis of methionine transporters during adaptation to sphingolipid depletion
Open accessPublished version of a preprint
Abstract
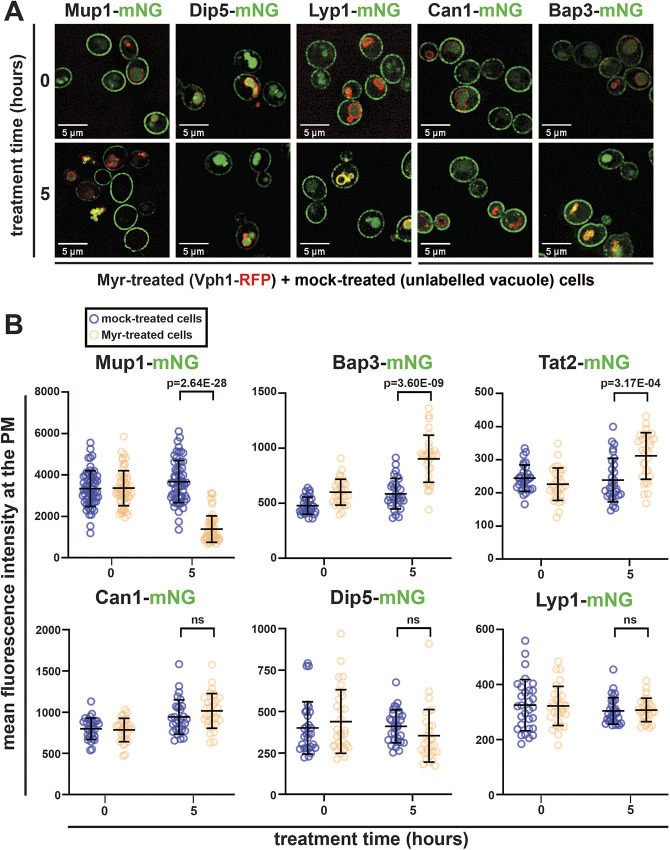
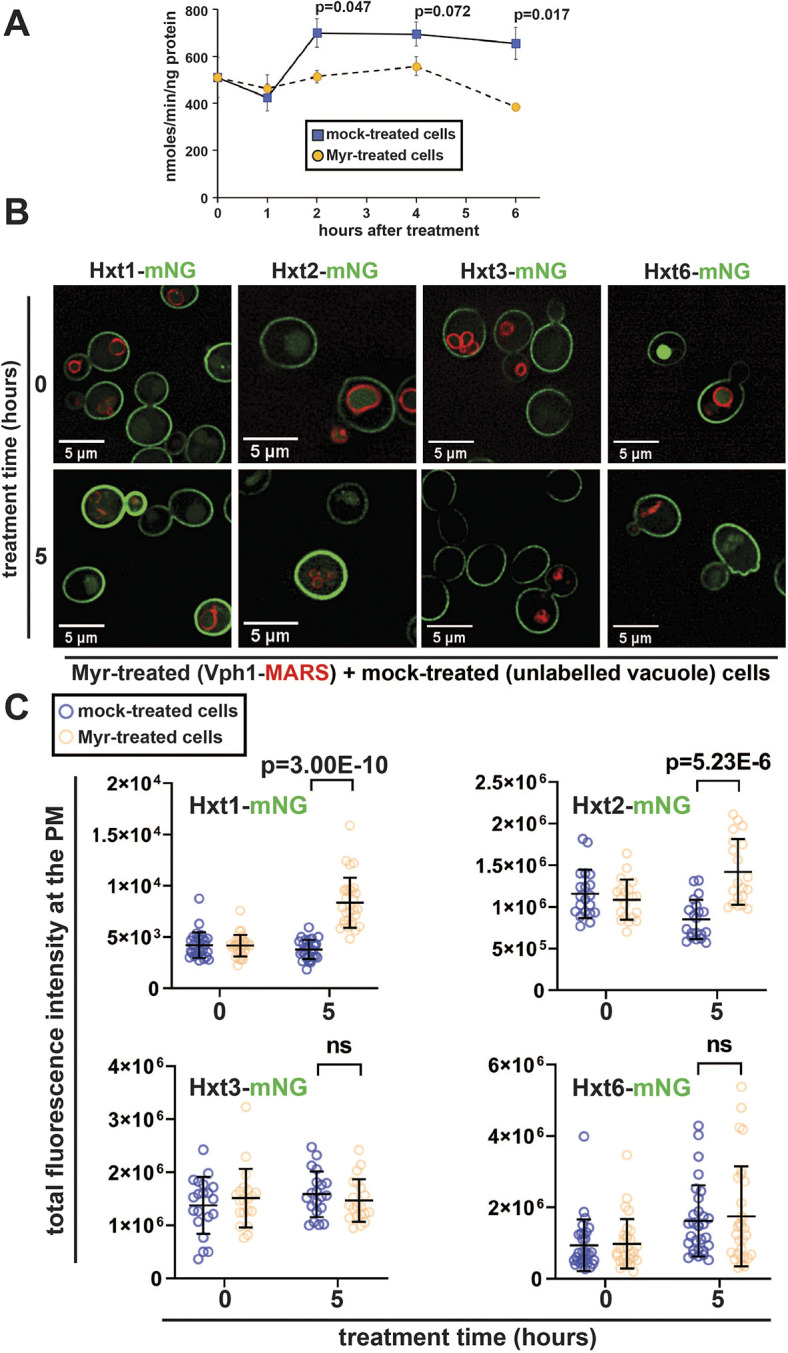
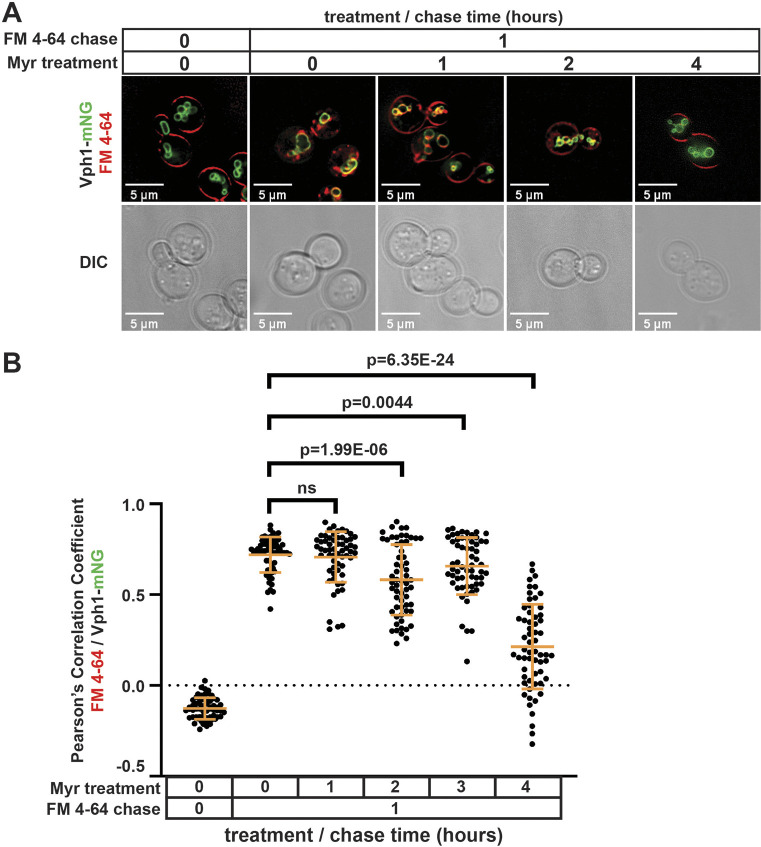
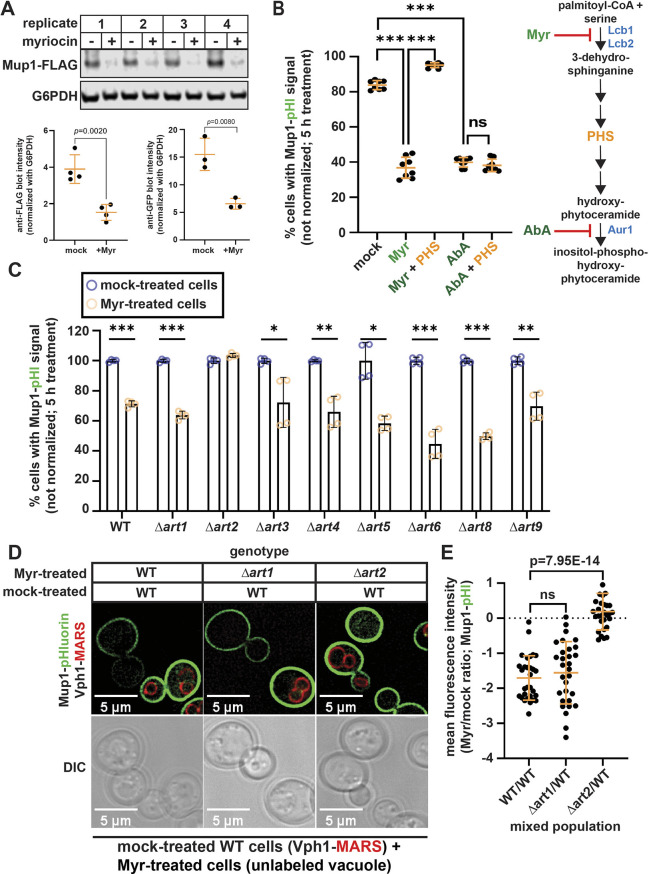
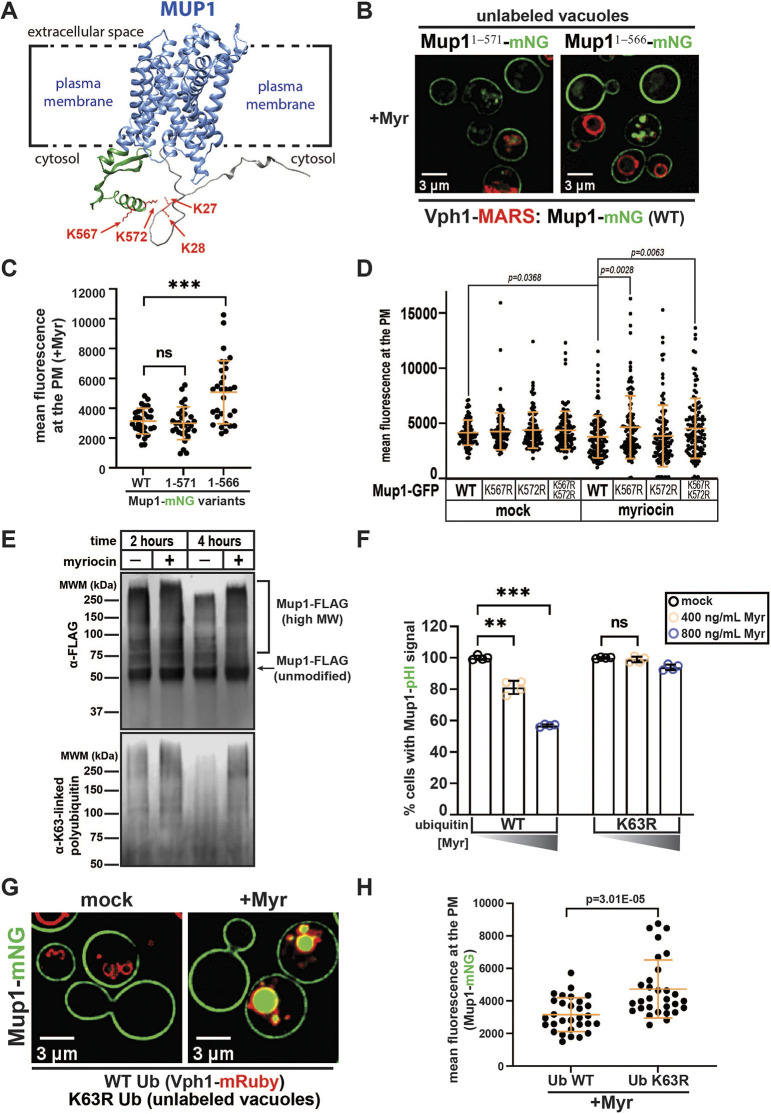
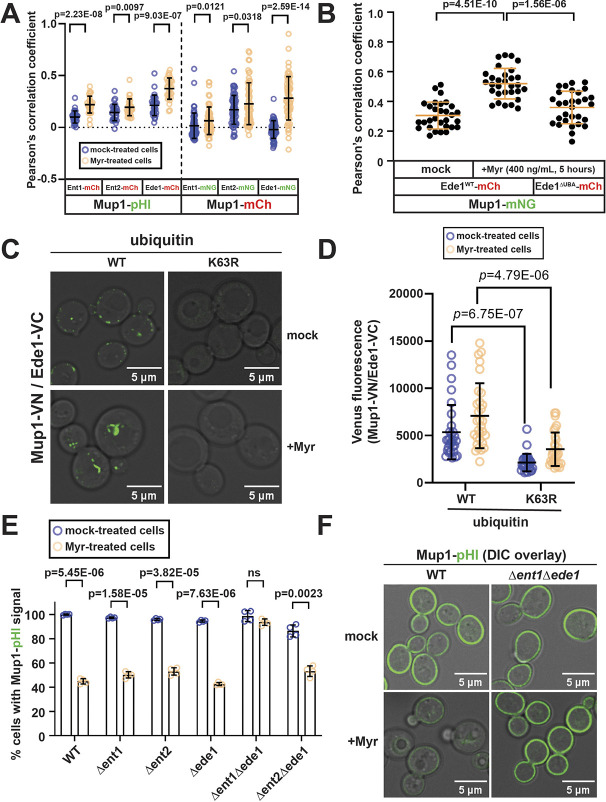
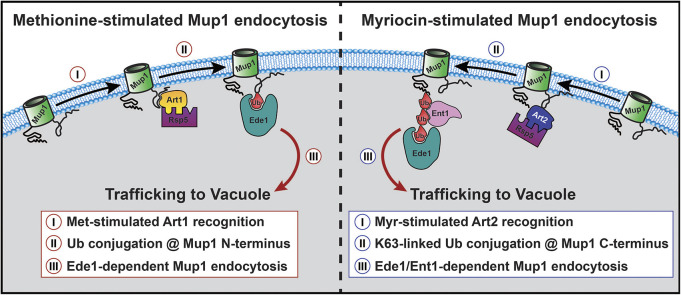
ABSTRACT2: Accumulating evidence in several model organisms indicates that reduced sphingolipid biosynthesis promotes longevity, although underlying mechanisms remain unclear. In yeast, sphingolipid depletion induces a state resembling amino acid restriction, which we hypothesized might be due to altered stability of amino acid transporters at the plasma membrane. To test this, we measured surface abundance for a diverse panel of membrane proteins in the presence of myriocin, a sphingolipid biosynthesis inhibitor, in Saccharomyces cerevisiae. Unexpectedly, we found that surface levels of most proteins examined were either unaffected or increased during myriocin treatment, consistent with an observed decrease in bulk endocytosis. In contrast, sphingolipid depletion triggered selective endocytosis of the methionine transporter Mup1. Unlike methionine-induced Mup1 endocytosis, myriocin triggered Mup1 endocytosis that required the Rsp5 adaptor Art2, C-terminal lysine residues of Mup1 and the formation of K63-linked ubiquitin polymers. These findings reveal cellular adaptation to sphingolipid depletion by ubiquitin-mediated remodeling of nutrient transporter composition at the cell surface.
Overview
The claims and statistics of this paper haven’t been checked yet.
Run the check — free, no account needed. It reads the open-access text and checks the sources it cites.
Integrity signals
Registry
Cites
Statistics
Figures
Verification
Claims the paper makes
The claims and statistics of this paper haven’t been checked yet.
Run the check — free, no account needed. It reads the open-access text and checks the sources it cites.
Self-check
Percentages, sums and reported differences re-computed from the paper’s own numbers.
The self-check needs the paper’s full text.
Citations
Cites
Fiji: an open-source platform for biological-image analysis
Schindelin, J., Arganda-Carreras, I., Frise, E., Kaynig, V., Longair, M., Pietzsch, T., Preibisch, S., Rueden, C., Saalfeld, S., Schmid, B., et al. (2012) · Nature Methods · doi:10.1038/nmeth.2019 · Cited by 66,890
Highly accurate protein structure prediction with AlphaFold
Jumper, J., Evans, R., Pritzel, A., Green, T., Figurnov, M., Ronneberger, O., Tunyasuvunakool, K., Bates, R., Žídek, A., Potapenko, A., et al. (2021) · Nature · doi:10.1038/s41586-021-03819-2 · Cited by 43,764
Sphingosine 1-phosphate: Lipid signaling in pathology and therapy
Cartier, A., & Hla, T. (2019) · Science · doi:10.1126/science.aar5551 · Cited by 613
Lin, C. H., MacGurn, J. A., Chu, T., Stefan, C. J., & Emr, S. D. (2008) · Cell · doi:10.1016/j.cell.2008.09.025 · Cited by 466
Self-citationMolecular recognition of a single sphingolipid species by a protein’s transmembrane domain
Contreras, F. ‐., Ernst, A. M., Haberkant, P., Björkholm, P., Lindahl, E. R., Gonen, B., Tischer, C., Elofsson, A., von HEIJNE, G., Thiele, C., et al. (2012) · Nature · doi:10.1038/nature10742 · Cited by 373
Berchtold, D., Piccolis, M., Chiaruttini, N., Riezman, I., Riezman, H., Roux, A., Walther, T. C., & Loewith, R. (2012) · Nature Cell Biology · doi:10.1038/ncb2480 · Cited by 331
Metabolic Messengers: ceramides
Summers, S. A., Chaurasia, B., & Holland, W. L. (2019) · Nature Metabolism · doi:10.1038/s42255-019-0134-8 · Cited by 299
The ubiquitin code of yeast permease trafficking
Lauwers, E., Erpapazoglou, Z., Haguenauer‐Tsapis, R., & André, B. (2010) · Trends in Cell Biology · doi:10.1016/j.tcb.2010.01.004 · Cited by 245
The Chronological Life Span of Saccharomyces cerevisiae
Fabrizio, P., & Longo, V. D. (2007) · Methods in molecular biology · doi:10.1007/978-1-59745-361-5_8 · Cited by 240
TORC1 Regulates Endocytosis via Npr1-Mediated Phosphoinhibition of a Ubiquitin Ligase Adaptor
MacGurn, J. A., Hsu, P.-C., Smolka, M. B., & Emr, S. D. (2011) · Cell · doi:10.1016/j.cell.2011.09.054 · Cited by 210
Self-citationMerhi, A., & André, B. (2012) · Molecular and Cellular Biology · doi:10.1128/mcb.00463-12 · Cited by 146
Stringer, D. K., & Piper, R. C. (2011) · The Journal of Cell Biology · doi:10.1083/jcb.201008121 · Cited by 137
Sphingolipids in the Pathogenesis of Parkinson’s Disease and Parkinsonism
Lin, G., Wang, L., Marcogliese, P. C., & Bellen, H. J. (2018) · Trends in Endocrinology and Metabolism · doi:10.1016/j.tem.2018.11.003 · Cited by 132
Down-Regulating Sphingolipid Synthesis Increases Yeast Lifespan
Huang, X., Liu, J., & Dickson, R. C. (2012) · PLoS Genetics · doi:10.1371/journal.pgen.1002493 · Cited by 128
Self-citationSubstrate-Induced Ubiquitylation and Endocytosis of Yeast Amino Acid Permeases
Ghaddar, K., Merhi, A., Saliba, E., et al. (2014) · Molecular and Cellular Biology · doi:10.1128/mcb.00699-14 · Cited by 103
Targeting ceramide metabolism in obesity
Aburasayn, H., Batran, R. A., & Ussher, J. R. (2016) · American Journal of Physiology-Endocrinology and Metabolism · doi:10.1152/ajpendo.00133.2016 · Cited by 99
Sphingolipids and lifespan regulation
Huang, X., Withers, B. R., & Dickson, R. C. (2013) · Biochimica et Biophysica Acta (BBA) - Molecular and Cell Biology of Lipids · doi:10.1016/j.bbalip.2013.08.006 · Cited by 93
Self-citationDeng, Y., Pakdel, M., Blank, B., Sundberg, E. L., Burd, C. G., & von Blume, J. (2018) · Developmental Cell · doi:10.1016/j.devcel.2018.10.012 · Cited by 85
Sims, J. J., Haririnia, A., Dickinson, B. C., Fushman, D., & Cohen, R. E. (2009) · Nature Structural & Molecular Biology · doi:10.1038/nsmb.1637 · Cited by 84
A Family of Tetraspans Organizes Cargo for Sorting into Multivesicular Bodies
MacDonald, C., Payne, J. A., Aboian, M., Smith, W., Katzmann, D. J., & Piper, R. C. (2015) · Developmental Cell · doi:10.1016/j.devcel.2015.03.007 · Cited by 80
Jiang, X., Goldberg, I. J., & Park, T. (2011) · Advances in experimental medicine and biology · doi:10.1007/978-1-4614-0650-1_2 · Cited by 75
Attacking the supply wagons to starve cancer cells to death
Selwan, E. M., Finicle, B. T., Kim, S. M., & Edinger, A. L. (2016) · FEBS Letters · doi:10.1002/1873-3468.12121 · Cited by 74
Targeting Sphingolipid Metabolism as a Therapeutic Strategy in Cancer Treatment
Janneh, A. H., & Öğretmen, B. (2022) · Cancers · doi:10.3390/cancers14092183 · Cited by 69
Zou, K., Rouskin, S., Dervishi, K., McCormick, M. A., Sasikumar, A. N., Deng, C., Chen, Z., Kaeberlein, M. R., Brem, R. B., Polymenis, M., et al. (2020) · Science Advances · doi:10.1126/sciadv.aba1306 · Cited by 68
Identification of the endocytic sorting signal recognized by the Art1-Rsp5 ubiquitin ligase complex
Guiney, E. L., Klecker, T., & Emr, S. D. (2016) · Molecular Biology of the Cell · doi:10.1091/mbc.e16-08-0570 · Cited by 67
Sphingolipid control of cognitive functions in health and disease
Kalinichenko, L. S., Gulbins, E., Kornhuber, J., & Müller, C. P. (2022) · Progress in Lipid Research · doi:10.1016/j.plipres.2022.101162 · Cited by 66
Inhibition of Ceramide Accumulation in Podocytes by Myriocin Prevents Diabetic Nephropathy
Woo, C.-Y., Baek, J. Y., Kim, A., Hong, C. H., Yoon, J. E., Kim, H. S., Yoo, H. J., Park, T., Kc, R., Lee, K., et al. (2019) · Diabetes & Metabolism Journal · doi:10.4093/dmj.2019.0063 · Cited by 62
Quantitative analysis of endocytosis with cytoplasmic pHluorin chimeras
Prosser, D. C., Whitworth, K., & Wendland, B. (2010) · Traffic : the International Journal of Intracellular Transport · doi:10.1111/j.1600-0854.2010.01088.x · Cited by 59
The Role of Sphingolipids Metabolism in Cancer Drug Resistance
Bataller, M., Sánchez-García, A., Garcia‐Mayea, Y., Mir, C., Rodriguez, I., & LLeonart, M. E. (2021) · Frontiers in Oncology · doi:10.3389/fonc.2021.807636 · Cited by 58
Geekiyanage, H., Upadhye, A., & Chan, C. (2013) · Neurobiology of Aging · doi:10.1016/j.neurobiolaging.2013.02.001 · Cited by 52
Sundberg, E. L., Deng, Y., & Burd, C. G. (2019) · Developmental Cell · doi:10.1016/j.devcel.2019.08.014 · Cited by 49
Lateral plasma membrane compartmentalization links protein function and turnover
Busto, J. V., Elting, A., Haase, D., Spira, F., Kuhlman, J., Schäfer‐Herte, M., & Wedlich‐Söldner, R. (2018) · The EMBO Journal · doi:10.15252/embj.201899473 · Cited by 48
The α‐arrestin family of ubiquitin ligase adaptors links metabolism with selective endocytosis
Kahlhofer, J., Léon, S., Teis, D., & Schmidt, O. (2020) · Biology of the Cell · doi:10.1111/boc.202000137 · Cited by 47
Control of Plasma Membrane Permeability by ABC Transporters
Khakhina, S., Johnson, S. S., Manoharlal, R., Russo, S. B., Blugeon, C., Lemoine, S., Sunshine, A. B., Dunham, M. J., Cowart, L. A., Devaux, F., et al. (2015) · Eukaryotic Cell · doi:10.1128/ec.00021-15 · Cited by 44
Petit, C. S. V., Lee, J. J., Boland, S., Swarup, S., Christiano, R., Lai, Z. W., Mejhert, N., Elliott, S. D., McFall, D. J., Haque, S., et al. (2020) · Proceedings of the National Academy of Sciences · doi:10.1073/pnas.1913956117 · Cited by 39
Ivashov, V. A., Zimmer, J., Schwabl, S., Kahlhofer, J., Weys, S., Gstir, R., Jakschitz, T. A. E., Kremser, L., Bonn, G. K., Lindner, H., et al. (2020) · eLife · doi:10.7554/elife.58246 · Cited by 37
Methionine triggers Ppz-mediated dephosphorylation of Art1 to promote cargo-specific endocytosis
Lee, S., Ho, H.-C., Tumolo, J. M., Hsu, P.-C., & MacGurn, J. A. (2019) · The Journal of Cell Biology · doi:10.1083/jcb.201712144 · Cited by 30
Self-citationMyriocin-mediated up-regulation of hepatocyte apoA-I synthesis is associated with ERK inhibition
Glaros, E. N., Kim, W. S., & Garner, B. (2010) · Clinical Science · doi:10.1042/cs20090452 · Cited by 28
Compartmentation and functions of sphingolipids
Körner, C., & Fröhlich, F. (2022) · Current Opinion in Cell Biology · doi:10.1016/j.ceb.2022.01.006 · Cited by 27
Yu, Z., Peng, Q., Li, S., Hao, H.-J., Deng, J., Meng, L., Shen, Z., Yu, W., Nan, D., Bai, Y., et al. (2020) · Clinical Science · doi:10.1042/cs20191028 · Cited by 26
Barthelemy, C., Barry, A. O., Twyffels, L., & André, B. (2017) · Scientific Reports · doi:10.1038/s41598-017-14124-2 · Cited by 21
Antitumor activity of a novel and orally available inhibitor of serine palmitoyltransferase
Yaguchi, M., Shibata, S., Satomi, Y., Hirayama, M., Adachi, R., Asano, Y., Kojima, T., Hirata, Y., Mizutani, A., Kiba, A., et al. (2017) · Biochemical and Biophysical Research Communications · doi:10.1016/j.bbrc.2017.01.075 · Cited by 18
Enhancing lifespan of budding yeast by pharmacological lowering of amino acid pools
Hepowit, N. L., Macêdo, J. K. A., Young, L. E. A., Liu, K., Sun, R. C., MacGurn, J. A., & Dickson, R. C. (2021) · Aging · doi:10.18632/aging.202849 · Cited by 18
Self-citationSkeletal muscle ceramides do not contribute to physical-inactivity-induced insulin resistance
Appriou, Z., Nay, K., Pierre, N., Saligaut, D., Lefeuvre‐Orfila, L., Martin, B., Cavey, T., Ropert, M., Loréal, O., Rannou‐Bekono, F., et al. (2019) · Applied Physiology, Nutrition, and Metabolism · doi:10.1139/apnm-2018-0850 · Cited by 14
Identification of ubiquitin Ser57 kinases regulating the oxidative stress response in yeast
Hepowit, N. L., Pereira, K. N., Tumolo, J. M., Chazin, W., & MacGurn, J. A. (2020) · eLife · doi:10.7554/elife.58155 · Cited by 14
Self-citationA Snf1-related nutrient-responsive kinase antagonizes endocytosis in yeast
Tumolo, J. M., Hepowit, N. L., Joshi, S., & MacGurn, J. A. (2020) · PLoS Genetics · doi:10.1371/journal.pgen.1008677 · Cited by 12
Self-citationWrasman, K., Alioto, S. L., Zhang, Y., Hoban, K., Khairy, M., Goode, B. L., & Wendland, B. (2018) · G3 Genes Genomes Genetics · doi:10.1534/g3.118.200102 · Cited by 6
Reduced sphingolipid biosynthesis modulates proteostasis networks to enhance longevity
Hepowit, N. L., Blalock, E. M., Lee, S., Bretland, K. M., MacGurn, J. A., & Dickson, R. C. (2023) · Aging · doi:10.18632/aging.204485 · Cited by 4
Self-citation
Cited by
Membrane contact sites regulate vacuolar fission via sphingolipid metabolism
Hanaoka, K., Nishikawa, K., Ikeda, A., Schlarmann, P., Sasaki, S., Fujii, S., Yamashita, S., Nakaji, A., & Funato, K. (2024) · eLife · doi:10.7554/elife.89938 · Cited by 6
Membrane contact sites regulate vacuolar fission via sphingolipid metabolism
Hanaoka, K., Nishikawa, K., Ikeda, A., Schlarmann, P., Yamashita, S., Nakaji, A., Fujii, S., & Funato, K. (2023) · doi:10.1101/2023.06.21.546015
Metadata
- Authors
- Hepowit, N. L., Moon, B., Ebert, A. C., Dickson, R. C., & MacGurn, J. A.
- Affiliations
- Vanderbilt University (US)
- University of Kentucky (US)
- Corresponding author
- Dickson, Robert C.
- MacGurn, Jason A.
- Venue
- Journal of Cell Science
- Publisher
- The Company of Biologists
- Published
- 2023-07-15
- Volume
- 136
- Issue
- 14
- ISSN
- 0021-9533 (ISSN-L)
- 1477-9137
- PMC
- PMC10399987
- OpenAlex
- W4381309905
- Cited by
- 18
- References
- 48
- Citations by year
- 2026: 2 · 2025: 5 · 2024: 8 · 2023: 3
- FWCI
- 2.59
- Type
- journal article
- Language
- en
- Open access
- hybrid
- doi.org
- Licence
- Locations
- Journal of Cell Science (publishedVersion, cc-by)
- bioRxiv (Cold Spring Harbor Laboratory) (acceptedVersion, cc-by-nc)
- PubMed Central (publishedVersion, cc-by)
- PubMed (publishedVersion)
- Funders
- National Institutes of Health (R56 AG024377, R35 GM144112, T32 GM65086)
- Vanderbilt University
- Topics
- Life Sciences › Biochemistry, Genetics and Molecular Biology › Cell Biology › Cellular transport and secretion
- Life Sciences › Biochemistry, Genetics and Molecular Biology › Cell Biology › Autophagy in Disease and Therapy
- Life Sciences › Biochemistry, Genetics and Molecular Biology › Molecular Biology › Ubiquitin and proteasome pathways
- Keywords
- ART2, myriocin, Rsp5 ubiquitin ligase, amino acid transporters, amino acid restriction, longevity, Saccharomyces cerevisiae
- MeSH terms
- Endocytosis, Methionine, Saccharomyces cerevisiae, Sphingolipids, Ubiquitin, Saccharomyces cerevisiae Proteins, Ubiquitination, Endosomal Sorting Complexes Required for Transport
About these checks
Registry, retraction, Cites and statistics results are computed, not judged, with one exception: a printed reference that no index lists is read once by a model before it counts as a citation error. Claims are extracted by a model and kept only when their quote appears verbatim in the text; each cited source is then checked, with a model’s help, for whether it says what the claim relies on. Those verdicts can be wrong — read the claim’s quote and the cited source before relying on one.
Statistics and arithmetic are recomputed, not judged.
Confidence bands are shown only for fields calibrated on our annotated test set. None is calibrated yet, so no band is shown.
What counts as a claim ›How we measure confidence ›How we check this ›
Are you an author, or do you see a problem with this page? Request a review
Data sources
Bibliographic data: Semantic Scholar, OpenAlex, Crossref.
Contains information from the Semantic Scholar Academic Graph Datasets, made available under the ODC Attribution License (ODC-BY 1.0).
Semantic Scholar’s data is described in: Kinney, R., et al. (2023). The Semantic Scholar Open Data Platform. arXiv:2301.10140.
