Cited by 731

The DOI matches its Crossref record; 7 of the 7 references it cites were found in a registry or an index.

Aging Hematopoietic Stem Cells Decline in Function and Exhibit Epigenetic Dysregulation

Chambers, Stuart M, Shaw, Chad A, Gatza, Catherine, Fisk, C. Joseph, Donehower, Lawrence A, Goodell, Margaret A·2007·PLoS Biology

Overview

The claims and statistics of this paper haven’t been checked yet.

Run the check — free, no account needed. It reads the open-access text and checks the sources it cites.

A few free checks a day · papers already verified open instantly · results are public

Integrity signals

Registry

Crossref · 10.1371/journal.pbio.0050201

Cites

7 of 7 references verified0 citation errors · 0 not checkable

Statistics

Figures

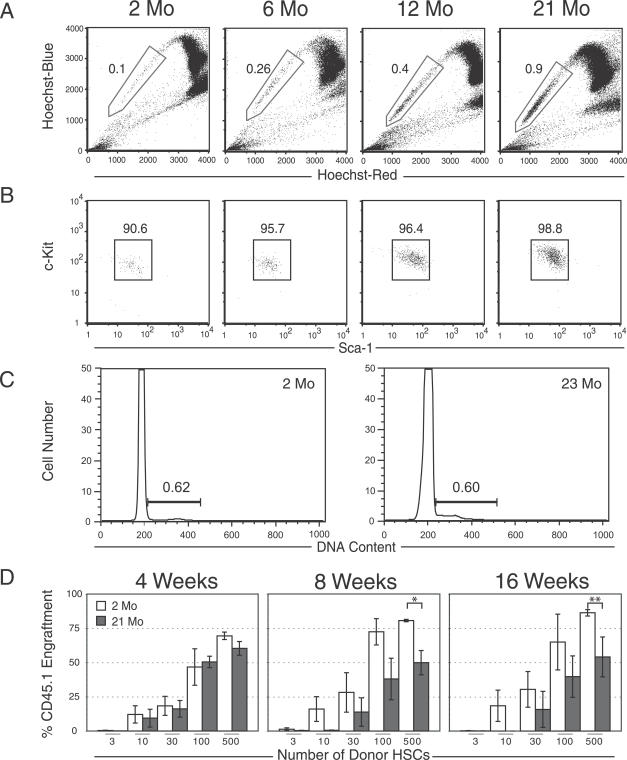
Figure 1 Aging HSC Phenotypes and Functional Alterations (A) Hoechst dye efflux by HSCs results in a SP (boxed) when viewed at two emission wavelengths. Comparison of the proportions of Sca-1–enriched SP cells from C57Bl/6 mice at 2 and 21 mo of age shows an approximate 9-fold increase with age. (B) Expression of the two canonical stem cell markers, c-Kit and Sca-1, does not change significantly between 2 and 21 mo of age within the lineage-negative (Lin−) SP population, indicating the SP cells remain remarkably phenotypically pure and homogeneous. (C) Cell cycle analysis by propidium iodide staining of 2- and 23-mo-old HSCs purified on the basis of SParKLS. (D) Limiting dilution functional assay of HSCs. In competitive repopulation experiments, there was little difference in HSC activity 4 wk after transplantation in young versus old HSCs. However, at 8 and 16 wk post-transplantation, 21-mo-old HSCs showed a reduced contribution compared to 2-mo-old control HSCs, depending on the donor cell dose (a single asterisk [*] indicates p ≤ 0.03; double asterisks [**] indicate p ≤ 0.09). Error bars represent one standard error.
Figure 1 Aging HSC Phenotypes and Functional Alterations (A) Hoechst dye efflux by HSCs results in a SP (boxed) when viewed at two emission wavelengths. Comparison of the proportions of Sca-1–enriched SP cells from C57Bl/6 mice at 2 and 21 mo of age shows an approximate 9-fold increase with age. (B) Expression of the two canonical stem cell markers, c-Kit and Sca-1, does not change significantly between 2 and 21 mo of age within the lineage-negative (Lin−) SP population, indicating the SP cells remain remarkably phenotypically pure and homogeneous. (C) Cell cycle analysis by propidium iodide staining of 2- and 23-mo-old HSCs purified on the basis of SParKLS. (D) Limiting dilution functional assay of HSCs. In competitive repopulation experiments, there was little difference in HSC activity 4 wk after transplantation in young versus old HSCs. However, at 8 and 16 wk post-transplantation, 21-mo-old HSCs showed a reduced contribution compared to 2-mo-old control HSCs, depending on the donor cell dose (a single asterisk [*] indicates p ≤ 0.03; double asterisks [**] indicate p ≤ 0.09). Error bars represent one standard error.CC BY · PubMed Central
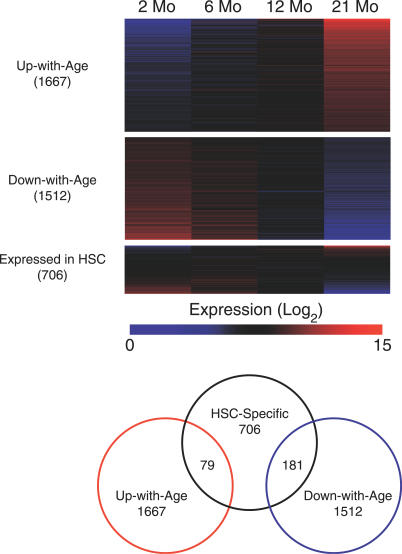
Figure 2 Gene Expression in HSC throughout Aging The heat maps show expression levels for four different gene lists, with the degree of overlap among the lists indicated on the right. Color intensity indicates level of expression, where blue signifies low expression and red signifies high expression. Each column delineates the mean expression at 2, 6, 12, and 21 mo, and each row represents a given gene within each gene list. “Expressed in HSCs” refers to genes derived from a comparison of HSCs versus WBM.
Figure 2 Gene Expression in HSC throughout Aging The heat maps show expression levels for four different gene lists, with the degree of overlap among the lists indicated on the right. Color intensity indicates level of expression, where blue signifies low expression and red signifies high expression. Each column delineates the mean expression at 2, 6, 12, and 21 mo, and each row represents a given gene within each gene list. “Expressed in HSCs” refers to genes derived from a comparison of HSCs versus WBM.CC BY · PubMed Central
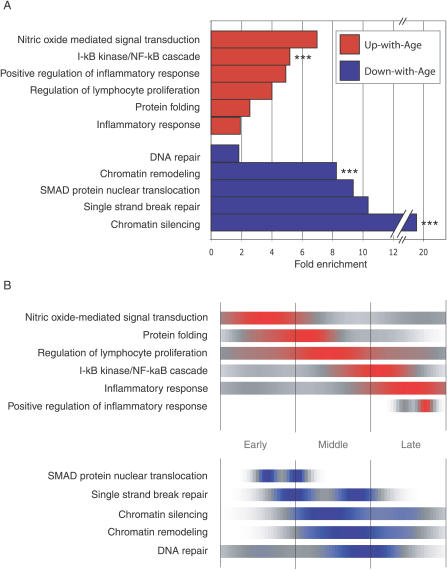
Figure 3 Gene Ontology Analysis (A) Fold enrichment over chance for selected GO categories of the Up-with-Age (red) and Down-with-Age (blue) gene lists. Bars without asterisks, p-value ≤ 0.05. Triple asterisks (***) indicate p ≤ 0.005. The number of genes found within each gene list and found on the entire array are shown for each GO category. (B) GO-timer T 1/2-max for selected GO categories as a function of density over time. Areas of color correspond to the time at which a GO category is undergoing the most rapid up-regulation (red) or down-regulation (blue). It is important to note that after a given GO category T 1/2-max, the expression remains up-regulated (red) or down-regulated (blue).
Figure 3 Gene Ontology Analysis (A) Fold enrichment over chance for selected GO categories of the Up-with-Age (red) and Down-with-Age (blue) gene lists. Bars without asterisks, p-value ≤ 0.05. Triple asterisks (***) indicate p ≤ 0.005. The number of genes found within each gene list and found on the entire array are shown for each GO category. (B) GO-timer T 1/2-max for selected GO categories as a function of density over time. Areas of color correspond to the time at which a GO category is undergoing the most rapid up-regulation (red) or down-regulation (blue). It is important to note that after a given GO category T 1/2-max, the expression remains up-regulated (red) or down-regulated (blue).CC BY · PubMed Central
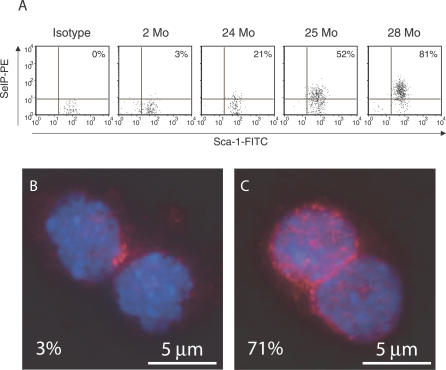
Figure 4 Up-Regulation of P-selectin Cell Surface Expression and NF-κB Localization in Aged HSCs. (A) An increasing percentage of HSCs express P-selectin (SelP) when examined by FACS, ranging from 3% (2-mo-old HSCs) to 81% (28-mo-old HSCs). FITC, fluorescein isothiocyanate; PE, phycoerythrin. (B and C) HSCs stained with anti-p65 NF-kB antibody (red) and DAPI (blue). Two-month-old HSCs contain approximately 3% nuclear-localized p65; however, at 22 mo, approximately 71% show nuclear-localized p65.
Figure 4 Up-Regulation of P-selectin Cell Surface Expression and NF-κB Localization in Aged HSCs. (A) An increasing percentage of HSCs express P-selectin (SelP) when examined by FACS, ranging from 3% (2-mo-old HSCs) to 81% (28-mo-old HSCs). FITC, fluorescein isothiocyanate; PE, phycoerythrin. (B and C) HSCs stained with anti-p65 NF-kB antibody (red) and DAPI (blue). Two-month-old HSCs contain approximately 3% nuclear-localized p65; however, at 22 mo, approximately 71% show nuclear-localized p65.CC BY · PubMed Central
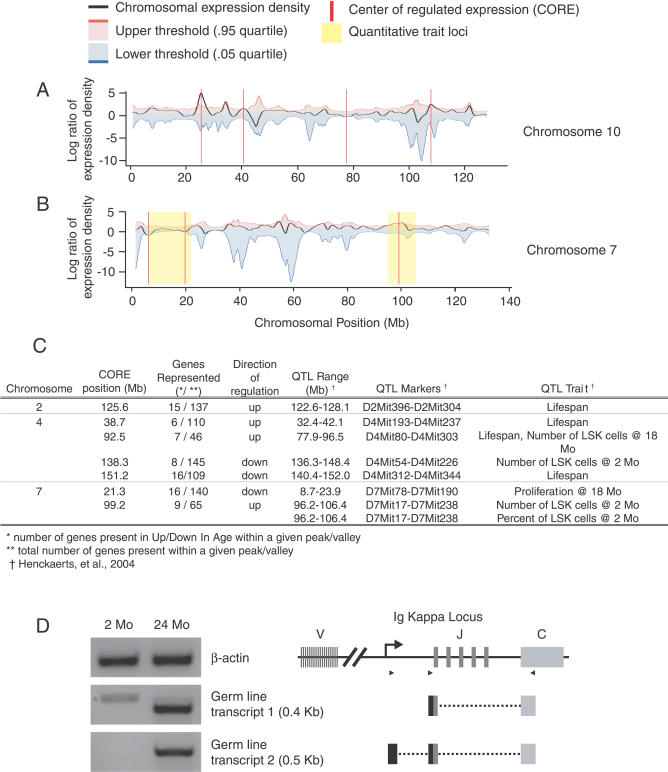
Figure 5 Density Plots of Coordinately Regulated Gene Expression for Chromosomes 4, 7, 10, and 13. (A) The black line represents the local density of coordinate regulation for all unique microarray probes. A positive value (peak) indicates a region where there are a greater number of up-regulated genes, whereas a negative value (valley) corresponds to a region of several down-regulated genes. The red vertical line indicates a CORE that extends beyond the threshold of significance (blue and red lines; p < 0.05) estimated by 1,000 randomized test sets. (B) Alignment of COREs on Chromosome 7 with previously published QTLs that represent chromosomal regions involved in age-related HSC function and organismal lifespan. Only those COREs that localize within established QTLs are shown. (C) Table showing the chromosomal alignment of COREs with known QTLs. QTLs are found on Chromosomes 2, 4, and 7 that contain COREs. (D) RT-PCR for IgK GL transcripts and diagram of transcript alignment with the GL IgK locus. The star (*) in the first lane, for GL transcript1, indicates a cDNA amplicon in young HSC that does not align with the IgK locus.
Figure 5 Density Plots of Coordinately Regulated Gene Expression for Chromosomes 4, 7, 10, and 13. (A) The black line represents the local density of coordinate regulation for all unique microarray probes. A positive value (peak) indicates a region where there are a greater number of up-regulated genes, whereas a negative value (valley) corresponds to a region of several down-regulated genes. The red vertical line indicates a CORE that extends beyond the threshold of significance (blue and red lines; p < 0.05) estimated by 1,000 randomized test sets. (B) Alignment of COREs on Chromosome 7 with previously published QTLs that represent chromosomal regions involved in age-related HSC function and organismal lifespan. Only those COREs that localize within established QTLs are shown. (C) Table showing the chromosomal alignment of COREs with known QTLs. QTLs are found on Chromosomes 2, 4, and 7 that contain COREs. (D) RT-PCR for IgK GL transcripts and diagram of transcript alignment with the GL IgK locus. The star (*) in the first lane, for GL transcript1, indicates a cDNA amplicon in young HSC that does not align with the IgK locus.CC BY · PubMed Central
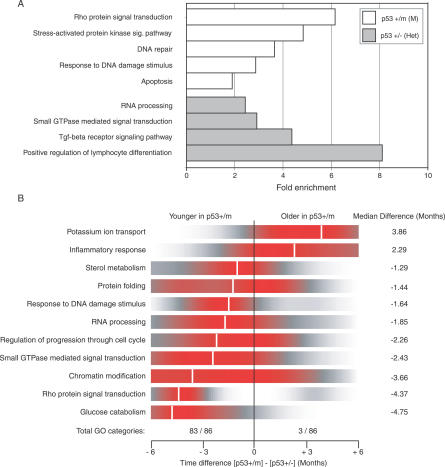
Figure 6 Gene Ontology for Pairwise Comparison and Age Differences between p53+/m and p53+/− HSC (A) A pairwise comparison between the two genotypes reveals differences in p53-regulated pathways, including DNA repair, Response to DNA damage, Apoptosis, and others. The number of genes found within each gene list and on the entire array are shown for each GO category. (B) Using the best-fitting WT HSC aging data (R 2 < 0.50), age was extrapolated on a per-gene basis for both the p53+/m and p53+/− expression data. Genes were clustered by GO categories, and categories with significant age differences between the two p53 mutants were identified (Wilcoxon t-test; p-value < 0.05). Ninety-seven percent (84 of 87) of the GO categories were found to be younger (shifted left) in the p53+/m mice when compared to p53+/− mice. Shown is a density plot of the difference between the two genotypes on a per-gene basis for each GO category, where red indicates the highest density. Median differences in age for each GO category range from 1–5 mo and are demarcated by the white vertical line.
Figure 6 Gene Ontology for Pairwise Comparison and Age Differences between p53+/m and p53+/− HSC (A) A pairwise comparison between the two genotypes reveals differences in p53-regulated pathways, including DNA repair, Response to DNA damage, Apoptosis, and others. The number of genes found within each gene list and on the entire array are shown for each GO category. (B) Using the best-fitting WT HSC aging data (R 2 < 0.50), age was extrapolated on a per-gene basis for both the p53+/m and p53+/− expression data. Genes were clustered by GO categories, and categories with significant age differences between the two p53 mutants were identified (Wilcoxon t-test; p-value < 0.05). Ninety-seven percent (84 of 87) of the GO categories were found to be younger (shifted left) in the p53+/m mice when compared to p53+/− mice. Shown is a density plot of the difference between the two genotypes on a per-gene basis for each GO category, where red indicates the highest density. Median differences in age for each GO category range from 1–5 mo and are demarcated by the white vertical line.CC BY · PubMed Central

Verification

Claims the paper makes

The claims and statistics of this paper haven’t been checked yet.

Run the check — free, no account needed. It reads the open-access text and checks the sources it cites.

A few free checks a day · papers already verified open instantly · results are public

Claims other papers make about this one

Each is checked against this paper’s own text: does it say what the citing paper says it does?

Self-check

Percentages, sums and reported differences re-computed from the paper’s own numbers.

The self-check needs the paper’s full text.

Citations

Cites

Research works printed but not linked: 54

  1. Van Zant, 2003, Exp Hematol, 31, 659
  2. Morrison, 1996, Nat Med, 2, 1011
  3. Sudo, 2000, J Exp Med, 192, 1273
  4. Rossi, 2005, Proc Natl Acad Sci U S A, 102, 9194
  5. de Haan, 1999, Blood, 93, 3294
  6. Goodell, 1996, J Exp Med, 183, 1797
  7. Goodell, 1997, Nat Med, 3, 1337
  8. Kiel, 2005, Cell, 121, 1109
  9. Yilmaz, 2006, Blood, 107, 924
  10. Zhong, 1996, J Immunol, 157, 138
  11. Camargo, 2006, Blood, 107, 501
  12. de Haan, 2000, Blood, 96, 1374
  13. Ashburner, 2000, Nat Genet, 25, 25
  14. Venezia, 2004, PLoS Biol, 2
  15. Krabbe, 2004, Exp Gerontol, 39, 687
  16. Tedder, 1995, FASEB J, 9, 866
  17. Zou, 2004, FASEB J, 18, 320
  18. Geng, 2004, Curr Med Chem, 11, 2153
  19. Pan, 1998, J Biol Chem, 273, 10068
  20. Guarente, 2005, Cell, 120, 473
  21. Henckaerts, 2002, Blood, 99, 3947
  22. Henckaerts, 2004, Blood, 104, 374
  23. Wang, 2003, Neuroinformatics, 1, 299
  24. Igarashi, 2002, Immunity, 17, 117
  25. Martin, 1990, Mol Cell Biol, 10, 1950
  26. Schlissel, 2004, Immunol Rev, 200, 215
  27. Donehower, 2005, Exp Gerontol, 40, 7
  28. Tyner, 2002, Nature, 415, 45
  29. Dumble, 2004, Ann N Y Acad Sci, 1019, 171
  30. Dumble, 2006, Blood, 109, 1736
  31. Lee, 2002, Proc Natl Acad Sci U S A, 99, 14988
  32. Lee, 1999, Science, 285, 1390
  33. Lee, 2000, Nat Genet, 25, 294
  34. Rodwell, 2004, PLoS Biol, 2
  35. Csiszar, 2003, FASEB J, 17, 1183
  36. Karin, 2000, Annu Rev Immunol, 18, 621
  37. Franceschi, 2000, Ann N Y Acad Sci, 908, 244
  38. Sitnicka, 1996, Blood, 88, 82
  39. Glenner, 1984, Biochem Biophys Res Commun, 122, 1131
  40. Mackay, 1997, Eur J Biochem, 244, 414
  41. Stadtman, 2001, Ann N Y Acad Sci, 928, 22
  42. Scaffidi, 2006, Science, 312, 1059
  43. Eriksson, 2003, Nature, 423, 293
  44. Ellis, 1995, Cell, 83, 655
  45. Lombard, 2005, Cell, 120, 497
  46. Aisenberg, 1984, Am J Med, 77, 1083
  47. Skok, 2001, Nat Immunol, 2, 848
  48. Branco, 2006, PLoS Biol, 4
  49. Jones, 1999, Nat Genet, 21, 163
  50. Goodell, 1996, J Exp Med, 183, 1797
  51. Wu Z Irizarry, 2003, A model based background adjustment for oligonucleotide expression arrays
  52. Wettenhall, 2004, Bioinformatics, 20, 3705
  53. Benjamini, 2001, Behav Brain Res, 125, 279
  54. Young, 2005, Bioinformatics, 21, 275

Cited by

See all 731

Metadata

Authors
Chambers, S. M., Shaw, C. A., Gatza, C., Fisk, C. J., Donehower, L. A., & Goodell, M. A.
Venue
PLoS Biology
Published
2007-07-24
Volume
5
Issue
8
Pages
e201
ISSN
1545-7885
Cited by
731
References
7
Language
en

About these checks

Registry, retraction, Cites and statistics results are computed, not judged, with one exception: a printed reference that no index lists is read once by a model before it counts as a citation error. Claims are extracted by a model and kept only when their quote appears verbatim in the text; each cited source is then checked, with a model’s help, for whether it says what the claim relies on. Those verdicts can be wrong — read the claim’s quote and the cited source before relying on one.

Statistics and arithmetic are recomputed, not judged.

Confidence bands are shown only for fields calibrated on our annotated test set. None is calibrated yet, so no band is shown.

What counts as a claim ›How we measure confidence ›How we check this ›

Are you an author, or do you see a problem with this page? Request a review