

The DOI matches its Crossref record; 64 of the 65 references it cites were found in a registry or an index.
Discovering Motifs in Ranked Lists of DNA Sequences
Open accessAbstract
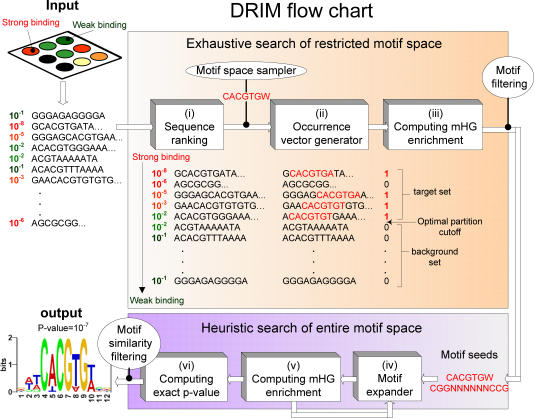
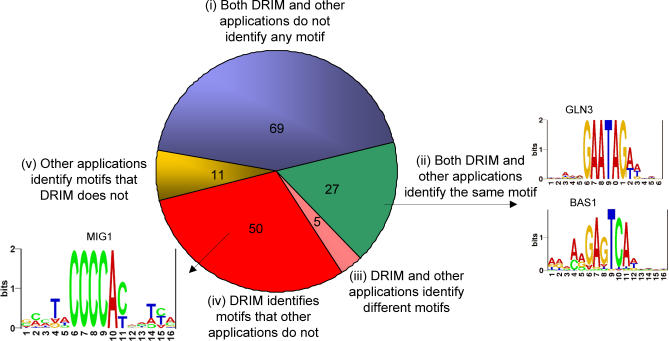
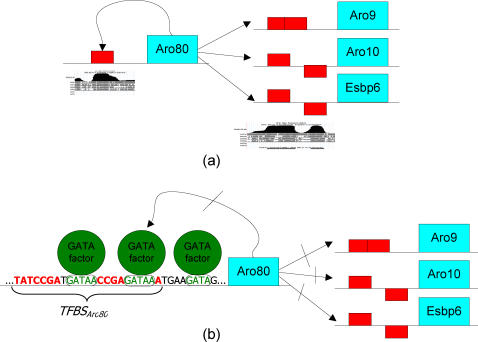
Computational methods for discovery of sequence elements that are enriched in a target set compared with a background set are fundamental in molecular biology research. One example is the discovery of transcription factor binding motifs that are inferred from ChIP-chip (chromatin immuno-precipitation on a microarray) measurements. Several major challenges in sequence motif discovery still require consideration: (i) the need for a principled approach to partitioning the data into target and background sets; (ii) the lack of rigorous models and of an exact p-value for measuring motif enrichment; (iii) the need for an appropriate framework for accounting for motif multiplicity; (iv) the tendency, in many of the existing methods, to report presumably significant motifs even when applied to randomly generated data. In this paper we present a statistical framework for discovering enriched sequence elements in ranked lists that resolves these four issues. We demonstrate the implementation of this framework in a software application, termed DRIM (discovery of rank imbalanced motifs), which identifies sequence motifs in lists of ranked DNA sequences. We applied DRIM to ChIP-chip and CpG methylation data and obtained the following results. (i) Identification of 50 novel putative transcription factor (TF) binding sites in yeast ChIP-chip data. The biological function of some of them was further investigated to gain new insights on transcription regulation networks in yeast. For example, our discoveries enable the elucidation of the network of the TF ARO80. Another finding concerns a systematic TF binding enhancement to sequences containing CA repeats. (ii) Discovery of novel motifs in human cancer CpG methylation data. Remarkably, most of these motifs are similar to DNA sequence elements bound by the Polycomb complex that promotes histone methylation. Our findings thus support a model in which histone methylation and CpG methylation are mechanistically linked. Overall, we demonstrate that the statistical framework embodied in the DRIM software tool is highly effective for identifying regulatory sequence elements in a variety of applications ranging from expression and ChIP-chip to CpG methylation data. DRIM is publicly available at http://bioinfo.cs.technion.ac.il/drim.
Overview
The claims and statistics of this paper haven’t been checked yet.
Run the check — free, no account needed. It reads the open-access text and checks the sources it cites.
Integrity signals
Registry
Cites
Statistics
Figures
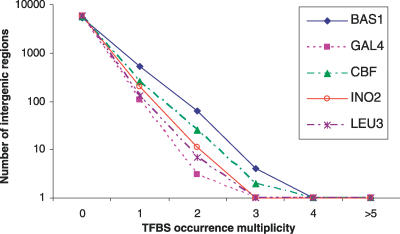
Verification
Claims the paper makes
The claims and statistics of this paper haven’t been checked yet.
Run the check — free, no account needed. It reads the open-access text and checks the sources it cites.
Claims other papers make about this one
Each is checked against this paper’s own text: does it say what the citing paper says it does?
In the citing paper
“These were enriched for specialized programs across ages: Embryonic epithelia upregulated genes for developmental processes (Figure 3K, S3K), while aged epithelia upregulated host-defense programs (Figure 3L, FDR q-value < 0.01, GOrilla (Eden et al., 2007, 2009;Baruch et al., 2014).”
From A cellular and spatial map of the choroid plexus across brain ventricles and ages (2021) · cites this paper as Eden et al., 2007
Self-check
Percentages, sums and reported differences re-computed from the paper’s own numbers.
The self-check needs the paper’s full text.
Citations
Cites
Gene Ontology: tool for the unification of biology
Ashburner, M., Ball, C. A., Blake, J. A., Botstein, D., Butler, H., Cherry, J. M., Davis, A. P., Dolinski, K., Dwight, S. S., Eppig, J. T., et al. (2000) · Nature Genetics · doi:10.1038/75556 · Cited by 43,206
Fitting a mixture model by expectation maximization to discover motifs in biopolymers.
Bailey, T. L., & Elkan, C. (1994) · PubMed · Cited by 4,982
Transcriptional Regulatory Networks in Saccharomyces cerevisiae
Lee, T. I., Rinaldi, N. J., Robert, F., Odom, D. T., Bar-Joseph, Z., Gerber, G. K., Hannett, N. M., Harbison, C. T., Thompson, C. M., Simon, I., et al. (2002) · Science · doi:10.1126/science.1075090 · Cited by 2,956
Control of Developmental Regulators by Polycomb in Human Embryonic Stem Cells
Lee, T. I., Jenner, R. G., Boyer, L. A., Guenther, M. G., Levine, S. S., Kumar, R., Chevalier, B. S., Johnstone, S. E., Cole, M. F., Isono, K., et al. (2006) · Cell · doi:10.1016/j.cell.2006.02.043 · Cited by 2,296
The Polycomb group protein EZH2 directly controls DNA methylation
Viré, E., Brenner, C., Deplus, R., Blanchon, L., Fraga, M., Didelot, C., Morey, L., Van Eynde, A., Bernard, D., Vanderwinden, J.-M., et al. (2006) · Nature · doi:10.1038/nature04431 · Cited by 2,204
Transcriptional regulatory code of a eukaryotic genome
Harbison, C. T., Gordon, D. B., Lee, T. I., Rinaldi, N. J., MacIsaac, K. D., Danford, T., Hannett, N. M., Tagne, J., Reynolds, D. B., Yoo, J. Y., et al. (2004) · Nature · doi:10.1038/nature02800 · Cited by 2,135
Boyle, E. I., Weng, S., Gollub, J., Jin, H., Botstein, D., Cherry, J. M., & Sherlock, G. (2004) · Bioinformatics · doi:10.1093/bioinformatics/bth456 · Cited by 2,067
Molecular classification of cutaneous malignant melanoma by gene expression profiling
Bittner, M. L., Meltzer, P. S., Chen, Y., Jiang, Y. Y., Seftor, E. A., Hendrix, M. J. C., Radmacher, M. D., Simon, R., Zohar Yakhini, B., Ben‐Dor, A., et al. (2000) · Nature · doi:10.1038/35020115 · Cited by 1,989
Genome-Wide Location and Function of DNA Binding Proteins
Ren, B., Robert, F., Wyrick, J. J., Aparicio, O. M., Jennings, E. G., Simon, I., Zeitlinger, J., Schreiber, J., Hannett, N. M., Kanin, E. I., et al. (2000) · Science · doi:10.1126/science.290.5500.2306 · Cited by 1,768
Control of Pancreas and Liver Gene Expression by HNF Transcription Factors
Odom, D. T., Zizlsperger, N., Gordon, D. B., Bell, G. W., Rinaldi, N. J., Murray, H. L., Volkert, T. L., Schreiber, J., Rolfe, A., Gifford, D. K., et al. (2004) · Science · doi:10.1126/science.1089769 · Cited by 1,348
Cited by
Sorted by citations
Molecular and genetic properties of tumors associated with local immune cytolytic activity
Rooney, M. S., Shukla, S. A., Wu, C. J., Getz, G., & Hacohen, N. (2015) · Cell · doi:10.1016/j.cell.2014.12.033 · Cited by 3,825
GOrilla: a tool for discovery and visualization of enriched GO terms in ranked gene lists
Eden, E., Navon, R., Steinfeld, I., Lipson, D., & Yakhini, Z. (2009) · BMC Bioinformatics · doi:10.1186/1471-2105-10-48 · Cited by 3,356
Host microbiota constantly control maturation and function of microglia in the CNS
Erny, D., Hrabě de Angelis, A. L., Jaitin, D., Wieghofer, P., Staszewski, O., David, E., Keren-Shaul, H., Mahlakoiv, T., Jakobshagen, K., Buch, T., et al. (2015) · Nature Neuroscience · doi:10.1038/nn.4030 · Cited by 3,569
Microglia development follows a stepwise program to regulate brain homeostasis
Matcovitch-Natan, O., Winter, D. R., Giladi, A., Vargas Aguilar, S., Spinrad, A., Sarrazin, S., Ben-Yehuda, H., David, E., Zelada González, F., Perrin, P., et al. (2016) · Science · doi:10.1126/science.aad8670 · Cited by 1,180
Reyfman, P. A., Walter, J. M., Joshi, N., Anekalla, K. R., McQuattie-Pimentel, A. C., Chiu, S., Fernandez, R., Akbarpour, M., Chen, C.-I., Ren, Z., et al. (2019) · American Journal of Respiratory and Critical Care Medicine · doi:10.1164/rccm.201712-2410oc · Cited by 1,203
Metadata
- Authors
- Eden, E., Lipson, D., Yogev, S., & Yakhini, Z.
- Affiliations
- Technion – Israel Institute of Technology (IL)
- Corresponding author
- Eden, Eran
- ORCID
- Lipson, Doron
- Venue
- PLoS Computational Biology
- Publisher
- Public Library of Science (PLoS)
- Published
- 2007-03-23
- Volume
- 3
- Issue
- 3
- Pages
- e39
- ISSN
- 1553-734X (ISSN-L)
- 1553-7358
- PMC
- PMC1829477
- OpenAlex
- W1981093360
- Cited by
- 696
- References
- 65
- Citations by year
- 2026: 18 · 2025: 25 · 2024: 23 · 2023: 44 · 2022: 42 · 2021: 80 · 2020: 54 · 2019: 57 · 2018: 53 · 2017: 52 · 2016: 53 · 2015: 36 · 2014: 31 · 2013: 41 · 2012: 22
- FWCI
- 6.49
- Type
- journal article
- Language
- en
- Open access
- gold
- doi.org
- Locations
- PLoS Computational Biology (publishedVersion, cc-by)
- Europe PMC (PubMed Central) (publishedVersion, cc-by)
- PubMed Central (publishedVersion, cc-by)
- PubMed (publishedVersion)
- DOAJ (DOAJ: Directory of Open Access Journals) (submittedVersion, cc-by-sa)
- Figshare (submittedVersion, cc-by)
- Funders
- Hebrew University of Jerusalem
- Topics
- Life Sciences › Biochemistry, Genetics and Molecular Biology › Molecular Biology › Genomics and Chromatin Dynamics
- Life Sciences › Biochemistry, Genetics and Molecular Biology › Molecular Biology › Genomics and Phylogenetic Studies
- Life Sciences › Biochemistry, Genetics and Molecular Biology › Molecular Biology › Bioinformatics and Genomic Networks
- Keywords
- motif discovery, ranked lists, transcription factor binding sites, ChIP-chip, CpG methylation, motif enrichment, Polycomb complexes, histone methylation, CA repeats
- MeSH terms
- Algorithms, Base Sequence, Molecular Sequence Data, Regulatory Sequences, Nucleic Acid, Sequence Homology, Nucleic Acid, Software, Sequence Alignment, Conserved Sequence, Sequence Analysis, DNA, CpG Islands, DNA Methylation, Chromatin Immunoprecipitation
About these checks
Registry, retraction, Cites and statistics results are computed, not judged, with one exception: a printed reference that no index lists is read once by a model before it counts as a citation error. Claims are extracted by a model and kept only when their quote appears verbatim in the text; each cited source is then checked, with a model’s help, for whether it says what the claim relies on. Those verdicts can be wrong — read the claim’s quote and the cited source before relying on one.
Statistics and arithmetic are recomputed, not judged.
Confidence bands are shown only for fields calibrated on our annotated test set. None is calibrated yet, so no band is shown.
What counts as a claim ›How we measure confidence ›How we check this ›
Are you an author, or do you see a problem with this page? Request a review
