

The DOI matches its Crossref record; 4 of the 4 references it cites were found in a registry or an index.
The Inactivation Principle: Mathematical Solutions Minimizing the Absolute Work and Biological Implications for the Planning of Arm Movements
Open accessAbstract
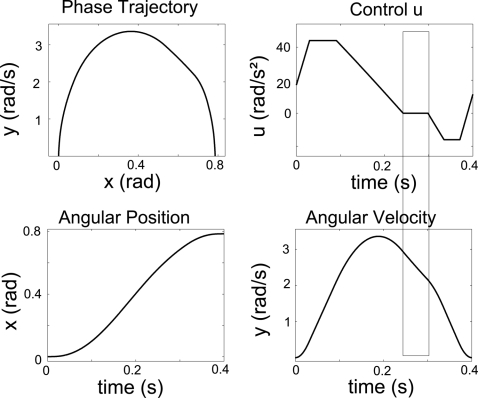
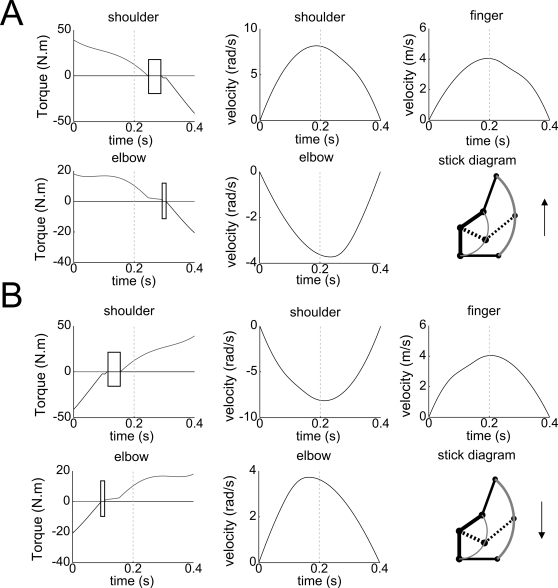
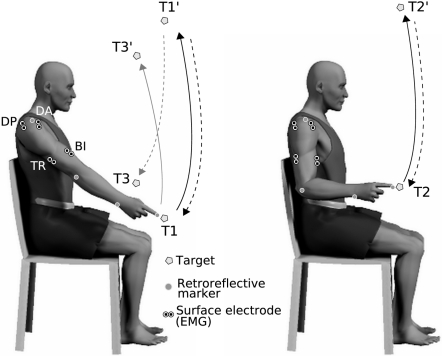
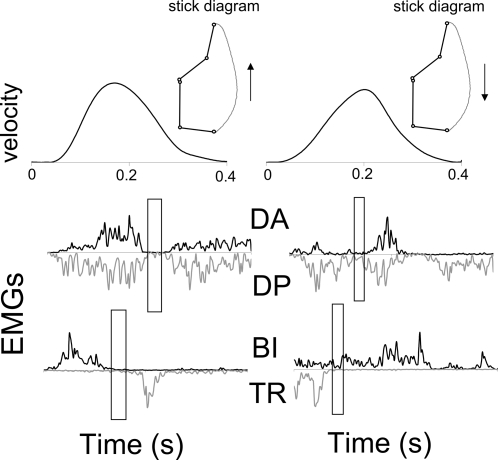
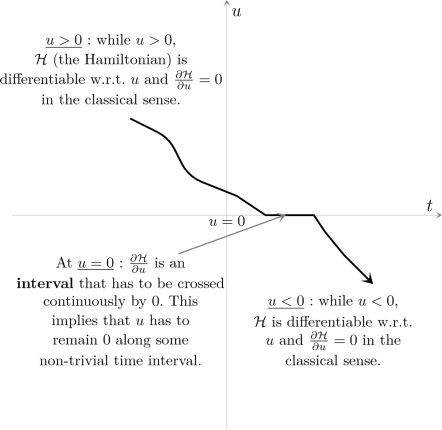
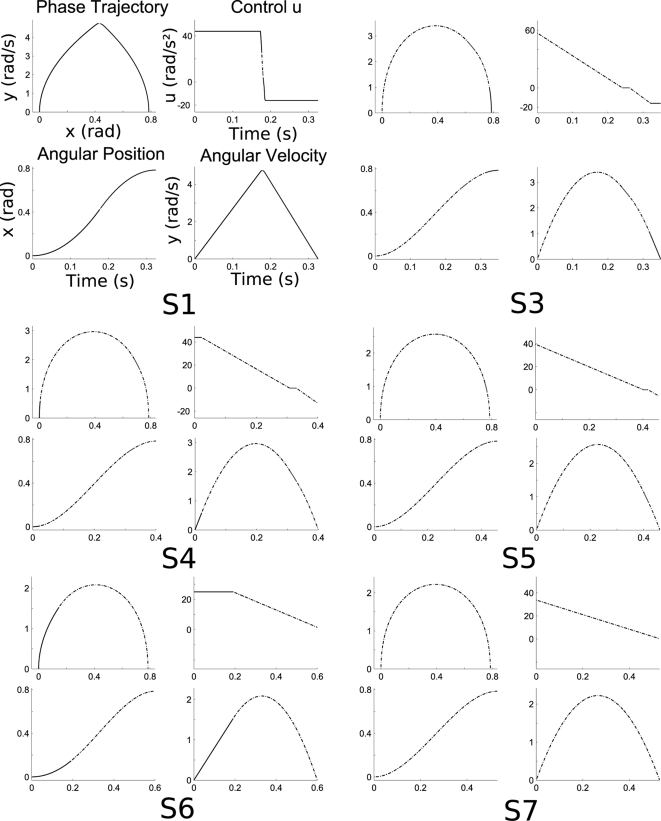
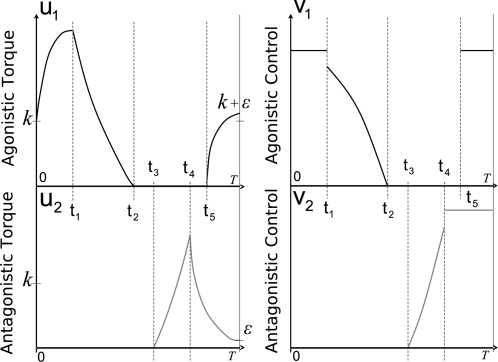
An important question in the literature focusing on motor control is to determine which laws drive biological limb movements. This question has prompted numerous investigations analyzing arm movements in both humans and monkeys. Many theories assume that among all possible movements the one actually performed satisfies an optimality criterion. In the framework of optimal control theory, a first approach is to choose a cost function and test whether the proposed model fits with experimental data. A second approach (generally considered as the more difficult) is to infer the cost function from behavioral data. The cost proposed here includes a term called the absolute work of forces, reflecting the mechanical energy expenditure. Contrary to most investigations studying optimality principles of arm movements, this model has the particularity of using a cost function that is not smooth. First, a mathematical theory related to both direct and inverse optimal control approaches is presented. The first theoretical result is the Inactivation Principle, according to which minimizing a term similar to the absolute work implies simultaneous inactivation of agonistic and antagonistic muscles acting on a single joint, near the time of peak velocity. The second theoretical result is that, conversely, the presence of non-smoothness in the cost function is a necessary condition for the existence of such inactivation. Second, during an experimental study, participants were asked to perform fast vertical arm movements with one, two, and three degrees of freedom. Observed trajectories, velocity profiles, and final postures were accurately simulated by the model. In accordance, electromyographic signals showed brief simultaneous inactivation of opposing muscles during movements. Thus, assuming that human movements are optimal with respect to a certain integral cost, the minimization of an absolute-work-like cost is supported by experimental observations. Such types of optimality criteria may be applied to a large range of biological movements.
Overview
The claims and statistics of this paper haven’t been checked yet.
Run the check — free, no account needed. It reads the open-access text and checks the sources it cites.
Integrity signals
Registry
Cites
Statistics
Figures
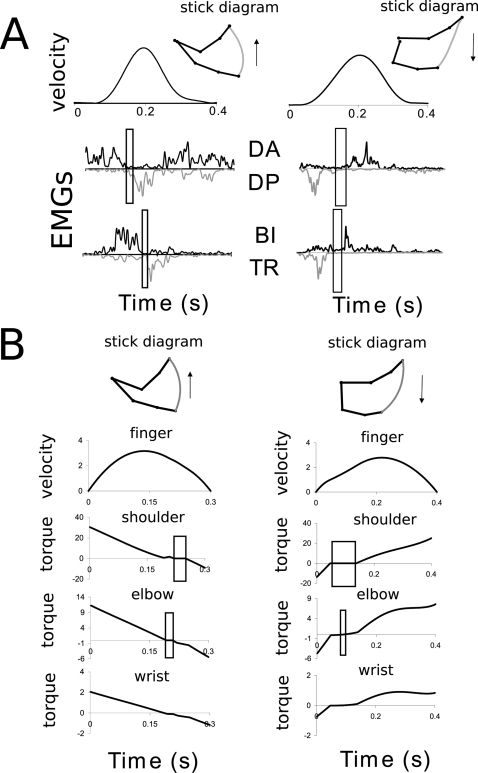
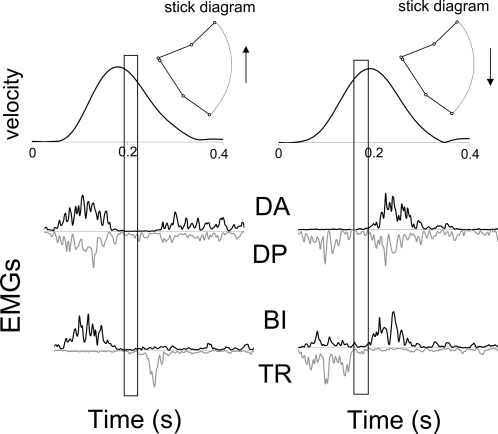
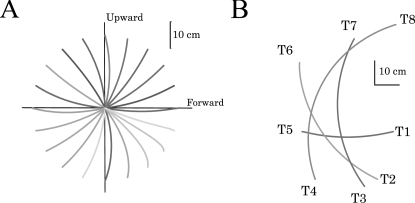
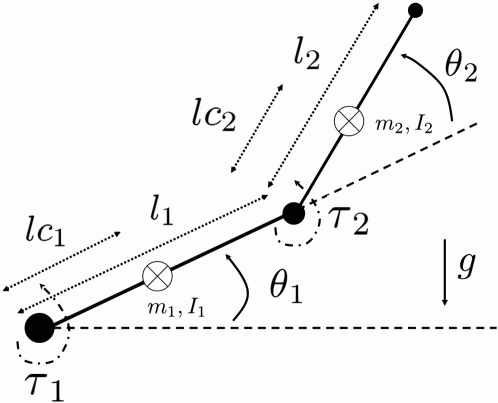
Verification
Claims the paper makes
The claims and statistics of this paper haven’t been checked yet.
Run the check — free, no account needed. It reads the open-access text and checks the sources it cites.
Claims other papers make about this one
Each is checked against this paper’s own text: does it say what the citing paper says it does?
The source backs part of the claim, not all of it — or backs it for a different population, condition or comparison.
In the citing paper
“This mixture of weighted error variance is related formally to phenomenological cost functions proposed to account for movement trajectories (cf.Todorov and Jordan 1998;Nakano et al. 1999;Berret et al. 2008).”
From Action and behavior: a free-energy formulation (2010) · cites this paper as Berret et al. 2008
Experimental — accuracy not yet measuredThe cited source says what the claim attributes to it.
In the citing paper
“This mixture is formally similar to cost-functions in the motor-control literature that try to account for smooth motor trajectories that are observed empirically (Todorov and Jordan 1998;Nakano et al. 1999;Berret et al. 2008).”
From Action and behavior: a free-energy formulation (2010) · cites this paper as Berret et al. 2008
Self-check
Percentages, sums and reported differences re-computed from the paper’s own numbers.
The self-check needs the paper’s full text.
Citations
Cites
Optimal feedback control as a theory of motor coordination
Todorov, E., & Jordan, M. I. (2002) · Nature Neuroscience · doi:10.1038/nn963 · Cited by 3,081
Signal-dependent noise determines motor planning
Harris, C. M., & Wolpert, D. M. (1998) · Nature · doi:10.1038/29528 · Cited by 2,498
Optimality principles in sensorimotor control
Todorov, E. (2004) · Nature Neuroscience · doi:10.1038/nn1309 · Cited by 1,746
Nakano, E., Imamizu, H., Osu, R., Uno, Y., Gomi, H., Yoshioka, T., & Kawato, M. (1999) · Journal of Neurophysiology · doi:10.1152/jn.1999.81.5.2140 · Cited by 321
Research works printed but not linked: 43
- P Morasso, 1981, Spatial control of arm movements., Exp Brain Res, 42, 223, 10.1007/BF00236911 · DOI
- JF Soechting, 1981, Invariant characteristics of a pointing movement in man., J Neurosci, 1, 710, 10.1523/JNEUROSCI.01-07-00710.1981 · DOI
- W Abend, 1982, Human arm trajectory formation., Brain, 105, 331, 10.1093/brain/105.2.331 · DOI
- MJ Hollerbach, 1982, Dynamic interactions between limb segments during planar arm movement., Biol Cybern, 44, 67, 10.1007/BF00353957 · DOI
- CG Atkeson, 1985, Kinematic features of unrestrained vertical arm movements., J Neurosci, 5, 2318, 10.1523/JNEUROSCI.05-09-02318.1985 · DOI · Paper page
- JJ Boessenkool, 1998, A comparison of curvatures of left and right hand movements in a simple pointing task., Exp Brain Res, 120, 369, 10.1007/s002210050410 · DOI
- KC Nishikawa, 1999, Do arm postures vary with the speed of reaching?, J Neurophysiol, 81, 2582, 10.1152/jn.1999.81.5.2582 · DOI
- F Hermens, 2004, Posture-based or trajectory-based movement planning: a comparison of direct and indirect pointing movements., Exp Brain Res, 159, 340, 10.1007/s00221-004-1959-1 · DOI
- R Kalman, 1964, When is a linear control system optimal?, ASME Trans, J Basic Eng, 86, 51, 10.1115/1.3653115 · DOI
- KP Körding, 2004, The loss function of sensorimotor learning., Proc Natl Acad Sci U S A, 101, 9839, 10.1073/pnas.0308394101 · DOI
- S Ben-Itzhak, 2007, Minimum acceleration criterion with constraints implies bang-bang control as an underlying principle for optimal trajectories of arm reaching movements., Neural Comput, 20, 779, 10.1162/neco.2007.12-05-077 · DOI
- T Flash, 1985, The coordination of arm movements: an experimentally confirmed mathematical model., J Neurosci, 5, 1688, 10.1523/JNEUROSCI.05-07-01688.1985 · DOI · Paper page
- Y Uno, 1989, Formation and control of optimal trajectory in human multijoint arm movement. minimum torque-change model., Biol Cybern, 61, 89, 10.1007/BF00204593 · DOI
- A Biess, 2007, A computational model for redundant human three-dimensional pointing movements: integration of independent spatial and temporal motor plans simplifies movement dynamics., J Neurosci, 27, 13045, 10.1523/JNEUROSCI.4334-06.2007 · DOI
- WL Nelson, 1983, Physical principles for economies of skilled movements., Biol Cybern, 46, 135, 10.1007/BF00339982 · DOI
- JF Soechting, 1995, Moving effortlessly in three dimensions: does Donders' law apply to arm movement?, J Neurosci, 15, 6271, 10.1523/JNEUROSCI.15-09-06271.1995 · DOI
- RM Alexander, 1997, A minimum energy cost hypothesis for human arm trajectories., Biol Cybern, 76, 97, 10.1007/s004220050324 · DOI
- MA Admiraal, 2004, Modeling kinematics and dynamics of human arm movements., Motor Control, 8, 312, 10.1123/mcj.8.3.312 · DOI
- T Kang, 2005, Determining natural arm configuration along a reaching trajectory., Exp Brain Res, 167, 352, 10.1007/s00221-005-0039-5 · DOI
- E Guigon, 2007, Computational motor control: redundancy and invariance., J Neurophysiol, 97, 331, 10.1152/jn.00290.2006 · DOI
- SH Scott, 2004, Optimal feedback control and the neural basis of volitional motor control., Nat Rev Neurosci, 5, 532, 10.1038/nrn1427 · DOI
- M Flanders, 1992, Two components of muscle activation: scaling with the speed of arm movement., J Neurophysiol, 67, 931, 10.1152/jn.1992.67.4.931 · DOI
- CA Buneo, 1994, Muscle activation patterns for reaching: the representation of distance and time., J Neurophysiol, 71, 1546, 10.1152/jn.1994.71.4.1546 · DOI
- C Papaxanthis, 1998, Effects of movement direction upon kinematic characteristics of vertical arm pointing movements in man., Neurosci Lett, 253, 103, 10.1016/S0304-3940(98)00604-1 · DOI
- C Papaxanthis, 2003, Trajectories of arm pointing movements on the sagittal plane vary with both direction and speed., Exp Brain Res, 148, 498, 10.1007/s00221-002-1327-y · DOI
- R Gentili, 2007, Motor planning of arm movements is direction-dependent in the gravity field., Neuroscience, 145, 20, 10.1016/j.neuroscience.2006.11.035 · DOI
- ABL Seac'h, 2007, Multimodal reference frame for the planning of vertical arms movements., Neurosci Lett, 423, 211, 10.1016/j.neulet.2007.07.034 · DOI
- C Papaxanthis, 2005, Kinematic and dynamic processes for the control of pointing movements in humans revealed by short-term exposure to microgravity., Neuroscience, 135, 371, 10.1016/j.neuroscience.2005.06.063 · DOI
- B Berret, 2008, How humans control arm movements., Proc Steklov Inst Math, 261, 44, 10.1134/S0081543808020053 · DOI
- M Dornay, 1996, Minimum muscle-tension change trajectories predicted by using a 17-muscle model of the monkey's arm., J Mot Behav, 28, 83, 10.1080/00222895.1996.9941736 · DOI
- J Nishii, 2006, An analytical estimation of the energy cost for legged locomotion., J Theor Biol, 238, 636, 10.1016/j.jtbi.2005.06.027 · DOI
- AG Feldman, 2007, Threshold position control and the principle of minimal interaction in motor actions., Prog Brain Res, 165, 267, 10.1016/S0079-6123(06)65017-6 · DOI
- D Flament, 1984, Braking of fast and accurate elbow flexions in the monkey., J Physiol, 349, 195, 10.1113/jphysiol.1984.sp015152 · DOI
- S Engelbrecht, 2001, Minimum principles in motor control., J Math Psychol, 45, 497, 10.1006/jmps.2000.1295 · DOI
- JJ Pellegrini, 1996, Force path curvature and conserved features of muscle activation., Exp Brain Res, 110, 80, 10.1007/BF00241377 · DOI
- A d'Avella, 2006, Control of fast-reaching movements by muscle synergy combinations., J Neurosci, 26, 7791, 10.1523/JNEUROSCI.0830-06.2006 · DOI
- M Flanders, 1996, Basic features of phasic activation for reaching in vertical planes., Exp Brain Res, 110, 67, 10.1007/BF00241376 · DOI
- I Kurtzer, 2005, Random change in cortical load representation suggests distinct control of posture and movement., Nat Neurosci, 8, 498, 10.1038/nn1420 · DOI
- ID Loram, 2001, Human balancing of an inverted pendulum: is sway size controlled by ankle impedance?, J Physiol, 532, 879, 10.1111/j.1469-7793.2001.0879e.x · DOI
- JF Soechting, 1984, Effect of target size on spatial and temporal characteristics of a pointing movement in man., Exp Brain Res, 54, 121, 10.1007/BF00235824 · DOI
- JP Gauthier, 2001, Deterministic observation theory and applications, 10.1017/CBO9780511546648 · DOI
- JP Gauthier, 2005, On the one-step bracket generating motion planning problem., J Dyn Control Syst, 11(21), 215, 10.1007/s10883-005-4171-0 · DOI
- M Hallett, 1979, Ballistic flexion movements of the human thumb., J Physiol, 294, 33, 10.1113/jphysiol.1979.sp012913 · DOI
Cited by
Action and behavior: a free-energy formulation
Friston, K. J., Daunizeau, J., Kilner, J., & Kiebel, S. J. (2010) · Biological Cybernetics · doi:10.1007/s00422-010-0364-z · Cited by 866
“This mixture of weighted error variance is related formally to phenomenological cost functions proposed to account for movement trajectories (cf. Todorov and Jordan 1998; Nakano et al. 1999; Berret et al. 2008).”
Background
Metadata
- Authors
- Berret, B., Darlot, C., Jean, F., Pozzo, T., Papaxanthis, C., & Gauthier, J. P.
- Affiliations
- Inserm (FR)
- Centre National de la Recherche Scientifique (FR)
- École Nationale Supérieure de Techniques Avancées (FR)
- Université de Toulon (FR)
- Corresponding author
- Berret, Bastien
- Venue
- PLoS Computational Biology
- Publisher
- Public Library of Science (PLoS)
- Published
- 2008-10-24
- Volume
- 4
- Issue
- 10
- Pages
- e1000194
- ISSN
- 1553-734X (ISSN-L)
- 1553-7358
- PMC
- PMC2561290
- OpenAlex
- W2148216652
- Cited by
- 163
- References
- 4
- Citations by year
- 2026: 7 · 2025: 13 · 2024: 6 · 2023: 9 · 2022: 8 · 2021: 14 · 2020: 12 · 2019: 8 · 2018: 7 · 2017: 9 · 2016: 17 · 2015: 9 · 2014: 6 · 2013: 9 · 2012: 9
- FWCI
- 3.46
- Type
- journal article
- Language
- en
- Open access
- gold
- doi.org
- Licence
- cc-by
- Locations
- PLoS Computational Biology (publishedVersion, cc-by)
- Europe PMC (PubMed Central) (publishedVersion, cc-by)
- PubMed Central (publishedVersion, cc-by)
- PubMed (publishedVersion)
- HAL (submittedVersion, other-oa)
- DOAJ (DOAJ: Directory of Open Access Journals) (submittedVersion, cc-by-sa)
- Figshare (submittedVersion, cc-by)
- Topics
- Life Sciences › Neuroscience › Cognitive Neuroscience › Motor Control and Adaptation
- Physical Sciences › Engineering › Biomedical Engineering › Muscle activation and electromyography studies
- Physical Sciences › Engineering › Biomedical Engineering › Mechanics and Biomechanics Studies
- Keywords
- optimal control, cost function, non-smooth cost functions, motor control, electromyography, velocity profiles, degrees of freedom
- MeSH terms
- Adult, Arm, Biomechanical Phenomena, Postural Balance, Physical Exertion, Feedback, Gravitation, Humans, Joints, Male, Models, Biological, Movement, Muscle Contraction, Psychomotor Performance, Range of Motion, Articular
About these checks
Registry, retraction, Cites and statistics results are computed, not judged, with one exception: a printed reference that no index lists is read once by a model before it counts as a citation error. Claims are extracted by a model and kept only when their quote appears verbatim in the text; each cited source is then checked, with a model’s help, for whether it says what the claim relies on. Those verdicts can be wrong — read the claim’s quote and the cited source before relying on one.
Statistics and arithmetic are recomputed, not judged.
Confidence bands are shown only for fields calibrated on our annotated test set. None is calibrated yet, so no band is shown.
What counts as a claim ›How we measure confidence ›How we check this ›
Are you an author, or do you see a problem with this page? Request a review
How to cite
Cite CoChat for the checks on this page, and the paper for its own findings.
- This page
- CoChat. (2026). Citation check: The Inactivation Principle: Mathematical Solutions Minimizing the Absolute Work and Biological Implications for the Planning of Arm Movements. https://app.cochat.ai/papers/10.1371/journal.pcbi.1000194
- The paper
- Berret, B., Darlot, C., Jean, F., Pozzo, T., Papaxanthis, C., & Gauthier, J. P. (2008). The Inactivation Principle: Mathematical Solutions Minimizing the Absolute Work and Biological Implications for the Planning of Arm Movements. PLoS Computational Biology. https://doi.org/10.1371/journal.pcbi.1000194
Data sources
Bibliographic data: Semantic Scholar, OpenAlex, Crossref.
Contains information from the Semantic Scholar Academic Graph Datasets, made available under the ODC Attribution License (ODC-BY 1.0).
Semantic Scholar’s data is described in: Kinney, R., et al. (2023). The Semantic Scholar Open Data Platform. arXiv:2301.10140.
