

The DOI matches its Crossref record; 53 of the 55 references it cites were found in a registry or an index.
Geometric De-noising of Protein-Protein Interaction Networks
Open accessAbstract
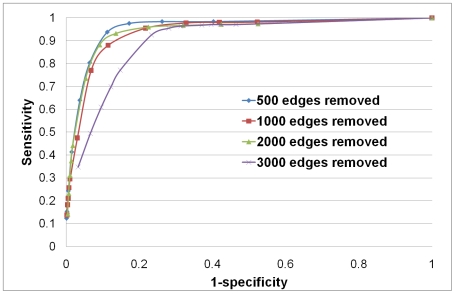
Understanding complex networks of protein-protein interactions (PPIs) is one of the foremost challenges of the post-genomic era. Due to the recent advances in experimental bio-technology, including yeast-2-hybrid (Y2H), tandem affinity purification (TAP) and other high-throughput methods for protein-protein interaction (PPI) detection, huge amounts of PPI network data are becoming available. Of major concern, however, are the levels of noise and incompleteness. For example, for Y2H screens, it is thought that the false positive rate could be as high as 64%, and the false negative rate may range from 43% to 71%. TAP experiments are believed to have comparable levels of noise.We present a novel technique to assess the confidence levels of interactions in PPI networks obtained from experimental studies. We use it for predicting new interactions and thus for guiding future biological experiments. This technique is the first to utilize currently the best fitting network model for PPI networks, geometric graphs. Our approach achieves specificity of 85% and sensitivity of 90%. We use it to assign confidence scores to physical protein-protein interactions in the human PPI network downloaded from BioGRID. Using our approach, we predict 251 interactions in the human PPI network, a statistically significant fraction of which correspond to protein pairs sharing common GO terms. Moreover, we validate a statistically significant portion of our predicted interactions in the HPRD database and the newer release of BioGRID. The data and Matlab code implementing the methods are freely available from the web site: http://www.kuchaev.com/Denoising.
Overview
The claims and statistics of this paper haven’t been checked yet.
Run the check — free, no account needed. It reads the open-access text and checks the sources it cites.
Integrity signals
Registry
Cites
Statistics
Figures
Verification
Claims the paper makes
The claims and statistics of this paper haven’t been checked yet.
Run the check — free, no account needed. It reads the open-access text and checks the sources it cites.
Claims other papers make about this one
Each is checked against this paper’s own text: does it say what the citing paper says it does?
In the citing paper
“Yeast two hybrid (Y2H), affinity-purification mass spectrometry (APMS), and other high-throughput experimental approaches have identified many pairs of interacting proteins in yeast and other organisms (1–5), but there are discrepancies between sets generated using the different methods and considerable false positive and false negative rates (6–8).”
From Computed structures of core eukaryotic protein complexes (2021) · cites this paper as [6]
Self-check
Percentages, sums and reported differences re-computed from the paper’s own numbers.
The self-check needs the paper’s full text.
Citations
Cites
Gene Ontology: tool for the unification of biology
Ashburner, M., Ball, C. A., Blake, J. A., Botstein, D., Butler, H., Cherry, J. M., Davis, A. P., Dolinski, K., Dwight, S. S., Eppig, J. T., et al. (2000) · Nature Genetics · doi:10.1038/75556 · Cited by 43,206
Emergence of Scaling in Random Networks
Barabási, A.-L., & Albert, R. (1999) · Science · doi:10.1126/science.286.5439.509 · Cited by 36,135
Golub, G. (2012) · doi:10.56021/9781421407944 · Cited by 34,505
Book Review: Pattern Recognition and Machine Learning
Nasrabadi, N. M. (2007) · Journal of Electronic Imaging · doi:10.1117/1.2819119 · Cited by 22,066
Pattern Recognition and Machine Learning
(2006) · doi:10.1007/978-0-387-45528-0 · Cited by 9,824
KEGG for linking genomes to life and the environment
Kanehisa, M. I., Araki, M., Goto, S., Hattori, M., Hirakawa, M., Itoh, M., Katayama, T., Kawashima, S., Okuda, S., Tokimatsu, T., et al. (2007) · Nucleic Acids Research · doi:10.1093/nar/gkm882 · Cited by 6,828
Erdős, P., & Rényi, A. (2022) · Publicationes Mathematicae Debrecen · doi:10.5486/pmd.1959.6.3-4.12 · Cited by 5,337
A comprehensive analysis of protein–protein interactions in Saccharomyces cerevisiae
Uetz, P., Giot, L., Cagney, G., Mansfield, T. A., Judson, R. S., Knight, J. R., Lockshon, D., Narayan, V., Srinivasan, M., Pochart, P., et al. (2000) · Nature · doi:10.1038/35001009 · Cited by 4,706
BioGRID: a general repository for interaction datasets
Stark, C. (2006) · Nucleic Acids Research · doi:10.1093/nar/gkj109 · Cited by 3,960
Systematic identification of protein complexes in Saccharomyces cerevisiae by mass spectrometry
Ho, Y., Gruhler, A., Heilbut, A. M., Bader, G. D., Moore, L., Adams, S., Millar, A., Taylor, P. P., Bennett, K. L., Boutilier, K., et al. (2002) · Nature · doi:10.1038/415180a · Cited by 3,573
Cited by
Sorted by citations
Computed structures of core eukaryotic protein complexes
Humphreys, I. R., Pei, J., Baek, M., Krishnakumar, A., Anishchenko, I., Ovchinnikov, S., Zhang, J., Ness, T. J., Banjade, S., Bagde, S. R., et al. (2021) · Science · doi:10.1126/science.abm4805 · Cited by 542
Link prediction techniques, applications, and performance: A survey
Kumar, A., Singh, S. S., Singh, K., & Biswas, B. (2020) · Physica A Statistical Mechanics and its Applications · doi:10.1016/j.physa.2020.124289 · Cited by 549
Analyzing and interpreting genome data at the network level with ConsensusPathDB
Herwig, R., Hardt, C., Lienhard, M., & Kamburov, A. (2016) · Nature Protocols · doi:10.1038/nprot.2016.117 · Cited by 408
Cannistraci, C. V., Alanis‐Lobato, G., & Ravasi, T. (2013) · Scientific Reports · doi:10.1038/srep01613 · Cited by 403
Causal Network Inference by Optimal Causation Entropy
Sun, J., Taylor, D., & Bollt, E. M. (2015) · SIAM Journal on Applied Dynamical Systems · doi:10.1137/140956166 · Cited by 219
Lei, C., & Ruan, J. (2012) · Bioinformatics · doi:10.1093/bioinformatics/bts688 · Cited by 196
Machine learning meets complex networks via coalescent embedding in the hyperbolic space
Muscoloni, A., Thomas, J. M., Ciucci, S., Bianconi, G., & Cannistraci, C. V. (2017) · Nature Communications · doi:10.1038/s41467-017-01825-5 · Cited by 188
Network embedding in biomedical data science
Su, C., Tong, J., Zhu, Y., Cui, P., & Wang, F. (2018) · Briefings in Bioinformatics · doi:10.1093/bib/bby117 · Cited by 176
Zaki, N., Efimov, D., & Berengueres, J. O. L. (2013) · BMC Bioinformatics · doi:10.1186/1471-2105-14-163 · Cited by 175
To Embed or Not: Network Embedding as a Paradigm in Computational Biology
Nelson, W., Žitnik, M., Wang, B., Leskovec, J., Goldenberg, A., & Sharan, R. (2019) · Frontiers in Genetics · doi:10.3389/fgene.2019.00381 · Cited by 164
Emergent Complex Network Geometry
Wu, Z., Menichetti, G., Rahmede, C., & Ginestra Bianconi, A. (2015) · Repository KITopen (Karlsruhe Institute of Technology) · doi:10.5445/ir/1000048411 · Cited by 149
Protein–protein interactions: detection, reliability assessment and applications
Peng, X., Wang, J., Peng, W., Wu, F., & Pan, Y. F. (2016) · Briefings in Bioinformatics · doi:10.1093/bib/bbw066 · Cited by 150
Inferring Interaction Networks From Multi-Omics Data
Hawe, J. S., Theis, F. J., & Heinig, M. (2019) · Frontiers in Genetics · doi:10.3389/fgene.2019.00535 · Cited by 148
Fast Inference for the Latent Space Network Model Using a Case-Control Approximate Likelihood
Raftery, A. E., Niu, X. M., Hoff, P. D., & Yeung, K. Y. (2012) · Journal of Computational and Graphical Statistics · doi:10.1080/10618600.2012.679240 · Cited by 138
Cannistraci, C. V., Alanis‐Lobato, G., & Ravasi, T. (2013) · Bioinformatics · doi:10.1093/bioinformatics/btt208 · Cited by 126
A survey of computational methods for protein complex prediction from protein interaction networksPreprint
Srihari, S. (2013) · Cited by 123
Pierri, C. L., Parisi, G., & Porcelli, V. (2010) · Biochimica et Biophysica Acta (BBA) - Proteins and Proteomics · doi:10.1016/j.bbapap.2010.04.008 · Cited by 115
A SURVEY OF COMPUTATIONAL METHODS FOR PROTEIN COMPLEX PREDICTION FROM PROTEIN INTERACTION NETWORKS
Srihari, S., & LEONG, H. W. (2012) · Journal of Bioinformatics and Computational Biology · doi:10.1142/s021972001230002x · Cited by 112
Knowledge graphs and their applications in drug discovery
MacLean, F. (2021) · Expert Opinion on Drug Discovery · doi:10.1080/17460441.2021.1910673 · Cited by 105
SARS‐CoV‐2–host proteome interactions for antiviral drug discovery
Liu, X., Huuskonen, S., Laitinen, T., Redchuk, T. A., Bogacheva, M. S., Salokas, K., Pöhner, I., Öhman, T., Tonduru, A. K., Hassinen, A., et al. (2021) · Molecular Systems Biology · doi:10.15252/msb.202110396 · Cited by 104
Emergent Complex Network Geometry
Wu, Z., Menichetti, G., Rahmede, C., & Bianconi, G. (2015) · Scientific Reports · doi:10.1038/srep10073 · Cited by 98
Evolving graphs: dynamical models, inverse problems and propagation
Grindrod, P., & Higham, D. J. (2009) · Proceedings of the Royal Society A Mathematical Physical and Engineering Sciences · doi:10.1098/rspa.2009.0456 · Cited by 98
Self-citationProtein Pockets: Inventory, Shape, and Comparison
Coleman, R. G., & Sharp, K. A. (2010) · Journal of Chemical Information and Modeling · doi:10.1021/ci900397t · Cited by 89
t-LSE: A Novel Robust Geometric Approach for Modeling Protein-Protein Interaction Networks
Zhu, L., You, Z., Huang, D.-S., & Wang, B. (2013) · PLoS ONE · doi:10.1371/journal.pone.0058368 · Cited by 90
Computational identification of protein-protein interactions in model plant proteomes
Ding, Z., & Kihara, D. (2019) · Scientific Reports · doi:10.1038/s41598-019-45072-8 · Cited by 90
Graphlet-based measures are suitable for biological network comparison
Hayes, W. B., Sun, K., & Pržulj, N. (2013) · Bioinformatics · doi:10.1093/bioinformatics/bts729 · Cited by 90
Self-citationGraphCrunch 2: Software tool for network modeling, alignment and clustering
Kuchaiev, O., Stevanović, A., Hayes, W. B., & Pržulj, N. (2011) · BMC Bioinformatics · doi:10.1186/1471-2105-12-24 · Cited by 79
Self-citationEfficient embedding of complex networks to hyperbolic space via their Laplacian
Alanis‐Lobato, G., Mier, P., & Andrade-Navarro, M. A. (2016) · Scientific Reports · doi:10.1038/srep30108 · Cited by 82
Computational Methods for Predicting Protein‐Protein Interactions Using Various Protein Features
Ding, Z., & Kihara, D. (2018) · Current Protocols in Protein Science · doi:10.1002/cpps.62 · Cited by 77
Protein‐protein interactions: Making sense of networks via graph‐theoretic modeling
Pržulj, N. (2010) · BioEssays · doi:10.1002/bies.201000044 · Cited by 78
Self-citationDurán, C., Daminelli, S., Thomas, J. M., Haupt, V. J., Schroeder, M., & Cannistraci, C. V. (2017) · Briefings in Bioinformatics · doi:10.1093/bib/bbx041 · Cited by 69
A Two-Stage Geometric Method for Pruning Unreliable Links in Protein-Protein Networks
Zhu, L., Deng, S.-P., & Huang, D.-S. (2015) · IEEE Transactions on NanoBioscience · doi:10.1109/tnb.2015.2420754 · Cited by 66
Complex systems and network science: a survey
Yang, K., Li, J., Liu, M., Lei, T., Xu, X., Wu, H., Cao, J., & Qi, G. (2023) · Journal of Systems Engineering and Electronics · doi:10.23919/jsee.2023.000080 · Cited by 64
Combinatorial Complexity and Compositional Drift in Protein Interaction Networks
Deeds, E. J., Krivine, J., Ferêt, J., Vincent Danos, A., & Fontana, W. (2012) · PLoS ONE · doi:10.1371/journal.pone.0032032 · Cited by 60
Thomas, J. M., Muscoloni, A., Ciucci, S., Bianconi, G., & Cannistraci, C. V. (2016) · arXiv (Cornell University) · doi:10.48550/arxiv.1602.06522 · Cited by 60
Lei, Y., You, Z., Ji, Z., Zhu, L., & Huang, D.-S. (2012) · BMC Bioinformatics · doi:10.1186/1471-2105-13-s7-s3 · Cited by 57
Robustness of metabolic networks: A review of existing definitions
Larhlimi, A., Blachon, S., Selbig, J., & Nikoloski, Z. (2011) · Biosystems · doi:10.1016/j.biosystems.2011.06.002 · Cited by 57
Revealing Missing Parts of the Interactome via Link Prediction
Hulovatyy, Y., Solava, R. W., & Milenković, T. (2014) · PLoS ONE · doi:10.1371/journal.pone.0090073 · Cited by 51
Increasing the reliability of protein–protein interaction networks via non-convex semantic embedding
Zhu, L., You, Z., & Huang, D.-S. (2013) · Neurocomputing · doi:10.1016/j.neucom.2013.04.027 · Cited by 53
Predicting Future Scientific Discoveries Based on a Networked Analysis of the Past Literature
Nagarajan, M., Wilkins, A. D., Bachman, B. J., Novikov, I. B., Bao, S., Haas, P. J., Terrón-Díaz, M. E., Bhatia, S., Adikesavan, A. K., Labrie, J. J., et al. (2015) · ACM SIGKDD Conference on Knowledge Discovery and Data Mining (KDD) · doi:10.1145/2783258.2788609 · Cited by 52
Xiao, Z., & Deng, Y. (2020) · PLoS ONE · doi:10.1371/journal.pone.0238915 · Cited by 49
Quasi-Continuous Interpolation Scheme for Pathways between Distant Configurations
Wales, D. J., & Carr, J. M. (2012) · Journal of Chemical Theory and Computation · doi:10.1021/ct3004832 · Cited by 49
Zhang, W., Xu, J., Li, Y., & Zou, X. (2016) · IEEE Transactions on Computational Biology and Bioinformatics · doi:10.1109/tcbb.2016.2615931 · Cited by 49
Yang, F., Lei, Y., Zhou, M., Yao, Q., Han, Y., Wu, X. Y., Zhong, W., Zhu, C., Xu, W., Tao, R. N., et al. (2017) · Nucleic Acids Research · doi:10.1093/nar/gkx1173 · Cited by 49
Diculescu, V. C., & Oliveira‐Brett, A. M. (2015) · Bioelectrochemistry · doi:10.1016/j.bioelechem.2015.10.004 · Cited by 47
Zhang, X.-F., Dai, D., Ou-Yang, L., & Yan, H. (2014) · BMC Bioinformatics · doi:10.1186/1471-2105-15-186 · Cited by 46
IntScore: a web tool for confidence scoring of biological interactions
Kamburov, A., Stelzl, U., & Herwig, R. (2012) · Nucleic Acids Research · doi:10.1093/nar/gks492 · Cited by 45
The Energy Landscape, Folding Pathways and the Kinetics of a Knotted Protein
Prentiss, M. C., Wales, D. J., & Wolynes, P. G. (2010) · PLoS Computational Biology · doi:10.1371/journal.pcbi.1000835 · Cited by 44
Manifold learning and maximum likelihood estimation for hyperbolic network embedding
Alanis‐Lobato, G., Mier, P., & Andrade-Navarro, M. A. (2016) · Applied Network Science · doi:10.1007/s41109-016-0013-0 · Cited by 45
Zhu, L., Deng, S.-P., You, Z., & Huang, D.-S. (2015) · IEEE Transactions on Computational Biology and Bioinformatics · doi:10.1109/tcbb.2015.2407393 · Cited by 42
Statistical Assessment of Crosstalk Enrichment between Gene Groups in Biological Networks
McCormack, T., Frings, O., Alexeyenko, A., & Sonnhammer, E. L. L. (2013) · PLoS ONE · doi:10.1371/journal.pone.0054945 · Cited by 40
ppiPre: predicting protein-protein interactions by combining heterogeneous features
Deng, Y., Gao, L., & Wang, B. (2013) · BMC Systems Biology · doi:10.1186/1752-0509-7-s2-s8 · Cited by 38
The latent geometry of the human protein interaction network
Alanis‐Lobato, G., Mier, P., & Andrade-Navarro, M. A. (2018) · Bioinformatics · doi:10.1093/bioinformatics/bty206 · Cited by 41
A Network-based Approach for Predicting Missing Pathway Interactions
Navlakha, S., Gitter, A., & Bar‐Joseph, Z. (2012) · PLoS Computational Biology · doi:10.1371/journal.pcbi.1002640 · Cited by 35
Network and Pathway Analysis of Toxicogenomics Data
Barel, G., & Herwig, R. (2018) · Frontiers in Genetics · doi:10.3389/fgene.2018.00484 · Cited by 36
Evolution of the Potential Energy Landscape with Static Pulling Force for Two Model Proteins
Wales, D. J., & Head-Gordon, T. L. (2012) · The Journal of Physical Chemistry B · doi:10.1021/jp211806z · Cited by 35
A survey on graph embedding techniques for biomedical data: Methods and applications
Wu, Y., Chen, Y., Yin, Z., Ding, W., & King, I. (2023) · Information Fusion · doi:10.1016/j.inffus.2023.101909 · Cited by 33
Computed cancer interactome explains the effects of somatic mutations in cancers
Zhang, J., Pei, J., Durham, J., Bos, T., & Cong, Q. (2022) · Protein Science · doi:10.1002/pro.4479 · Cited by 31
Zhang, W., Xu, J., & Zou, X. (2019) · IEEE Transactions on Computational Biology and Bioinformatics · doi:10.1109/tcbb.2019.2916038 · Cited by 30
Mass-Linked Immuno-Selective Assays in Targeted Proteomics
Madian, A. G., Rochelle, N. S., & Regnier, F. E. (2012) · Analytical Chemistry · doi:10.1021/ac302071k · Cited by 29
An integrative approach to modeling biological networks
Memišević, V., Milenković, T., & Pržulj, N. (2010) · Berichte aus der medizinischen Informatik und Bioinformatik/Journal of integrative bioinformatics · doi:10.1515/jib-2010-120 · Cited by 27
Self-citationThe inherent community structure of hyperbolic networks
Kovács, B., & Palla, G. (2021) · Scientific Reports · doi:10.1038/s41598-021-93921-2 · Cited by 27
Network-based Drug Repurposing: A Critical Review
Selvaraj, N., Swaroop, A. K., Nidamanuri, B. S. S., Kumar, R. R., Natarajan, J., & Selvaraj, J. (2022) · Current Drug Research Reviews · doi:10.2174/2589977514666220214120403 · Cited by 27
Zhang, X., Dai, D., & Li, X. (2012) · IEEE Transactions on Computational Biology and Bioinformatics · doi:10.1109/tcbb.2012.20 · Cited by 26
Dutta, P., & Saha, S. (2017) · Computers in Biology and Medicine · doi:10.1016/j.compbiomed.2017.07.015 · Cited by 25
Matsuzaki, Y., Matsuzaki, Y., Sato, T., & Akiyama, Y. (2009) · Journal of Bioinformatics and Computational Biology · doi:10.1142/s0219720009004461 · Cited by 24
Cannistraci, C. V. (2018) · Scientific Reports · doi:10.1038/s41598-018-33576-8 · Cited by 26
Yao, H., Guan, J., & Liu, T. (2020) · Journal of Bioinformatics and Computational Biology · doi:10.1142/s0219720020400107 · Cited by 23
Predicting gene essentiality in Caenorhabditis elegans by feature engineering and machine-learning
Campos, T. D. L., Korhonen, P. K., Sternberg, P. W., Gasser, R. B., & Young, N. D. (2020) · Computational and Structural Biotechnology Journal · doi:10.1016/j.csbj.2020.05.008 · Cited by 23
Zhang, W., Xue, X., Xie, C., Li, Y., Liu, J., Chen, H., & Li, G. (2021) · Interdisciplinary Sciences Computational Life Sciences · doi:10.1007/s12539-021-00426-7 · Cited by 23
Chung, S. S., Pandini, A., Annibale, A., Coolen, A. C. C., Thomas, N. S. B., & Fraternali, F. (2015) · Scientific Reports · doi:10.1038/srep08540 · Cited by 21
Completing sparse and disconnected protein-protein network by deep learning
Huang, L., Liao, L., & Wu, C. H. (2018) · BMC Bioinformatics · doi:10.1186/s12859-018-2112-7 · Cited by 21
Cluster-based assessment of protein-protein interaction confidence
Kamburov, A., Großmann, A., Herwig, R., & Stelzl, U. (2012) · BMC Bioinformatics · doi:10.1186/1471-2105-13-262 · Cited by 22
Exploring Overlapping Functional Units with Various Structure in Protein Interaction Networks
Zhang, X.-F., Dai, D., Ou-Yang, L., & Wu, M. (2012) · PLoS ONE · doi:10.1371/journal.pone.0043092 · Cited by 19
A New Method for Detecting Protein Complexes based on the Three Node Cliques
Zhang, W., & Zou, X. (2014) · IEEE Transactions on Computational Biology and Bioinformatics · doi:10.1109/tcbb.2014.2386314 · Cited by 20
Forward Individualized Medicine from Personal Genomes to Interactomes
Zhang, X., Kuivenhoven, J. A., & Groen, A. K. (2015) · Frontiers in Physiology · doi:10.3389/fphys.2015.00364 · Cited by 22
Devkota, K., Murphy, J. M., & Cowen, L. (2020) · Bioinformatics · doi:10.1093/bioinformatics/btaa459 · Cited by 20
Vamparys, L., Laurent, B., Carbone, A., & Sacquin‐Mora, S. (2016) · Proteins Structure Function and Bioinformatics · doi:10.1002/prot.25086 · Cited by 18
Wu, Z., Liao, Q., & Liu, B. (2020) · Briefings in Bioinformatics · doi:10.1093/bib/bbaa016 · Cited by 18
Zhu, Y., Zhang, X., Dai, D., & Wu, M. (2012) · IEEE Transactions on Computational Biology and Bioinformatics · doi:10.1109/tcbb.2012.164 · Cited by 17
Using Information Content for Expanding Human Protein Coding Gene Interaction Networks
Fechete, R. (2013) · Journal of Computer Science & Systems Biology · doi:10.4172/jcsb.1000102 · Cited by 18
Global Geometric Affinity for Revealing High Fidelity Protein Interaction Network
Fang, Y., Benjamin, W., Sun, M., & Ramani, K. (2011) · PLoS ONE · doi:10.1371/journal.pone.0019349 · Cited by 18
Alanis‐Lobato, G. (2015) · Frontiers in Genetics · doi:10.3389/fgene.2015.00296 · Cited by 19
Campos, T. D. L., Korhonen, P. K., Hofmann, A., Gasser, R. B., & Young, N. D. (2020) · NAR Genomics and Bioinformatics · doi:10.1093/nargab/lqaa051 · Cited by 18
Accurate multiple network alignment through context-sensitive random walk
Jeong, H., & Yoon, B.-J. (2015) · BMC Systems Biology · doi:10.1186/1752-0509-9-s1-s7 · Cited by 18
Identifying binary protein-protein interactions from affinity purification mass spectrometry data
Zhang, X.-F., Ou-Yang, L., Hu, X. T., & Dai, D. (2015) · BMC Genomics · doi:10.1186/s12864-015-1944-z · Cited by 17
Birlutiu, A., d’Alché–Buc, F., & Heskes, T. (2014) · IEEE Transactions on Computational Biology and Bioinformatics · doi:10.1109/tcbb.2014.2359441 · Cited by 17
Inference of protein-protein interaction networks from multiple heterogeneous data
Huang, L., Liao, L., & Wu, C. H. (2016) · EURASIP Journal on Bioinformatics and Systems Biology · doi:10.1186/s13637-016-0040-2 · Cited by 17
Prediction of comorbid diseases using weighted geometric embedding of human interactome
Akram, P., & Liao, L. (2019) · BMC Medical Genomics · doi:10.1186/s12920-019-0605-5 · Cited by 16
Das, J. K., Chakraborty, S., & Roy, S. (2021) · Journal of Biomedical Informatics · doi:10.1016/j.jbi.2021.103801 · Cited by 19
Lagarde, N., Carbone, A., & Sacquin‐Mora, S. (2018) · Proteins Structure Function and Bioinformatics · doi:10.1002/prot.25506 · Cited by 15
Fang, Y., Sun, M., Dai, G., & Ramain, K. (2015) · IEEE Transactions on Computational Biology and Bioinformatics · doi:10.1109/tcbb.2015.2456876 · Cited by 15
Randhawa, V., & Pathania, S. (2020) · Briefings in Functional Genomics · doi:10.1093/bfgp/elaa015 · Cited by 15
Prediction of Protein-Protein Interaction Strength Using Domain Features with Supervised Regression
Kamada, M., Sakuma, Y., Hayashida, M., & Akutsu, T. (2014) · The Scientific World JOURNAL · doi:10.1155/2014/240673 · Cited by 14
Assessment of high-confidence protein–protein interactome in yeast
Karagoz, K., & Arğa, K. Y. (2013) · Computational Biology and Chemistry · doi:10.1016/j.compbiolchem.2013.03.002 · Cited by 13
Optimisation of the coalescent hyperbolic embedding of complex networks
Kovács, B., & Palla, G. (2021) · Scientific Reports · doi:10.1038/s41598-021-87333-5 · Cited by 12
Review of multimer protein–protein interaction complex topology and structure prediction*
Sun, D., Liu, S., & Gong, X. (2020) · Chinese Physics B · doi:10.1088/1674-1056/abb659 · Cited by 11
Model-independent embedding of directed networks into Euclidean and hyperbolic spaces
Kovács, B., & Palla, G. (2023) · Communications Physics · doi:10.1038/s42005-023-01143-x · Cited by 13
An overlapping module identification method in protein-protein interaction networks
Wang, X., Li, L., & Cheng, Y. (2012) · BMC Bioinformatics · doi:10.1186/1471-2105-13-s7-s4 · Cited by 12
Reliability Maximization in Uncertain Graphs
Ke, X., Khan, A., Hasan, M. A., & Rezvansangsari, R. (2020) · IEEE Transactions on Knowledge and Data Engineering · doi:10.1109/tkde.2020.2987570 · Cited by 12
Metadata
- Authors
- Kuchaiev, O., Rašajski, M., Higham, D. J., & Pržulj, N.
- Affiliations
- University of California, Irvine (US)
- University of Strathclyde (GB)
- Corresponding author
- Pržulj, Nataša
- Venue
- PLoS Computational Biology
- Publisher
- Public Library of Science (PLoS)
- Published
- 2009-08-07
- Volume
- 5
- Issue
- 8
- Pages
- e1000454
- ISSN
- 1553-734X (ISSN-L)
- 1553-7358
- PMC
- PMC2711306
- OpenAlex
- W2050583899
- Cited by
- 180
- References
- 55
- Citations by year
- 2026: 1 · 2025: 4 · 2024: 4 · 2023: 7 · 2022: 9 · 2021: 11 · 2020: 13 · 2019: 10 · 2018: 9 · 2017: 8 · 2016: 11 · 2015: 18 · 2014: 13 · 2013: 17 · 2012: 24
- FWCI
- 6.03
- Type
- journal article
- Language
- en
- Open access
- gold
- doi.org
- Locations
- PLoS Computational Biology (publishedVersion, cc-by)
- PubMed Central (publishedVersion, cc-by)
- PubMed (publishedVersion)
- RePEc: Research Papers in Economics (submittedVersion)
- DOAJ (DOAJ: Directory of Open Access Journals) (submittedVersion, cc-by-sa)
- UCL Discovery (University College London) (submittedVersion)
- eScholarship (California Digital Library) (submittedVersion, cc-by)
- Figshare (submittedVersion, cc-by)
- Strathprints: The University of Strathclyde institutional repository (University of Strathclyde) (submittedVersion)
- Funders
- National Science Foundation (0644424, CAREER)
- Engineering and Physical Sciences Research Council (GR/S62383/01, EP/E049370/1)
- Topics
- Life Sciences › Biochemistry, Genetics and Molecular Biology › Molecular Biology › Bioinformatics and Genomic Networks
- Physical Sciences › Physics and Astronomy › Statistical and Nonlinear Physics › Complex Network Analysis Techniques
- Life Sciences › Biochemistry, Genetics and Molecular Biology › Molecular Biology › Gene Regulatory Network Analysis
- Keywords
- protein-protein interaction network, geometric graphs, interaction prediction, false positive interactions, BioGRID, Gene Ontology terms, HPRD
- MeSH terms
- Algorithms, Humans, Models, Biological, Proteins, ROC Curve, Sensitivity and Specificity, Reproducibility of Results, Signal Transduction, Computational Biology, Protein Interaction Mapping, Databases, Protein
About these checks
Registry, retraction, Cites and statistics results are computed, not judged, with one exception: a printed reference that no index lists is read once by a model before it counts as a citation error. Claims are extracted by a model and kept only when their quote appears verbatim in the text; each cited source is then checked, with a model’s help, for whether it says what the claim relies on. Those verdicts can be wrong — read the claim’s quote and the cited source before relying on one.
Statistics and arithmetic are recomputed, not judged.
Confidence bands are shown only for fields calibrated on our annotated test set. None is calibrated yet, so no band is shown.
What counts as a claim ›How we measure confidence ›How we check this ›
Are you an author, or do you see a problem with this page? Request a review
