

The DOI matches its Crossref record; 61 of the 61 references it cites were found in a registry or an index.
Dynamics and Control of Diseases in Networks with Community Structure
Open accessAbstract
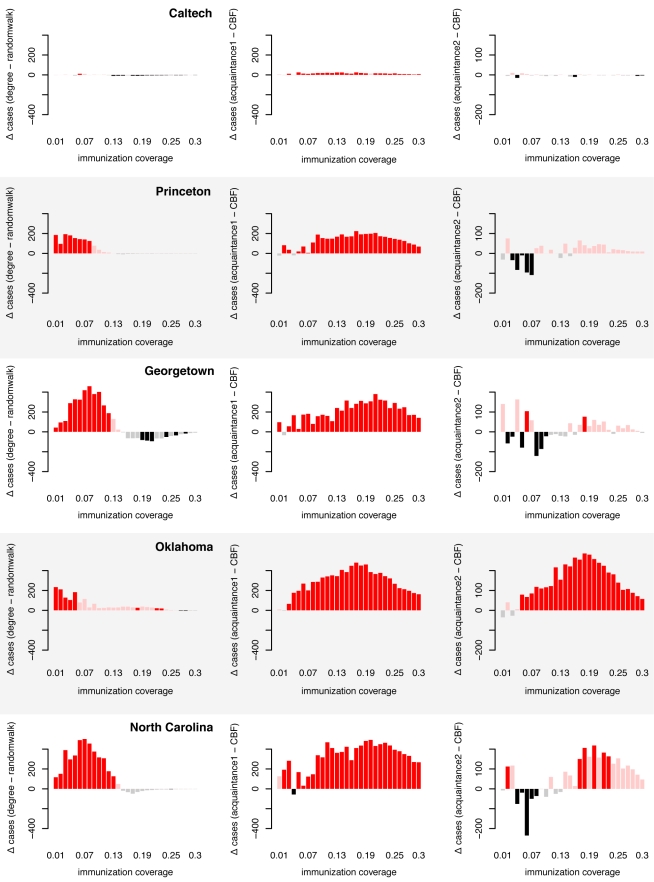
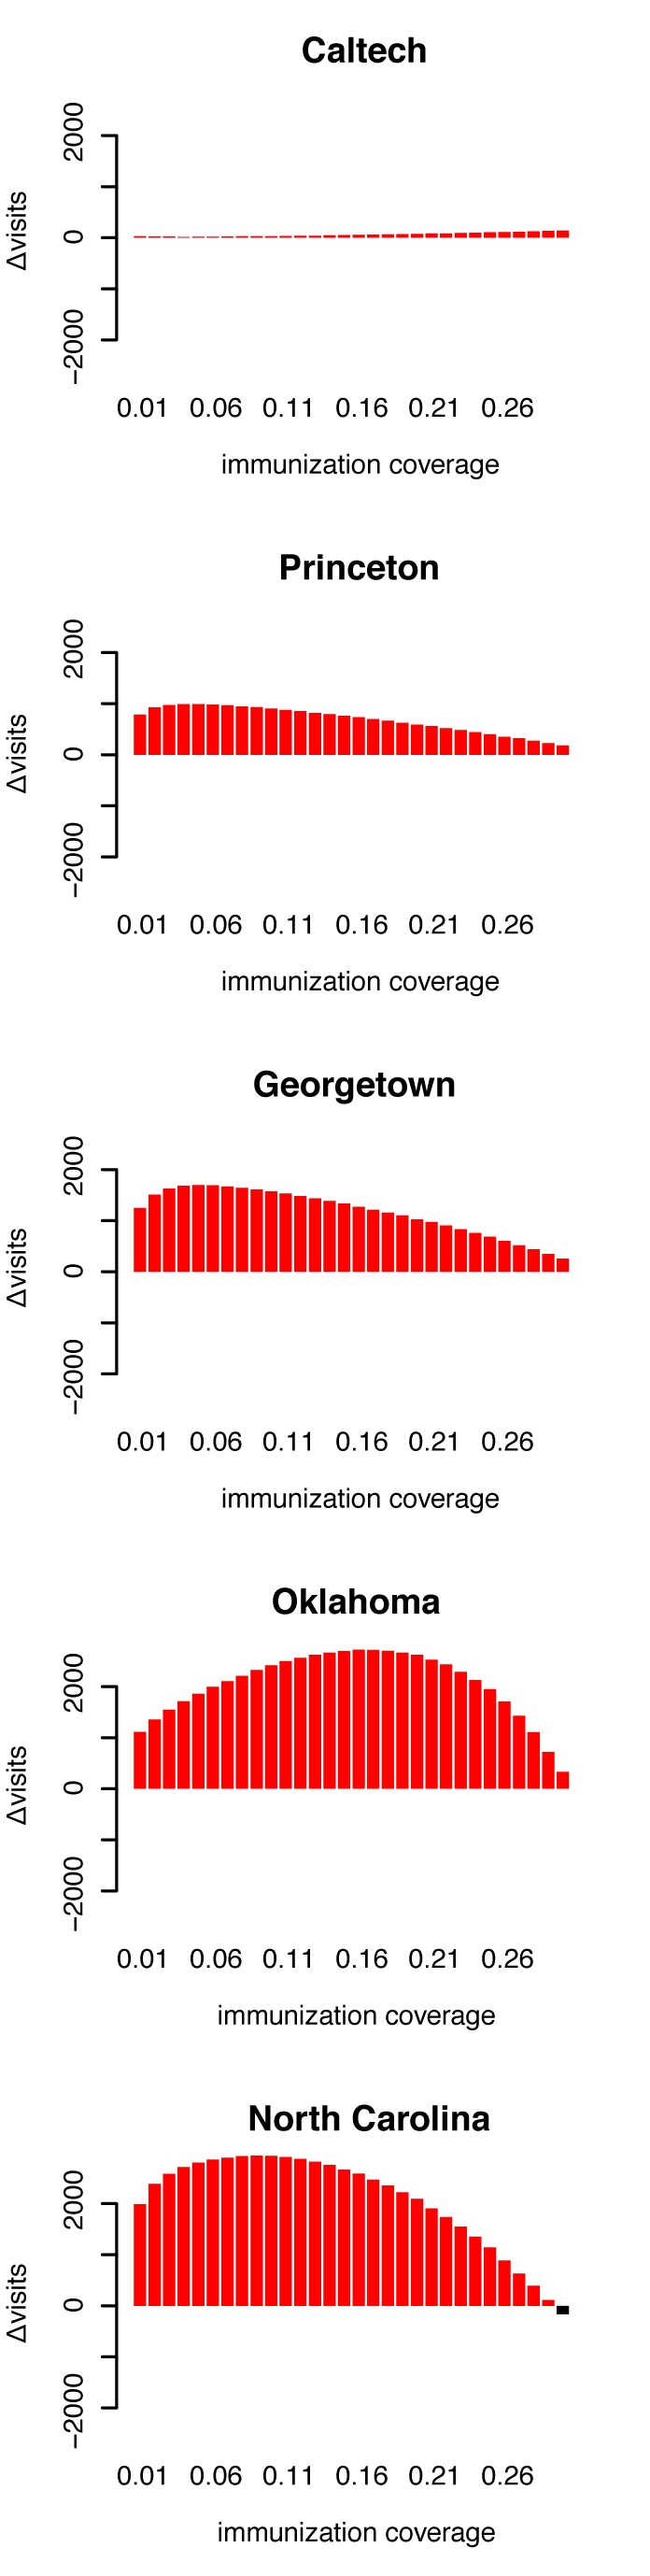
The dynamics of infectious diseases spread via direct person-to-person transmission (such as influenza, smallpox, HIV/AIDS, etc.) depends on the underlying host contact network. Human contact networks exhibit strong community structure. Understanding how such community structure affects epidemics may provide insights for preventing the spread of disease between communities by changing the structure of the contact network through pharmaceutical or non-pharmaceutical interventions. We use empirical and simulated networks to investigate the spread of disease in networks with community structure. We find that community structure has a major impact on disease dynamics, and we show that in networks with strong community structure, immunization interventions targeted at individuals bridging communities are more effective than those simply targeting highly connected individuals. Because the structure of relevant contact networks is generally not known, and vaccine supply is often limited, there is great need for efficient vaccination algorithms that do not require full knowledge of the network. We developed an algorithm that acts only on locally available network information and is able to quickly identify targets for successful immunization intervention. The algorithm generally outperforms existing algorithms when vaccine supply is limited, particularly in networks with strong community structure. Understanding the spread of infectious diseases and designing optimal control strategies is a major goal of public health. Social networks show marked patterns of community structure, and our results, based on empirical and simulated data, demonstrate that community structure strongly affects disease dynamics. These results have implications for the design of control strategies.
Overview
The claims and statistics of this paper haven’t been checked yet.
Run the check — free, no account needed. It reads the open-access text and checks the sources it cites.
Integrity signals
Registry
Cites
Statistics
Figures
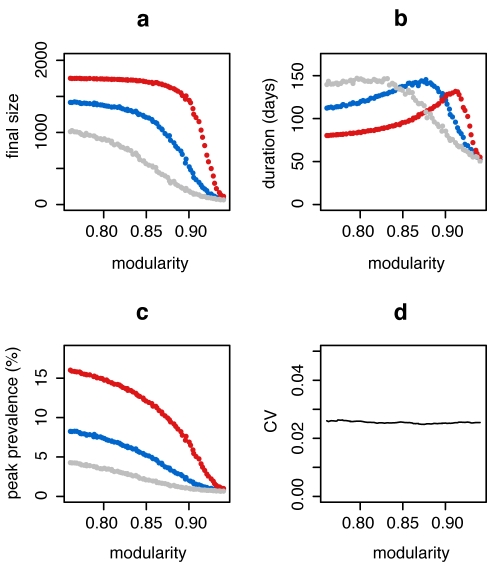
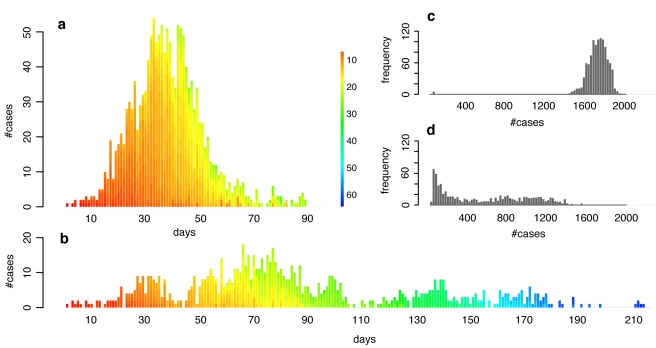
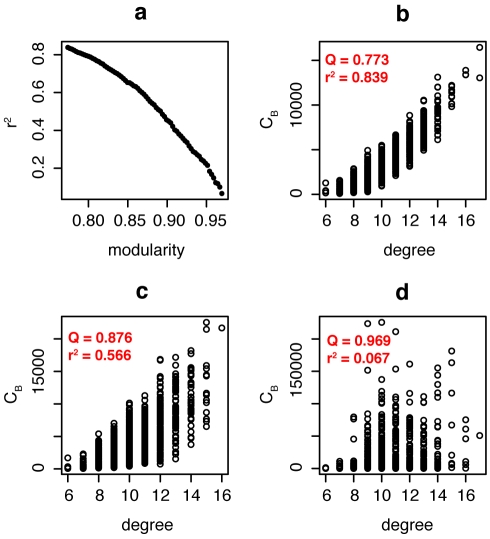
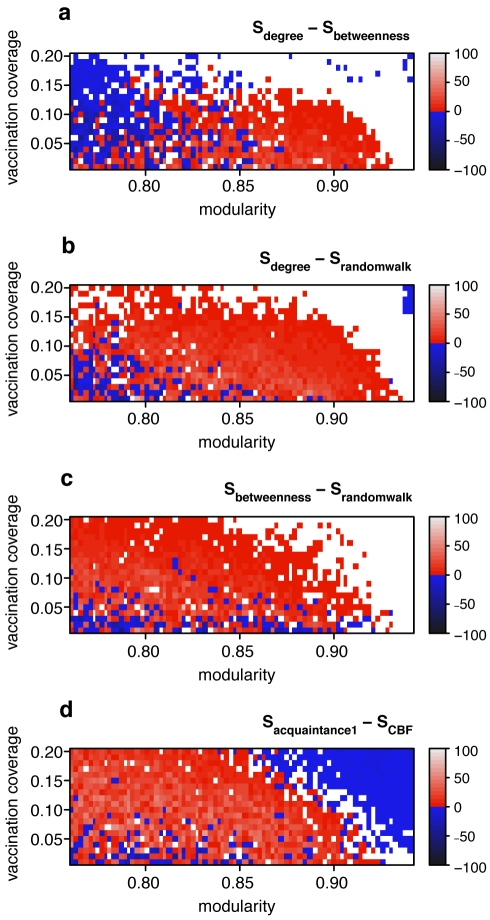
Verification
Claims the paper makes
The claims and statistics of this paper haven’t been checked yet.
Run the check — free, no account needed. It reads the open-access text and checks the sources it cites.
Claims other papers make about this one
Each is checked against this paper’s own text: does it say what the citing paper says it does?
The cited source says what the claim attributes to it.
In the citing paper
“When a population is organised in this fashion the capacity of epidemics to spread is reduced (Keeling 1999; Salathe ´ & Jones 2010).”
From Parasite-stress promotes in-group assortative sociality: The cases of strong family ties and heightened religiosity (2012) · cites this paper as Salathé & Jones 2010
Self-check
Percentages, sums and reported differences re-computed from the paper’s own numbers.
The self-check needs the paper’s full text.
Citations
Cites
Collective dynamics of ‘small-world’ networks
Watts, D. J., & Strogatz, S. H. (1998) · Nature · doi:10.1038/30918 · Cited by 43,060
Social Network Analysis: Methods and Applications
Wasserman, S. S., & Faust, K. (1994) · Cited by 18,005
Centrality in social networks conceptual clarification
Freeman, L. C. (1978) · Social Networks · doi:10.1016/0378-8733(78)90021-7 · Cited by 17,062
Community structure in social and biological networks
Girvan, M., & Newman, M. E. J. (2002) · Proceedings of the National Academy of Sciences · doi:10.1073/pnas.122653799 · Cited by 15,502
Finding and evaluating community structure in networks
Newman, M. E. J., & Girvan, M. (2004) · Physical Review E · doi:10.1103/physreve.69.026113 · Cited by 13,931
Infectious Diseases of Humans: Dynamics and Control
(1992) · Annals of Internal Medicine · doi:10.7326/0003-4819-117-2-174_4 · Cited by 7,819
Error and attack tolerance of complex networks
Albert, R., Jeong, H., & Barabási, A.-L. (2000) · Nature · doi:10.1038/35019019 · Cited by 7,534
Error and attack tolerance of complex networksPreprint
Albert, R., Jeong, H., & Barabási, A.-Ĺ. (2000) · Cited by 6,554
Epidemic Spreading in Scale-Free Networks
Pastor‐Satorras, R., & Vespignani, A. (2001) · Physical Review Letters · doi:10.1103/physrevlett.86.3200 · Cited by 5,785
Uncovering the overlapping community structure of complex networks in nature and society
Palla, G., Derényi, I., Farkas, I., & Vicsek, T. (2005) · Nature · doi:10.1038/nature03607 · Cited by 5,373
Cited by
Sorted by citations
Items 401–500 of 585
A novel framework for community modeling and characterization in directed temporal networks
Bongiorno, C., Zino, L., & Rizzo, A. (2019) · Applied Network Science · doi:10.1007/s41109-019-0119-2 · Cited by 4
Characterising contact in disease outbreaks via a network model of spatial-temporal proximityPreprint
Myall, A., Peach, R. L., Wan, Y., Mookerjee, S., Jauneikaite, E., Bolt, F., Price, J. R., Davies, F., Weiße, A. Y., Holmes, A. H., et al. (2021) · medRxiv · doi:10.1101/2021.04.07.21254497 · Cited by 4
Evans, J., Silk, M. J., Boogert, N. J., & Hodgson, D. J. (2020) · doi:10.32942/osf.io/zvkgu · Cited by 4
Feedbacks between community lockdowns and vaccination incentives in epidemic dynamics
Dang, S., Ши, Л., Gosak, M., Hu, K., & Perc, M. (2026) · Physica A Statistical Mechanics and its Applications · doi:10.1016/j.physa.2026.131772 · Cited by 3
Patrick, S. M., Hugo, J. M., Sonnendecker, P. W., & Shirinde, J. (2024) · Frontiers in Environmental Science · doi:10.3389/fenvs.2024.1285352 · Cited by 3
A ranking method based on self-avoiding random walk in complex networks
Jie-Ming, D., Mingsheng, S., Cai, S., & Zhang, Y. (2015) · Acta Physica Sinica · doi:10.7498/aps.64.200501 · Cited by 3
Nagarajan, K., Palani, B., Basha, J., Jayabal, L., & Muniyandi, M. (2022) · Humanities and Social Sciences Communications · doi:10.1057/s41599-022-01191-8 · Cited by 3
Song, Y., & Yang, Q. (2024) · Journal of Theoretical Biology · doi:10.1016/j.jtbi.2024.111772 · Cited by 3
Epidemic spreading on community networks with heterogeneity considering higher-order interactions
Ma, J., Wang, P., & Lu, Z. (2024) · International Journal of Modern Physics C · doi:10.1142/s0129183124501870 · Cited by 3
Laker, P. R., Hoppitt, W., Weiss, M. N., & Madden, J. (2021) · Proceedings of the Royal Society B · doi:10.1098/rspb.2020.2614 · Cited by 3
Zareie, A., & Sakellariou, R. (2022) · Social Network Analysis and Mining · doi:10.1007/s13278-022-00953-1 · Cited by 3
Local immunization based on Degree-Community-Bridge-Find in heterogeneity community networks
Gong, K. (2014) · Advances in intelligent systems research/Advances in Intelligent Systems Research · doi:10.2991/lemcs-14.2014.56 · Cited by 3
Stochastic Models of Influenza Outbreaks on a College Campus
Bidari, S., & Goldwyn, E. E. (2019) · Letters in Biomathematics · doi:10.1080/23737867.2019.1618744 · Cited by 3
Makhija, N., & Satapathy, S. M. (2021) · International Journal of Systems Assurance Engineering and Management · doi:10.1007/s13198-020-01048-w · Cited by 3
The role of vegetables trade network in global epidemicsPreprint
Min, Y., Chang, J., Jin, X., Zhong, Y., & Ge, Y. (2011) · arXiv (Cornell University) · doi:10.48550/arxiv.1110.1724 · Cited by 3
Multi-Community Detection in Signed Graphs Using Quantum HardwarePreprint
Zahedinejad, E., Crawford, D., Adolphs, C. P. J., & Oberoi, J. S. (2019) · arXiv (Cornell University) · doi:10.48550/arxiv.1901.04873 · Cited by 3
SHIVIR - An Agent-Based Model to assess the transmission of COVID-19 in IndiaPreprint
Narassima, M. S., John, D., Anbuudayasankar, S. P., Jammy, G. R., Pant, R., & Choudhury, L. P. (2022) · medRxiv · doi:10.1101/2022.05.26.22275624 · Cited by 3
Architectural Immunity: ants alter their nest networks to fight epidemicsPreprint
Leckie, L., Andon, M. S., Bruce, K., & Stroeymeyt, N. (2024) · bioRxiv (Cold Spring Harbor Laboratory) · doi:10.1101/2024.08.30.610481 · Cited by 3
Social interactions among ants are impacted by food availability and group size
Guo, X., Hasenjager, M. J., Fefferman, N. H., & Pinter‐Wollman, N. (2024) · Biology Open · doi:10.1242/bio.060422 · Cited by 2
Influence of multiple spreaders through farthest first traversal
Ramrakhiyani, M., Tiwari, M., & Sunitha, V. (2024) · Applied Network Science · doi:10.1007/s41109-024-00676-6 · Cited by 2
Stability-optimization algorithms for the detection of community structure in networks
McKenzie, M. (2012) · Cited by 2
A community detection method based on K-shell
Wang, Y., Xu, L., & Wu, B. (2015) · IEEE International Conference on Big Data (BigData) · doi:10.1109/bigdata.2015.7364021 · Cited by 2
The transfer and transformation of collective network information in gene-matched networks
Kitsukawa, T., & Yagi, T. (2015) · Scientific Reports · doi:10.1038/srep14984 · Cited by 2
Critical phenomena of spreading dynamics on complex networks with diverse activity of nodes
Zhou, L., Lin, J., Wang, Y., Li, Y., & Miao, R. (2018) · Physica A Statistical Mechanics and its Applications · doi:10.1016/j.physa.2018.06.046 · Cited by 2
Silk, M. J. (2018) · Elsevier eBooks · doi:10.1016/b978-0-12-809633-8.90414-x · Cited by 2
Abdalla, M., & Anter, A. M. (2023) · Springer eBooks · doi:10.1007/978-3-031-45952-8_5 · Cited by 2
Temporal analysis of drifting hashtags in textual data streams: A graph-based application
Garcia, C. M., Britto, A. D. S., & Barddal, J. P. (2024) · Expert Systems with Applications · doi:10.1016/j.eswa.2024.125007 · Cited by 2
Wu, D., Hamilton, H., Jagrowski, L., Nazzal, D., & Steimle, L. N. (2024) · Socio-Economic Planning Sciences · doi:10.1016/j.seps.2024.101831 · Cited by 2
Topîrceanu, A. (2024) · Mathematics · doi:10.3390/math12172765 · Cited by 3
An introduction to generative network models and their use in animal sociality research
Brask, J. B., Silk, M. J., & Weiss, M. N. (2025) · Animal Behaviour · doi:10.1016/j.anbehav.2025.123364 · Cited by 5
An immunization strategy for community networks based on local structural information
Zhang, D., Meng, X., & Sheng, J. (2026) · Social Network Analysis and Mining · doi:10.1007/s13278-025-01549-1 · Cited by 2
Biotechnological Approaches to Improve Sustainable Milk and Meat Yield in Bovines
Castillo, C., Abuelo, Á., & Hernandez, J. (2022) · Elsevier eBooks · doi:10.1016/b978-0-12-823960-5.00070-6 · Cited by 2
Bennett, L., Lysenko, A., Papageorgiou, L. G., Urban, M., Hammond-Kosack, K. E., Rawlings, C., Saqi, M. A. S., & Tsoka, S. (2012) · Lecture notes in computer science · doi:10.1007/978-3-642-33636-2_6 · Cited by 2
Multi-Coaffiliation Networks and Public Health Applications
Loza, O., Gomez-Lopez, I., & Mikler, A. R. (2012) · GSTF Journal of BioSciences · doi:10.5176/2251-3140_2.1.32 · Cited by 2
Complex social contagion makes networks more vulnerable to disease
Salathé, M. (2013) · Cited by 2
Self-citationCommunicative Competence: Computational Simulation Approach to Public Emergency Management
Zhong, W. (2012) · Cited by 2
Deep Generative Modeling in Network Science with Applications to Public Policy Research
Hartnett, G. S., Vardavas, R., Baker, L., Chaykowsky, M., Gibson, C. B., Girosi, F., Kennedy, D. P., & Osoba, O. (2020) · RAND Corporation eBooks · doi:10.7249/wra843-1 · Cited by 2
Controlling infectious disease outbreak in a community using a new technique
Movahedi, F. (2021) · Journal of Interdisciplinary Mathematics · doi:10.1080/09720502.2021.1932856 · Cited by 2
Stochastic Models of Influenza Outbreaks on a College Campus
Bidari, S., & Goldwyn, E. E. (2019) · Letters in Biomathematics · doi:10.30707/lib6.2bidari · Cited by 2
Interconnected Evolution of Epidemic and Public Vaccination Opinion
Leonidov, A. V., Vasilyev, S., & Vasilyeva, E. (2022) · Journal of Experimental and Theoretical Physics Letters · doi:10.1134/s0021364022602172 · Cited by 2
A foot and mouth disease ranking of risk using cattle transportation
Moreno, F., Galvis, J. C., & Gómez, F. A. (2023) · PLoS ONE · doi:10.1371/journal.pone.0284180 · Cited by 2
Towards a Scalable Parallel Infomap Algorithm for Community Detection
Santos, G. G., Lakhotia, K., & Rose, C. A. F. D. (2024) · Euromicro International Conference on Parallel, Distributed and Network-Based Processing (PDP) · doi:10.1109/pdp62718.2024.00023 · Cited by 2
Stochastic simulation control of epidemic propagation on networks
Bodó, Á., & Šimon, P. (2018) · Electronic journal of qualitative theory of differential equations · doi:10.14232/ejqtde.2018.1.41 · Cited by 2
Review of the network risk propagation research
Cui, B., Le, M., & Zhu, J. (2019) · Aeronautics and Aerospace Open Access Journal · doi:10.15406/aaoaj.2019.03.00082 · Cited by 2
Network-Based Analysis of Early Pandemic Mitigation Strategies: Solutions, and Future Directions
Hozhabrierdi, P., Zhu, R., Onyewu, M., & Soundarajan, S. (2021) · Northeast Journal of Complex Systems · doi:10.22191/nejcs/vol3/iss1/3 · Cited by 2
Characterising Livestock System Zoonoses Hotspots
Kleczkowski, A., Breed, A. C., Matthews, L., Thronicker, D., & de, V. F. (2012) · Stirling Online Research Repository (University of Stirling) · Cited by 2
Diffusion in Networks With Overlapping Community StructurePreprint
Reid, F., & Hurley, N. (2011) · arXiv (Cornell University) · doi:10.48550/arxiv.1105.5849 · Cited by 2
Financial Bridges and Network CommunitiesPreprint
Casarin, R., Costola, M., & Yenerdag, E. (2018) · SSRN Electronic Journal · doi:10.2139/ssrn.3178053 · Cited by 2
A survey on modelling of infectious disease spread and control on social contact networksPreprint
Shahzamal, & Khan, S. F. (2021) · arXiv (Cornell University) · doi:10.48550/arxiv.2102.02768 · Cited by 2
Effective vaccination strategy using graph neural network ansatzPreprint
Jhun, B. (2021) · arXiv (Cornell University) · doi:10.48550/arxiv.2111.00920 · Cited by 2
Statistical modelling of blood flow and transport in brain micro-vascular networks
Goirand, F. (2021) · theses.fr (ABES) · doi:10.70675/fe984905zc014z4590z9ebez258704f735b1 · Cited by 2
Cost effective campaigning in social networks
Kotnis, B., & Joy Kuri, B. (2016) · Physica A Statistical Mechanics and its Applications · doi:10.1016/j.physa.2015.12.127 · Cited by 1
Voelkl, B. (2020) · Mathematical biosciences and engineering : MBE · doi:10.3934/mbe.2020271 · Cited by 1
Alarid‐Escudero, F., Andrews, J. R., & Goldhaber‐Fiebert, J. D. (2023) · Medical Decision Making · doi:10.1177/0272989x231205565 · Cited by 1
Adapting InfoMap to Absorbing Random Walks Using Absorption-Scaled Graphs
Bernal, E. V., Porter, M. A., & Tien, J. H. (2024) · SIAM Journal on Applied Dynamical Systems · doi:10.1137/21m1466803 · Cited by 1
Network analysis of farmed Atlantic salmon movements in British Columbia, Canada
Raquib, A., Hammell, K. L., Sánchez, J., O’Brien, N., & Thakur, K. K. (2025) · Frontiers in Veterinary Science · doi:10.3389/fvets.2025.1568484 · Cited by 1
Pathania, N., Labus, B., & Arifuzzaman, S. (2025) · Social Network Analysis and Mining · doi:10.1007/s13278-025-01509-9 · Cited by 1
Alahmadi, S., Hoyle, R. B., Head, M., & Brede, M. (2025) · Applied Network Science · doi:10.1007/s41109-025-00718-7 · Cited by 1
Analysing Disease Spread on Complex Networks Using Forman–Ricci Curvature
Sowole, O. S., Bragazzi, N. L., & Lyakurwa, G. A. (2025) · Mathematics · doi:10.3390/math13233742 · Cited by 1
Comparing prevention strategies for pathogen control in heterogeneous surface touch networks
Hao, Z., Zhang, N., Li, C., Tang, J., Xiao, S., & Li, Y. (2025) · Building and Environment · doi:10.1016/j.buildenv.2025.113865 · Cited by 1
A Bayesian Framework for the Network Analysis of Transmission Dynamics in Infectious Disease
Xu, J., Kim, J., Ji, P., Yu, L., Whalen, C. C., & Liu, L. (2026) · Journal of Molecular Evolution · doi:10.1007/s00239-026-10303-w · Cited by 1
A new framework for measuring community diversity in temporal ecological networks
Ghalmane, Z., Poncelet, P., Interdonato, R., Ienco, D., Carbonara, P., Cau, A., Esteban, A., Farriols, M. T., Follesa, M. C., García‐Ruíz, C., et al. (2026) · Ecological Informatics · doi:10.1016/j.ecoinf.2026.103716 · Cited by 1
Al‐Amery, A., Al-qudah, R., Herrera-Diestra, J., & Ertem, M. Z. (2026) · PLOS Global Public Health · doi:10.1371/journal.pgph.0005584 · Cited by 1
Modeling Epidemic Risk Perception in Networks with Community Structure
Bagnoli, F., Borkmann, D., Guazzini, A., Massaro, E., & Rudolph, S. (2014) · Lecture notes of the Institute for Computer Sciences, Social Informatics and Telecommunications Engineering · doi:10.1007/978-3-319-06944-9_20 · Cited by 1
Understanding the Fundamental Roles of Momentum and Vorticity Injections in Flow Control
Taira, K., Munday, P., & Nair, A. (2016) · Cited by 1
Geovisual analytics approaches for the integration of geography and social network contexts
Luo, W. P. (2014) · Cited by 1
KOVİD-19 PANDEMİ SÜRECİNİN DEĞERLENDİRİLMESİNDE SOSYAL AĞ ANALİZİNİN KULLANIMI
UNUTULMAZ, S., & Dulupçu, M. A. (2020) · Türkiye Mesleki ve Sosyal Bilimler Dergisi · doi:10.46236/jovosst.790127 · Cited by 1
Methods and Directions of Contact Tracing in Epidemic Discovery
Abdalla, M., AbdelAziz, A. M., Alarabi, L., Basalamah, S. M., & Hendawi, A. (2022) · International Journal of Advanced Computer Science and Applications · doi:10.14569/ijacsa.2022.0130698 · Cited by 1
Tian, T., & Zhao, N. (2023) · Journal of Information Science · doi:10.1177/01655515231161523 · Cited by 2
Flattening the Curve Through Reinforcement Learning Driven Test and Trace Policies
Rusu, A. C., Farrahi, K., & Niranjan, M. (2023) · Lecture notes of the Institute for Computer Sciences, Social Informatics and Telecommunications Engineering · doi:10.1007/978-3-031-34586-9_14 · Cited by 1
Demystify Epidemic Containment in Directed Networks: Theory and Algorithms
He, Y., Chen, C., Wang, S., Min, G., & Li, J. (2025) · ACM International Conference on Web Search and Data Mining (WSDM) · doi:10.1145/3701551.3703575 · Cited by 1
Towards Merging Models of Information Spreading and Dynamic Phenomena in Social Networks
Stattner, E., Collard, M., & Vidot, N. (2013) · Communications in computer and information science · doi:10.1007/978-3-642-35879-1_62 · Cited by 1
MIXING PATTERNS AMONG EPIDEMIC GROUPS
Kamp, C. (2011) · Advances in Complex Systems · doi:10.1142/s0219525911003177 · Cited by 1
Weighted Immunization Strategy on Real Networks
Zhao, J. L., Wang, S., Zhou, Z., & Zhou, Z. (2016) · National Conference on Electrical, Electronics and Computer Engineering (NCEECE) · doi:10.2991/nceece-15.2016.123 · Cited by 1
EpCom: A parallel community detection approach for epidemic diffusion over social networks
Zhang, H., Zhang, L., Da, C., Wu, Y., & Zhao, C. (2017) · IEEE International Conference on Bioinformatics and Biomedicine (BIBM) · doi:10.1109/bibm.2017.8217900 · Cited by 1
Information Propagation in Social Networks with Overlapping Community Structure
Zhao, N., & Liu, X. (2017) · KSII Transactions on Internet and Information Systems · doi:10.3837/tiis.2017.12.013 · Cited by 1
Generalization of effective conductance centrality for egonetworks
Shakeri, H., Moradi-Jamei, B., Poggi‐Corradini, P., Albin, N., & Scoglio, C. (2018) · Physica A Statistical Mechanics and its Applications · doi:10.1016/j.physa.2018.07.039 · Cited by 1
The Target Recovery Strategy for Preventing Avalanche Breakdown on Interdependent Community Networks
Gong, K., Huang, Y., Chen, X., Li, Q., & Tang, M. (2020) · Complexity · doi:10.1155/2020/1646930 · Cited by 1
Identifying Important Nodes in Bio-Molecular Networks
Lü, J., & Wang, P. (2020) · Springer eBooks · doi:10.1007/978-981-15-9144-0_7 · Cited by 1
ComMit: Blind Community-based Early Mitigation Strategy against Viral Spread
Hozhabrierdi, P., & Soundarajan, S. (2022) · IEEE/ACM International Conference on Advances in Social Networks Analysis and Mining (ASONAM) · doi:10.1109/asonam55673.2022.10068568 · Cited by 1
Collective Behavior in Community-Structured Network and Epidemic Dynamics
Jain, K., Bhatnagar, V., & Kaur, S. (2023) · Lecture notes in electrical engineering · doi:10.1007/978-981-19-9090-8_16 · Cited by 1
Diffusion in Complex Networks With Overlapping Community StructurePreprint
Reid, F., & Hurley, N. (2011) · arXiv (Cornell University) · Cited by 1
Caracterização de circuitos pecuários com base em redes de movimentação de animais
Filho, J. H. D. H. E. G. (2012) · doi:10.11606/t.10.2012.tde-24042014-075742 · Cited by 1
Modeling Risk Perception in Networks with Community StructurePreprint
Bagnoli, F., Borkmann, D., Guazzini, A., Massaro, E., & Rudolph, S. (2012) · arXiv (Cornell University) · doi:10.48550/arxiv.1212.0657 · Cited by 1
Controlling endemic disease in cattle populations: current challenges and future opportunities
Gates, M. C. (2014) · ERA · Cited by 1
Walsh, P. D. (2013) · doi:10.1002/9781118520178.ch24 · Cited by 1
Network structure indexes to forecast epidemic spreading in real-world complex networksPreprint
Bellingeri, M., Bevacqua, D., Turchetto, M., Scotognella, F., Alfieri, R., Nguyen, N.-K.-K., Le, T. T., Nguyen, Q., & Cassi, D. (2022) · Research Square · doi:10.21203/rs.3.rs-1764529/v1 · Cited by 1
Epidemic Spread on Patch Networks with Community StructurePreprint
Lieberthal, B. A., Soliman, A., Wang, S., Urioste-Stone, S. M. D., & Gardner, A. M. (2022) · SSRN Electronic Journal · doi:10.2139/ssrn.4193855 · Cited by 1
Social interactions are impacted by food availability, food type, and group sizePreprint
Guo, X., Hasenjager, M. J., Fefferman, N. H., & Pinter‐Wollman, N. (2024) · bioRxiv (Cold Spring Harbor Laboratory) · doi:10.1101/2024.03.07.584014 · Cited by 1
Nekkab, N. (2018) · theses.fr (ABES) · doi:10.70675/159d64a6z8e3dz412ez8e59zcfb82a33182a · Cited by 1
Ordered and continuous community structure in networksPreprint
Gregory, S. (2011) · arXiv (Cornell University)
Paulson, K. R. (2015) · SCARAB (Bates College)
Editor's introduction : Six themes of 'six degrees'
Schnettler, S. (2013)
Various epidemic models on complex networks
Fu, X., SMALL, M. P., & Chen, G. (2014) · doi:10.1002/9781118762783.ch2
Correction: Metapopulation Dynamics Enable Persistence of Influenza A, Including A/H5N1, in Poultry
Hosseini, P. R., Fuller, T. L., Harrigan, R. J., Zhao, D., Arriola, C. S., Gonzalez, A. E., Miller, M. J., Xiao, X., Smith, T. B., Jones, J. H., et al. (2014) · PLoS ONE · doi:10.1371/annotation/4de9438b-646c-4efd-bf12-62a9baa301e2
Self-citationFísica de los Sistemas Complejos Socio-Tecnológicos
Díaz-Guilera, A., Miguel, M. S., & Sánchez, Á. (2014) · Dialnet (Universidad de la Rioja)
Pluciński, M. M. (2012) · eScholarship (California Digital Library)
Metadata
- Authors
- Salathé, M., & Jones, J. H.
- Affiliations
- Stanford University (US)
- Corresponding author
- Salathé, Marcel
- Venue
- PLoS Computational Biology
- Publisher
- Public Library of Science (PLoS)
- Published
- 2010-04-08
- Volume
- 6
- Issue
- 4
- Pages
- e1000736
- ISSN
- 1553-734X (ISSN-L)
- 1553-7358
- PMC
- PMC2851561
- OpenAlex
- W2010965902
- Cited by
- 586
- References
- 61
- Citations by year
- 2026: 18 · 2025: 27 · 2024: 34 · 2023: 32 · 2022: 33 · 2021: 50 · 2020: 42 · 2019: 36 · 2018: 53 · 2017: 33 · 2016: 41 · 2015: 44 · 2014: 39 · 2013: 37 · 2012: 36
- FWCI
- 23.57
- Type
- journal article
- Language
- en
- Open access
- gold
- doi.org
- Locations
- PLoS Computational Biology (publishedVersion, cc-by)
- PubMed Central (publishedVersion, cc-by)
- PubMed (publishedVersion)
- Infoscience (Ecole Polytechnique Fédérale de Lausanne) (submittedVersion, cc-by-nc-nd)
- RePEc: Research Papers in Economics (submittedVersion)
- DOAJ (DOAJ: Directory of Open Access Journals) (submittedVersion, cc-by-sa)
- Figshare (submittedVersion, cc-by)
- Infoscience (Ecole Polytechnique Fédérale de Lausanne) (submittedVersion)
- Funders
- National Science Foundation (0619926)
- National Institutes of Health
- National Institute of General Medical Sciences (GM28016, R01GM028016)
- Eunice Kennedy Shriver National Institute of Child Health and Human Development (K01HD051494, K01HD51494)
- Topics
- Physical Sciences › Physics and Astronomy › Statistical and Nonlinear Physics › Complex Network Analysis Techniques
- Physical Sciences › Mathematics › Applied Mathematics › Mathematical and Theoretical Epidemiology and Ecology Models
- Physical Sciences › Mathematics › Modeling and Simulation › COVID-19 epidemiological studies
- Keywords
- disease transmission, community structure, contact networks, epidemic dynamics, vaccination strategies, bridge nodes, limited vaccine supply, disease control, social networks
- MeSH terms
- Algorithms, Computer Simulation, Disease Outbreaks, Humans, Residence Characteristics, Stochastic Processes, Vaccination, Incidence, Databases, Factual, Community-Acquired Infections, Disease Transmission, Infectious, Computational Biology, Host-Pathogen Interactions
About these checks
Registry, retraction, Cites and statistics results are computed, not judged, with one exception: a printed reference that no index lists is read once by a model before it counts as a citation error. Claims are extracted by a model and kept only when their quote appears verbatim in the text; each cited source is then checked, with a model’s help, for whether it says what the claim relies on. Those verdicts can be wrong — read the claim’s quote and the cited source before relying on one.
Statistics and arithmetic are recomputed, not judged.
Confidence bands are shown only for fields calibrated on our annotated test set. None is calibrated yet, so no band is shown.
What counts as a claim ›How we measure confidence ›How we check this ›
Are you an author, or do you see a problem with this page? Request a review
