Student or educator? Sign up with your school email and get 6 months of Pro free.
Cited by 67

The DOI matches its Crossref record; 65 of the 65 references it cites were found in a registry or an index.

Transition state characteristics during cell differentiation

Brackston, Rowan D., Lakatos, Eszter, Stumpf, Michael P. H.·2018·PLOS Computational Biology

Published version of a preprint

Abstract

Models describing the process of stem-cell differentiation are plentiful, and may offer insights into the underlying mechanisms and experimentally observed behaviour. Waddington's epigenetic landscape has been providing a conceptual framework for differentiation processes since its inception. It also allows, however, for detailed mathematical and quantitative analyses, as the landscape can, at least in principle, be related to mathematical models of dynamical systems. Here we focus on a set of dynamical systems features that are intimately linked to cell differentiation, by considering exemplar dynamical models that capture important aspects of stem cell differentiation dynamics. These models allow us to map the paths that cells take through gene expression space as they move from one fate to another, e.g. from a stem-cell to a more specialized cell type. Our analysis highlights the role of the transition state (TS) that separates distinct cell fates, and how the nature of the TS changes as the underlying landscape changes-change that can be induced by e.g. cellular signaling. We demonstrate that models for stem cell differentiation may be interpreted in terms of either a static or transitory landscape. For the static case the TS represents a particular transcriptional profile that all cells approach during differentiation. Alternatively, the TS may refer to the commonly observed period of heterogeneity as cells undergo stochastic transitions.

Overview

The claims and statistics of this paper haven’t been checked yet.

Run the check — free, no account needed. It reads the open-access text and checks the sources it cites.

A few free checks a day · papers already verified open instantly · results are public

Integrity signals

Registry

Crossref · 10.1371/journal.pcbi.1006405

Cites

65 of 65 references verified0 citation errors · 0 not checkable

Statistics

Figures

Fig 1 The two-dimensional SDE model. (A) surface plot of the potential field U; (B) the vector field decomposed into the gradient (black) and curl (white) components; (C) the two-dimensional histogram generated from a long-run simulation of the system; (D) The minimum action paths (MAP) between stationary points Xi. On exit from an attractor the MAP follows a path X˙=∇U+fU, before following a “free fall” path back towards a stationary point.
Fig 1 The two-dimensional SDE model. (A) surface plot of the potential field U; (B) the vector field decomposed into the gradient (black) and curl (white) components; (C) the two-dimensional histogram generated from a long-run simulation of the system; (D) The minimum action paths (MAP) between stationary points Xi. On exit from an attractor the MAP follows a path X˙=∇U+fU, before following a “free fall” path back towards a stationary point.CC BY · PubMed Central
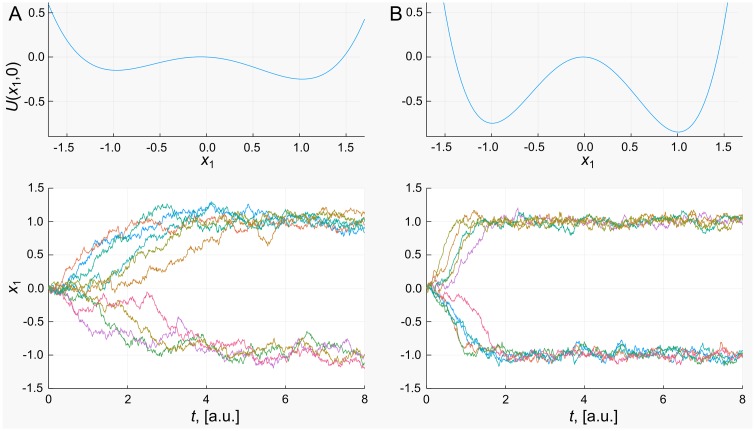
Fig 2 Influence of eigenvalues. Slice through the potential and example trajectories away from the transition state under different model parameters: (A) small positive eigenvalue (α = 0.4); (B) large positive eigenvalue (α = 1.6). For a larger positive eigenvalue the wells of the system are deeper and the curvature is greater, leading to more rapid movement away from the transition state.
Fig 2 Influence of eigenvalues. Slice through the potential and example trajectories away from the transition state under different model parameters: (A) small positive eigenvalue (α = 0.4); (B) large positive eigenvalue (α = 1.6). For a larger positive eigenvalue the wells of the system are deeper and the curvature is greater, leading to more rapid movement away from the transition state.CC BY · PubMed Central
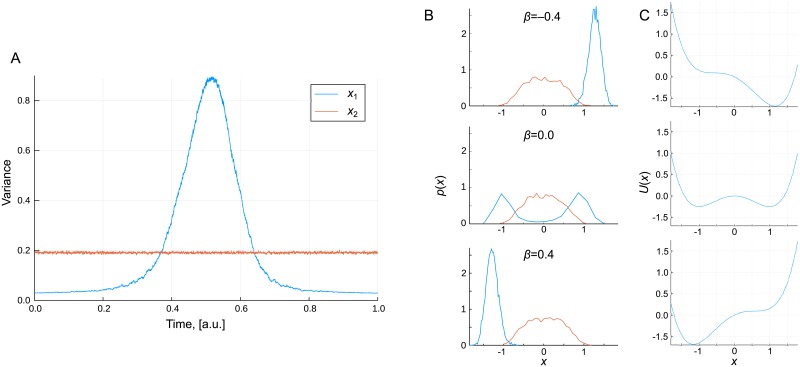
Fig 3 The transition state in a transitory landscape. (A) The variance of the two states across 5000 simulations in which β is linearly varied with time; (B) Probability distributions of the two states at three different values of β; (C) The potential U at each of the three values of β. The high variance “transition state” corresponds to intermediate values of β in which significant bistability generates large heterogeneity.
Fig 3 The transition state in a transitory landscape. (A) The variance of the two states across 5000 simulations in which β is linearly varied with time; (B) Probability distributions of the two states at three different values of β; (C) The potential U at each of the three values of β. The high variance “transition state” corresponds to intermediate values of β in which significant bistability generates large heterogeneity.CC BY · PubMed Central
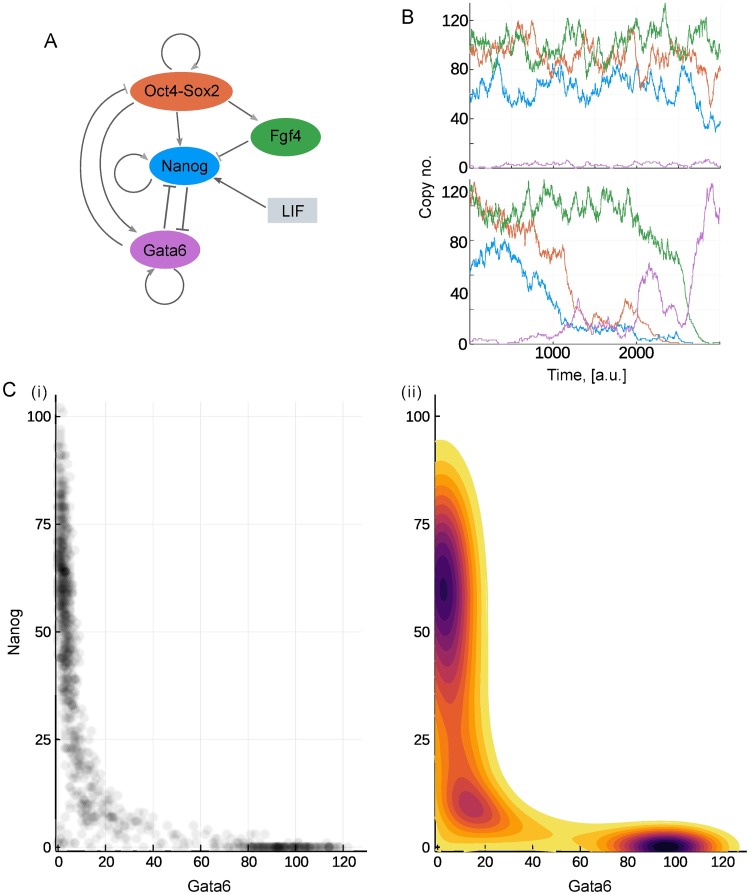
Fig 4 Potential landscape of the stem cell differentiation model. (A) Schematics of the stem cell differentiation model. (B) Simulated example of a cell that stays pluripotent (upper axes) and a cell undergoing differentiation (lower axes). The abundance of each species is indicated by a line coloured according to the filled ovals in (A). (C) Probability distribution and landscape of the system with L = 50. (i) Scatter plot of the whole population on the Gata6-Nanog plane. (ii) The landscape computed as the negative logarithm of the probability distribution.
Fig 4 Potential landscape of the stem cell differentiation model. (A) Schematics of the stem cell differentiation model. (B) Simulated example of a cell that stays pluripotent (upper axes) and a cell undergoing differentiation (lower axes). The abundance of each species is indicated by a line coloured according to the filled ovals in (A). (C) Probability distribution and landscape of the system with L = 50. (i) Scatter plot of the whole population on the Gata6-Nanog plane. (ii) The landscape computed as the negative logarithm of the probability distribution.CC BY · PubMed Central
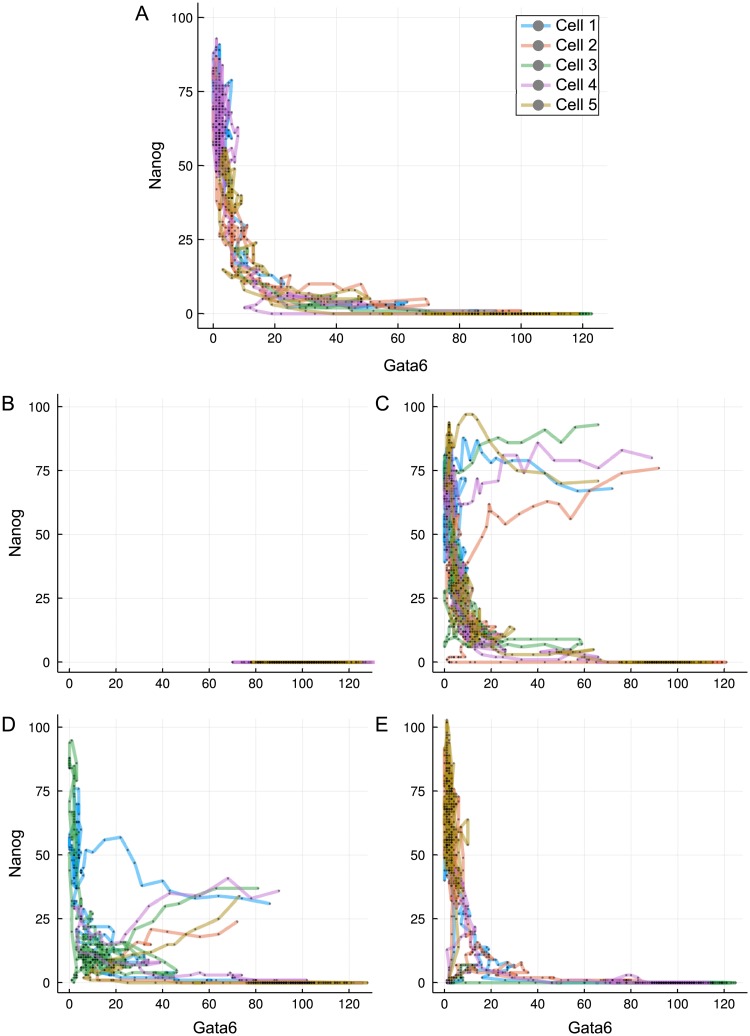
Fig 5 Transition paths during differentiation. (A) Trajectories of five randomly selected stem cells after reduction in LIF concentration (L = 0), plotted on the Gata6-Nanog phase space. (B) Cells started from the differentiated state and put into L = 200. (C-D) Cells started from the unexplored region of high Gata6 and high Nanog (C) or low Nanog (D) levels for L = 0. (E) Trajectories started from the transition state under L = 50. Different line colours denote different cells, as indicated in the legend.
Fig 5 Transition paths during differentiation. (A) Trajectories of five randomly selected stem cells after reduction in LIF concentration (L = 0), plotted on the Gata6-Nanog phase space. (B) Cells started from the differentiated state and put into L = 200. (C-D) Cells started from the unexplored region of high Gata6 and high Nanog (C) or low Nanog (D) levels for L = 0. (E) Trajectories started from the transition state under L = 50. Different line colours denote different cells, as indicated in the legend.CC BY · PubMed Central
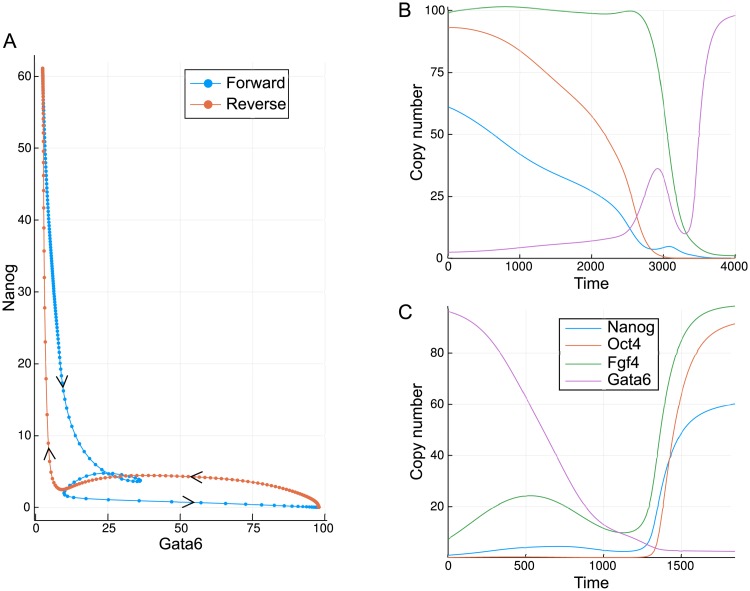
Fig 6 Minimum action paths for the developmental model. (A) A comparison of the paths plotted in the Gata6, Nanog plane; (B) Time series for each of the molecular species in the forward direction; (C) Time series for each of the molecular species in the reverse direction.
Fig 6 Minimum action paths for the developmental model. (A) A comparison of the paths plotted in the Gata6, Nanog plane; (B) Time series for each of the molecular species in the forward direction; (C) Time series for each of the molecular species in the reverse direction.CC BY · PubMed Central
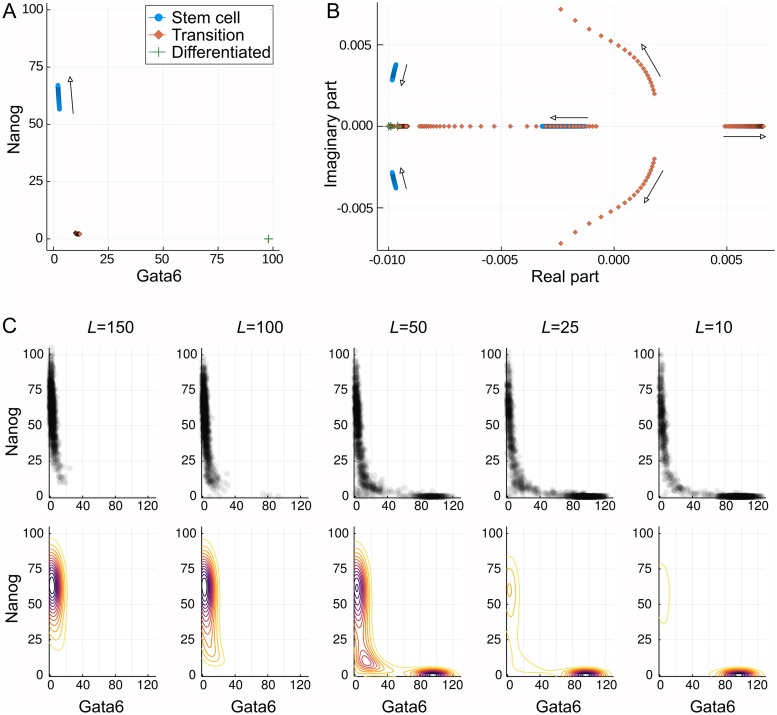
Fig 7 Varying behaviour of the system with LIF concentration, L. (A) Three of the fixed points of the model with increasing L. The differentiated and transition state remain unchanged while the stem cell state moves to higher Nanog values. (B) The eigenvalues of the Jacobian at each of the three fixed points as L increases. The stem cell state becomes locally more stable, as indicated by the increasingly negative eigenvalues. The transition state becomes increasingly unstable, thereby making transition to this state less probable. The differentiated state is unaffected, but is seen to be locally more stable than the stem cell state. Complex eigenvalues are associated with rotational “curl” dynamics. (C) Variation of the probabilistic landscape. Upper plots show a sample of the sampled points while lower plots show the landscapes. As L decreases the valley at the differentiated state becomes deeper while that at the stem cell state becomes shallower. At intermediate values the landscape is flatter around the transition state.
Fig 7 Varying behaviour of the system with LIF concentration, L. (A) Three of the fixed points of the model with increasing L. The differentiated and transition state remain unchanged while the stem cell state moves to higher Nanog values. (B) The eigenvalues of the Jacobian at each of the three fixed points as L increases. The stem cell state becomes locally more stable, as indicated by the increasingly negative eigenvalues. The transition state becomes increasingly unstable, thereby making transition to this state less probable. The differentiated state is unaffected, but is seen to be locally more stable than the stem cell state. Complex eigenvalues are associated with rotational “curl” dynamics. (C) Variation of the probabilistic landscape. Upper plots show a sample of the sampled points while lower plots show the landscapes. As L decreases the valley at the differentiated state becomes deeper while that at the stem cell state becomes shallower. At intermediate values the landscape is flatter around the transition state.CC BY · PubMed Central
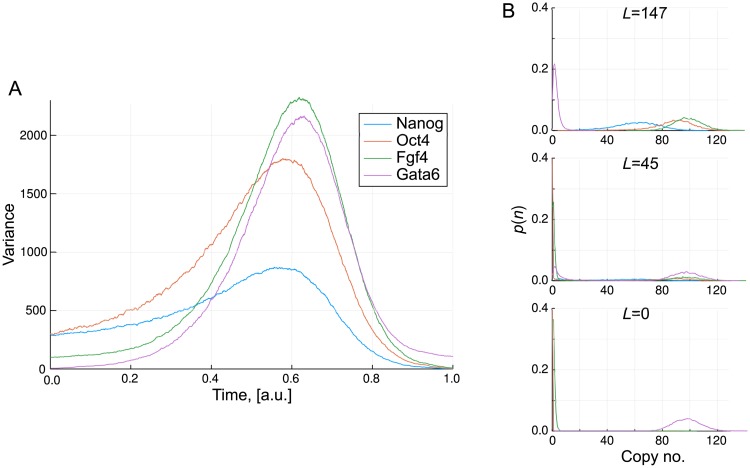
Fig 8 The transition state in a transitory landscape. (A) The variance of the transcription levels across 10,000 simulations in which L is linearly decreased with time as L = 150(1 − t); (B) Probability distributions of the transcription levels at three different values of L. The high variance “transition state” corresponds to intermediate values of L at which transitions from the stem cell to differentiated state begin to occur.
Fig 8 The transition state in a transitory landscape. (A) The variance of the transcription levels across 10,000 simulations in which L is linearly decreased with time as L = 150(1 − t); (B) Probability distributions of the transcription levels at three different values of L. The high variance “transition state” corresponds to intermediate values of L at which transitions from the stem cell to differentiated state begin to occur.CC BY · PubMed Central
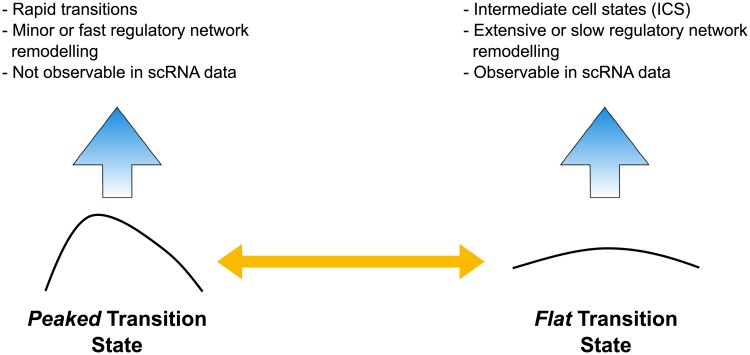
Fig 9 Relationship between transition state and observable data. The landscape curvature around the TS affects the time cells will spend in the vicinity of the TS, and reflects the molecular processes driving differentiation.
Fig 9 Relationship between transition state and observable data. The landscape curvature around the TS affects the time cells will spend in the vicinity of the TS, and reflects the molecular processes driving differentiation.CC BY · PubMed Central

Verification

Claims the paper makes

The claims and statistics of this paper haven’t been checked yet.

Run the check — free, no account needed. It reads the open-access text and checks the sources it cites.

A few free checks a day · papers already verified open instantly · results are public

Claims other papers make about this one

Each is checked against this paper’s own text: does it say what the citing paper says it does?

Self-check

Percentages, sums and reported differences re-computed from the paper’s own numbers.

The self-check needs the paper’s full text.

Citations

Cites

Show all 65 references

Research works printed but not linked: 2

  1. Brackston RD, Wynn A, Stumpf MPH. Construction of quasi-potentials for stochastic dynamical systems: An optimization approach. arXiv:1805.07273. 2018;. · DOI
  2. CW Gardiner, 2009, Springer series in synergetics

Cited by

Metadata

Authors
Brackston, R. D., Lakatos, E., & Stumpf, M. P. H.
Venue
PLOS Computational Biology
Published
2018-09-20
Volume
14
Issue
9
Pages
e1006405
ISSN
1553-7358
Cited by
67
References
65
Language
en
Funders
  • Biotechnology and Biological Sciences Research Council (BB/G020434/1)
  • Imperial College London (Schrödinger Fellowship)

About these checks

Registry, retraction, Cites and statistics results are computed, not judged, with one exception: a printed reference that no index lists is read once by a model before it counts as a citation error. Claims are extracted by a model and kept only when their quote appears verbatim in the text; each cited source is then checked, with a model’s help, for whether it says what the claim relies on. Those verdicts can be wrong — read the claim’s quote and the cited source before relying on one.

Statistics and arithmetic are recomputed, not judged.

Confidence bands are shown only for fields calibrated on our annotated test set. None is calibrated yet, so no band is shown.

What counts as a claim ›How we measure confidence ›How we check this ›

Are you an author, or do you see a problem with this page? Request a review

Data sources

Bibliographic data: Semantic Scholar, OpenAlex, Crossref.

Contains information from the Semantic Scholar Academic Graph Datasets, made available under the ODC Attribution License (ODC-BY 1.0).

Semantic Scholar’s data is described in: Kinney, R., et al. (2023). The Semantic Scholar Open Data Platform. arXiv:2301.10140.