

The DOI matches its Crossref record; 56 of the 56 references it cites were found in a registry or an index.
SPEACH_AF: Sampling protein ensembles and conformational heterogeneity with Alphafold2
Open accessPublished version of a preprint
Abstract
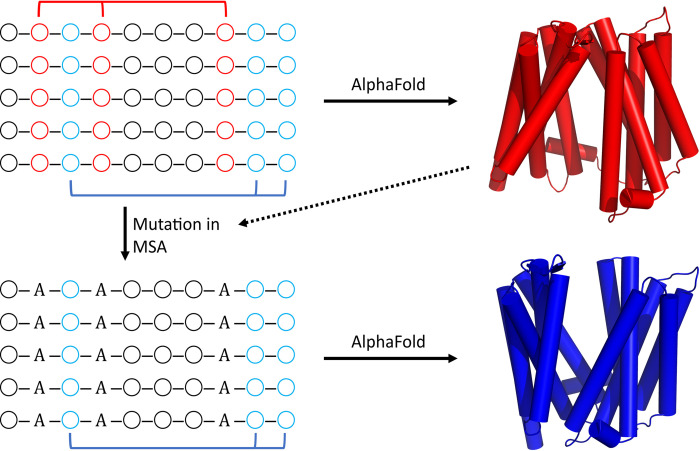
The unprecedented performance of Deepmind's Alphafold2 in predicting protein structure in CASP XIV and the creation of a database of structures for multiple proteomes and protein sequence repositories is reshaping structural biology. However, because this database returns a single structure, it brought into question Alphafold's ability to capture the intrinsic conformational flexibility of proteins. Here we present a general approach to drive Alphafold2 to model alternate protein conformations through simple manipulation of the multiple sequence alignment via in silico mutagenesis. The approach is grounded in the hypothesis that the multiple sequence alignment must also encode for protein structural heterogeneity, thus its rational manipulation will enable Alphafold2 to sample alternate conformations. A systematic modeling pipeline is benchmarked against canonical examples of protein conformational flexibility and applied to interrogate the conformational landscape of membrane proteins. This work broadens the applicability of Alphafold2 by generating multiple protein conformations to be tested biologically, biochemically, biophysically, and for use in structure-based drug design.
Overview
The claims and statistics of this paper haven’t been checked yet.
Run the check — free, no account needed. It reads the open-access text and checks the sources it cites.
Integrity signals
Registry
Cites
Statistics
Figures
Verification
Claims the paper makes
The claims and statistics of this paper haven’t been checked yet.
Run the check — free, no account needed. It reads the open-access text and checks the sources it cites.
Claims other papers make about this one
Each is checked against this paper’s own text: does it say what the citing paper says it does?
In the citing paper
“follow-up studies suggest that the tool has potential for generation of biologically relevant ensembles,266”
From Advancing Targeted Protein Degradation via Multiomics Profiling and Artificial Intelligence (2023) · cites this paper as [266]
Self-check
Percentages, sums and reported differences re-computed from the paper’s own numbers.
The self-check needs the paper’s full text.
Citations
Cites
Highly accurate protein structure prediction with AlphaFold
Jumper, J., Evans, R., Pritzel, A., Green, T., Figurnov, M., Ronneberger, O., Tunyasuvunakool, K., Bates, R., Žídek, A., Potapenko, A., et al. (2021) · Nature · doi:10.1038/s41586-021-03819-2 · Cited by 43,764
The PyMOL Molecular Graphics System
DeLano, W. L. (2002) · Medical Entomology and Zoology · Cited by 18,147
A method and server for predicting damaging missense mutations.
Adzhubei, I. A., Schmidt, S., Peshkin, L., Ramensky, V. E., Gerasimova, A., Bork, P., Kondrashov, A. S., & Sunyaev, S. R. (2010) · Nature Methods · doi:10.1038/nmeth0410-248 · Cited by 13,194
Database resources of the National Center for Biotechnology Information: update
Wheeler, D. L. (2003) · Nucleic Acids Research · doi:10.1093/nar/gkh073 · Cited by 10,695
ColabFold - Making protein folding accessible to all
Mirdita, M., Schütze, K., Moriwaki, Y., Heo, L., Ovchinnikov, S., & Steinegger, M. (2021) · doi:10.1101/2021.08.15.456425 · Cited by 9,391
Principles that Govern the Folding of Protein Chains
Anfinsen, C. B. (1973) · Science · doi:10.1126/science.181.4096.223 · Cited by 7,096
SIFT: predicting amino acid changes that affect protein function
Ng, P. C. (2003) · Nucleic Acids Research · doi:10.1093/nar/gkg509 · Cited by 6,601
Database resources of the National Center for Biotechnology Information
Agarwala, R., Barrett, T., Beck, J., Benson, D., Bollin, C., Bolton, E. E., Bourexis, D., Brister, J., Bryant, S. H., Canese, K., et al. (2017) · Nucleic Acids Res. · doi:10.1093/nar/gkx1095 · Cited by 6,277
A general framework for estimating the relative pathogenicity of human genetic variants
Kircher, M., Witten, D. M., Jain, P., O'Roak, B. J., Cooper, G. M., & Shendure, J. (2014) · Nature Genetics · doi:10.1038/ng.2892 · Cited by 6,183
MolProbity: More and better reference data for improved all‐atom structure validation
Williams, C. J., Headd, J. J., Moriarty, N. W., Prisant, M. G., Videau, L. L., Deis, L. N., Verma, V., Keedy, D. A., Hintze, B. J., Chen, V. B., et al. (2018) · Protein Science · doi:10.1002/pro.3330 · Cited by 4,599
Research works printed but not linked: 1
- Sergey Ovchinnikov UA [@sokrypton], 2021, In AF_advanced colabfold we suggest enabling dropout (is_training = True), and iterating through seeds to sample from the uncertainty. This should theoretically return multiple conformations if there is any ambiguity in coevolution, w/o the need to resample/subsample the MSA (1/3): https://t.co/MUtee9xIaX, In: Twitter
Cited by
Sorted by citations
From nature to industry: Harnessing enzymes for biocatalysis
Buller, R., Lutz, S., Kazlauskas, R. J., Šnajdrová, R., Moore, J. C., & Bornscheuer, U. T. (2023) · Science · doi:10.1126/science.adh8615 · Cited by 759
Predicting multiple conformations via sequence clustering and AlphaFold2
Wayment-Steele, H. K., Ojoawo, A., Otten, R., Apitz, J. M., Pitsawong, W., Hömberger, M., Ovchinnikov, S., Colwell, L., & Kern, D. (2024) · Nature · doi:10.1038/s41586-023-06832-9 · Cited by 545
Terwilliger, T. C., Liebschner, D., Croll, T. I., Williams, C. J., McCoy, A. J., Poon, B. K., Afonine, P. V., Oeffner, R. D., Richardson, J. S., Read, R. J., et al. (2024) · Nature Methods · doi:10.1038/s41592-023-02087-4 · Cited by 411
Systematic identification of conditionally folded intrinsically disordered regions by AlphaFold2
Alderson, T. R., Pritišanac, I., Kolarić, Đ., Moses, A. M., & Forman-Kay, J. D. (2023) · Proceedings of the National Academy of Sciences · doi:10.1073/pnas.2304302120 · Cited by 240
Modeling conformational states of proteins with AlphaFold
Sala, D., Engelberger, F., Mchaourab, H. S., & Meiler, J. (2023) · Current Opinion in Structural Biology · doi:10.1016/j.sbi.2023.102645 · Cited by 182
Self-citation
Metadata
- Authors
- Stein, R. A., & Mchaourab, H. S.
- Affiliations
- Vanderbilt University (US)
- Corresponding author
- Stein, Richard A.
- Venue
- PLOS Computational Biology
- Publisher
- Public Library of Science (PLoS)
- Published
- 2022-08-22
- Volume
- 18
- Issue
- 8
- Pages
- e1010483
- ISSN
- 1553-734X (ISSN-L)
- 1553-7358
- PMC
- PMC9436118
- OpenAlex
- W4292636432
- Cited by
- 258
- References
- 52
- Citations by year
- 2026: 55 · 2025: 64 · 2024: 76 · 2023: 51 · 2022: 12
- FWCI
- 16.65
- Type
- journal article
- Language
- en
- Update notices
- new_version (2022-09-01)
- Open access
- gold
- doi.org
- Licence
- Locations
- PLoS Computational Biology (publishedVersion, cc-by)
- bioRxiv (Cold Spring Harbor Laboratory) (acceptedVersion, cc-by-nd)
- PubMed Central (publishedVersion, cc-by)
- PubMed (publishedVersion)
- RePEc: Research Papers in Economics (submittedVersion)
- DOAJ (DOAJ: Directory of Open Access Journals) (submittedVersion, cc-by-sa)
- Funders
- National Institutes of Health (GM128087, GM077659)
- Topics
- Life Sciences › Biochemistry, Genetics and Molecular Biology › Molecular Biology › Protein Structure and Dynamics
- Life Sciences › Biochemistry, Genetics and Molecular Biology › Structural Biology › Enzyme Structure and Function
- Life Sciences › Biochemistry, Genetics and Molecular Biology › Molecular Biology › Machine Learning in Bioinformatics
- Keywords
- AlphaFold2, protein conformational heterogeneity, protein ensembles, multiple sequence alignment, in silico mutagenesis, protein flexibility, membrane proteins, conformational landscape, structure-based drug design, protein structure prediction
- MeSH terms
- Amino Acid Sequence, Protein Conformation, Proteins, Drug Design, Sequence Alignment
About these checks
Registry, retraction, Cites and statistics results are computed, not judged, with one exception: a printed reference that no index lists is read once by a model before it counts as a citation error. Claims are extracted by a model and kept only when their quote appears verbatim in the text; each cited source is then checked, with a model’s help, for whether it says what the claim relies on. Those verdicts can be wrong — read the claim’s quote and the cited source before relying on one.
Statistics and arithmetic are recomputed, not judged.
Confidence bands are shown only for fields calibrated on our annotated test set. None is calibrated yet, so no band is shown.
What counts as a claim ›How we measure confidence ›How we check this ›
Are you an author, or do you see a problem with this page? Request a review
