

The DOI matches its Crossref record.
Global patterns in human mitochondrial DNA and Y-chromosome variation caused by spatial instability of the local cultural processes.
Overview
The claims and statistics of this paper haven’t been checked yet.
Run the check — free, no account needed. It reads the open-access text and checks the sources it cites.
Integrity signals
Registry
Cites
Statistics
Figures
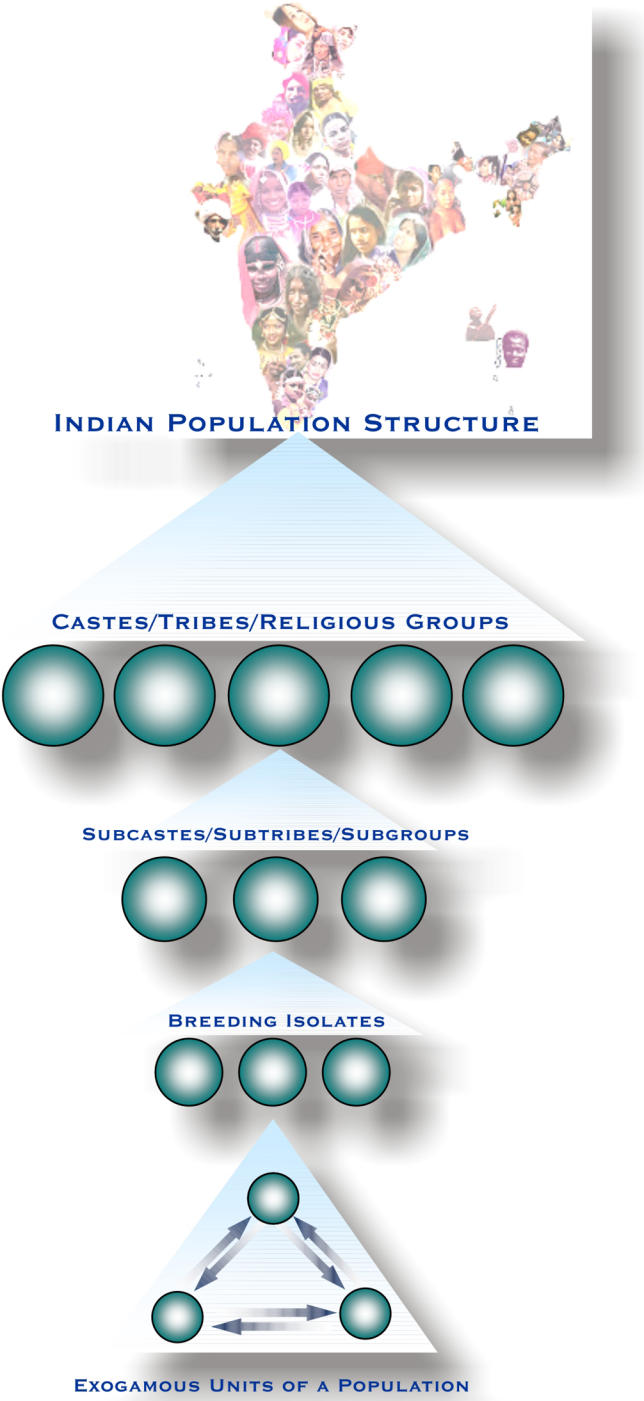
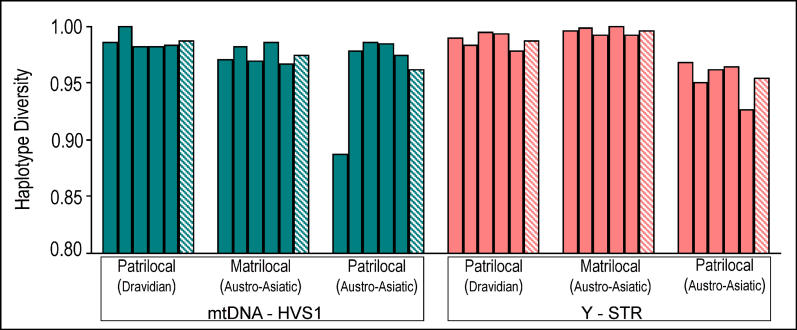
Verification
Claims the paper makes
The claims and statistics of this paper haven’t been checked yet.
Run the check — free, no account needed. It reads the open-access text and checks the sources it cites.
Claims other papers make about this one
Each is checked against this paper’s own text: does it say what the citing paper says it does?
In the citing paper
“For example, it was observed that in patrilocal and matrilocal Indian populations, where migrations are strictly confined within endogamous groups, sex-specific patterns were not influenced by post-marital residence [21].”
From Sex-Specific Genetic Structure and Social Organization in Central Asia: Insights from a Multi-Locus Study (2008) · cites this paper as [21]
In the citing paper
“The apparent paradox between local and global trends can be resolved though, since the geographical clustering of populations with potentially different lifestyles may minimize the differences in sex-specific demography at a global scale [21],[22].”
From Sex-Specific Genetic Structure and Social Organization in Central Asia: Insights from a Multi-Locus Study (2008) · cites this paper as [21]
In the citing paper
“Our results also illustrate the importance of analyzing human populations at a local scale, rather than global or even continental scale [2],[19],[21].”
From Sex-Specific Genetic Structure and Social Organization in Central Asia: Insights from a Multi-Locus Study (2008) · cites this paper as [21]
Self-check
Percentages, sums and reported differences re-computed from the paper’s own numbers.
The self-check needs the paper’s full text.
Citations
Cites
No references could be resolved yet.
Research works printed but not linked: 20
- 1996, The genetics of traditional living. Y-chromosomal and mitochondrial lineages in the Sinai Peninsula., Am J Hum Genet, 59, 741
- 1998, Genetic evidence for a higher female migration rate in humans., Nat Genet, 20, 278, 10.1038/3088 · DOI · Paper page
- 1999, Sex-specific migration pattern in Central Asian populations, revealed by analysis of Y-chromosome short tandem repeats and mtDNA., Am J Hum Genet, 65, 208, 10.1086/302451 · DOI · Paper page
- 2002, Extreme mtDNA homogeneity in continental Asian populations., Am J Phys Anthrop, 118, 146, 10.1002/ajpa.10056 · DOI · Paper page
- 2001, Human mtDNA and Y-chromosome variation is correlated with matrilocal versus patrilocal residence., Nat Genet, 29, 20, 10.1038/ng711 · DOI · Paper page
- 2000, Autosomal, mtDNA, and Y-chromosome diversity in Amerinds: Pre- and post-Columbian patterns of gene flow in South America., Am J Hum Genet, 67, 1277
- 2003, Y-chromosome and mtDNA polymorphisms in Iraq, a crossroad of the early human dispersal and of post-Neolithic migrations., Mol Phylogenet Evol, 28, 458, 10.1016/S1055-7903(03)00039-3 · DOI
- 2003, Mitochondrial DNA diversity in South America and the genetic history of Andean highlanders., Mol Biol Evol, 20, 1682, 10.1093/molbev/msg188 · DOI
- 2004, Global patterns of human mitochondrial DNA and Y-chromosome structure are not influenced by higher migration rates of females versus males., Nat Genet, 36, 1122, 10.1038/ng1428 · DOI · Paper page
- 2003, Form of marriage, sexual division of labor, and postmarital residence in cross-cultural perspective: A reconsideration., J Anthropol Res, 59, 69, 10.1086/jar.59.1.3631445 · DOI
- 2004, Marital residence among foragers., Curr Anthropol, 45, 277, 10.1086/382256 · DOI · Paper page
- 1998, Social transmission of reproductive behavior increases frequency of inherited disorders in a young-expanding population., Proc Natl Acad Sci U S A, 95, 15140, 10.1073/pnas.95.25.15140 · DOI
- 1999, Why hunter-gatherer populations do not show signs of Pleistocene demographic expansions., Proc Natl Acad Sci U S A, 96, 10597, 10.1073/pnas.96.19.10597 · DOI
- 1996, Regions based on social structure., Curr Anthropol, 37, 87, 10.1086/204474 · DOI · Paper page
- 2001, Patterns of variation in a caste-cluster of Dhangars of Maharashtra, India., Coll Antropol, 25, 425
- 2004, Patterns of ethnic, linguistic, and geographic heterogeneity of palmar interdigital ridge counts in the Indian subcontinent., Hum Biol, 76, 211, 10.1353/hub.2004.0037 · DOI
- 1983, Accuracy of estimated phylogenetic trees from molecular data., J Mol Evol, 19, 153, 10.1007/BF02300753 · DOI
- NeiM 1987 Molecular evolutionary genetics New York Columbia University Press 333 p.
- 1995, A measure of population subdivision based on microsatellite allele frequencies., Genetics, 139, 457, 10.1093/genetics/139.1.457 · DOI
- 1995, Polynesian genetic affinities with Southeast Asian populations as identified by mtDNA analysis., Am J Hum Genet, 57, 403
Cited by
Ségurel, L., Martínez-Cruz, B., Quintana-Murci, L., Balaresque, P., Georges, M., Hegay, T., Aldashev, A., Nasyrova, F., Jobling, M. A., Heyer, E., et al. (2008) · PLoS Genetics · doi:10.1371/journal.pgen.1000200 · Cited by 95
Hrnčíř, V., Duda, P., Šaffa, G., Květina, P., & Zrzavý, J. (2020) · PLOS ONE · doi:10.1371/journal.pone.0229363 · Cited by 16
Metadata
- Authors
- Kumar, V., Langstieh, B. T., Madhavi, K. V., Naidu, V. M., Singh, H. P., Biswas, S., Thangaraj, K., Singh, L., & Reddy, B. M.
- Venue
- PLoS Genetics
- Publisher
- Public Library of Science (PLoS)
- Published
- 2006-04-14
- Volume
- 2
- Issue
- 4
- Pages
- e53
- ISSN
- 1553-7404
- PMC
- PMC1435684
- Cited by
- 41
- References
- 0
- Language
- en
- Update notices
- correction (2006-06-30)
About these checks
Registry, retraction, Cites and statistics results are computed, not judged, with one exception: a printed reference that no index lists is read once by a model before it counts as a citation error. Claims are extracted by a model and kept only when their quote appears verbatim in the text; each cited source is then checked, with a model’s help, for whether it says what the claim relies on. Those verdicts can be wrong — read the claim’s quote and the cited source before relying on one.
Statistics and arithmetic are recomputed, not judged.
Confidence bands are shown only for fields calibrated on our annotated test set. None is calibrated yet, so no band is shown.
What counts as a claim ›How we measure confidence ›How we check this ›
Are you an author, or do you see a problem with this page? Request a review
