

The DOI matches its Crossref record; 50 of the 52 references it cites were found in a registry or an index.
The Genetic Interpretation of Area under the ROC Curve in Genomic Profiling
Open accessAbstract
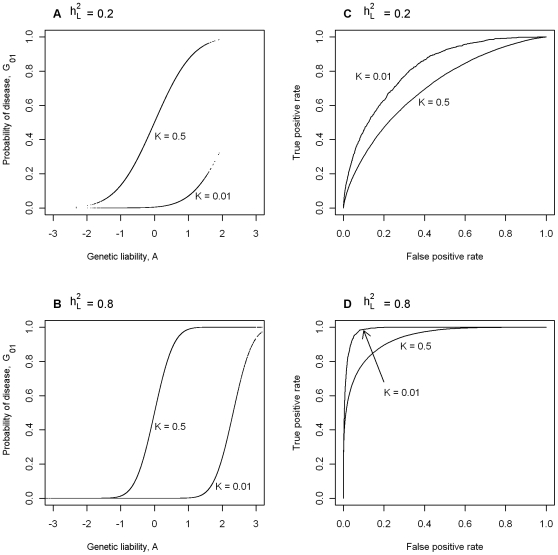
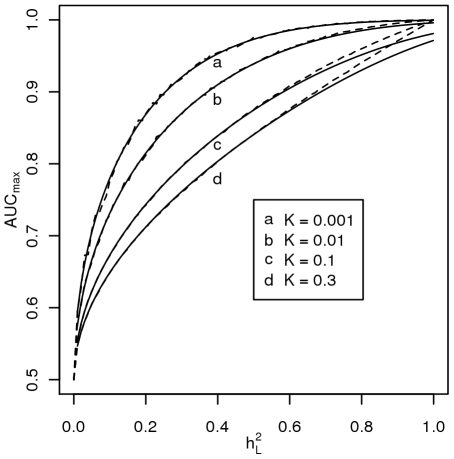
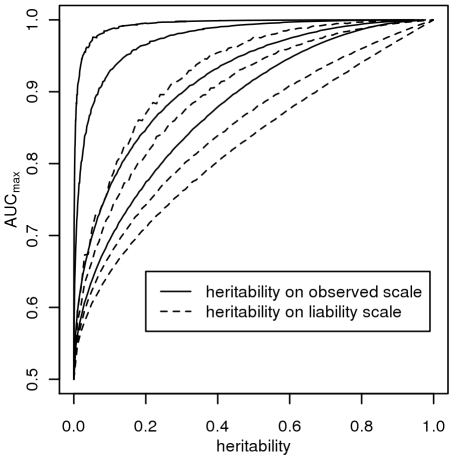
Genome-wide association studies in human populations have facilitated the creation of genomic profiles which combine the effects of many associated genetic variants to predict risk of disease. The area under the receiver operator characteristic (ROC) curve is a well established measure for determining the efficacy of tests in correctly classifying diseased and non-diseased individuals. We use quantitative genetics theory to provide insight into the genetic interpretation of the area under the ROC curve (AUC) when the test classifier is a predictor of genetic risk. Even when the proportion of genetic variance explained by the test is 100%, there is a maximum value for AUC that depends on the genetic epidemiology of the disease, i.e. either the sibling recurrence risk or heritability and disease prevalence. We derive an equation relating maximum AUC to heritability and disease prevalence. The expression can be reversed to calculate the proportion of genetic variance explained given AUC, disease prevalence, and heritability. We use published estimates of disease prevalence and sibling recurrence risk for 17 complex genetic diseases to calculate the proportion of genetic variance that a test must explain to achieve AUC = 0.75; this varied from 0.10 to 0.74. We provide a genetic interpretation of AUC for use with predictors of genetic risk based on genomic profiles. We provide a strategy to estimate proportion of genetic variance explained on the liability scale from estimates of AUC, disease prevalence, and heritability (or sibling recurrence risk) available as an online calculator.
Overview
The claims and statistics of this paper haven’t been checked yet.
Run the check — free, no account needed. It reads the open-access text and checks the sources it cites.
Integrity signals
Registry
Cites
Statistics
Figures
Verification
Claims the paper makes
The claims and statistics of this paper haven’t been checked yet.
Run the check — free, no account needed. It reads the open-access text and checks the sources it cites.
Claims other papers make about this one
Each is checked against this paper’s own text: does it say what the citing paper says it does?
In the citing paper
“Using LDSC on a meta-analysis of all 11 clinically-ascertained datasets from our GWAS and estimated the liability-scale heritability of PD as 0.22 (95% CI 0.18 – 0.26), only slightly lower than a previous estimate derived using GCTA (0.27, 95% CI 0.17 – 0.38) (2,16,30).”
From Identification of novel risk loci, causal insights, and heritable risk for Parkinson's disease: a meta-analysis of genome-wide association studies (2019) · cites this paper as [30]
In the citing paper
“Using equations from Wray et al. 2010 and our current heritability estimates, the 88 variant PRS explained a minimum 16% of the genetic liability of PD assuming a global prevalence of 0.5% (2,31).”
From Identification of novel risk loci, causal insights, and heritable risk for Parkinson's disease: a meta-analysis of genome-wide association studies (2019) · cites this paper as Wray et al. 2010
In the citing paper
“maximum potential AUC estimated at 85% using the equations from Wray et al. 2010”
From Identification of novel risk loci, causal insights, and heritable risk for Parkinson's disease: a meta-analysis of genome-wide association studies (2019) · cites this paper as Wray et al. 2010
Self-check
Percentages, sums and reported differences re-computed from the paper’s own numbers.
The self-check needs the paper’s full text.
Citations
Cites
The meaning and use of the area under a receiver operating characteristic (ROC) curve.
Hanley, J. A., & McNeil, B. J. (1982) · Radiology · doi:10.1148/radiology.143.1.7063747 · Cited by 21,856
Introduction to Quantitative Genetics.
Edwards, A. W. F., & Falconer, D. S. (1982) · Biometrics · doi:10.2307/2529912 · Cited by 21,447
Genome-wide association study of 14,000 cases of seven common diseases and 3,000 shared controls
The Wellcome Trust Case Control Consortium, Management Committee, Burton, P. R., Clayton, D. G., Cardon, L. R., Craddock, N., Deloukas, P., Duncanson, A., Kwiatkowski, D. P., McCarthy, M. I., et al. (2007) · Nature · doi:10.1038/nature05911 · Cited by 9,442
Genetics and Analysis of Quantitative Traits
(2002) · Journal of Animal Breeding and Genetics · doi:10.1046/j.1439-0388.2002.00356.x · Cited by 6,176
Basic principles of ROC analysis
Metz, C. E. (1978) · Seminars in Nuclear Medicine · doi:10.1016/s0001-2998(78)80014-2 · Cited by 6,122
Global variation in copy number in the human genome
Redon, R., Ishikawa, S., Fitch, K. R., Feuk, L., Perry, G. H., Andrews, T. D., Fiegler, H., Shapero, M. H., Carson, A. R., Chen, W., et al. (2006) · Nature · doi:10.1038/nature05329 · Cited by 4,377
Introduction to Quantitative Genetics
J.-M., G., & Falconer, D. S. (1962) · Population · doi:10.2307/1525780 · Cited by 3,773
Genetic Epidemiology of Major Depression: Review and Meta-Analysis
Sullivan, P. F., Neale, M. C., & Kendler, K. S. (2000) · American Journal of Psychiatry · doi:10.1176/appi.ajp.157.10.1552 · Cited by 3,431
ROCR: visualizing classifier performance in R
Sing, T., Sander, O., Beerenwinkel, N., & Lengauer, T. (2005) · Computer applications in the biosciences · doi:10.1093/bioinformatics/bti623 · Cited by 3,172
Introduction to quantitative genetics
Falconer, D. S. (1960) · Helmholtz Centre for Ocean Research Kiel (GEOMAR) · Cited by 3,170
Research works printed but not linked: 1
- M McGue, 1983, The transmission of schizophrenia under a multifactorial threshold model., American Journal of Human Genetics, 35, 1161
Cited by
Sorted by citations
Nalls, M. A., Blauwendraat, C., Vallerga, C. L., Heilbron, K., Bandres-Ciga, S., Chang, D., Tan, M., Kia, D. A., Noyce, A. J., Xue, A., et al. (2019) · The Lancet Neurology · doi:10.1016/s1474-4422(19)30320-5 · Cited by 2,454
the DIAbetes Genetics Replication And Meta-analysis (DIAGRAM) Consortium, Morris, A. P., Voight, B. F., Teslovich, T. M., Ferreira, T., Segrè, A. V., Steinthorsdottir, V., Strawbridge, R. J., Khan, H., Grallert, H., et al. (2012) · Nature Genetics · doi:10.1038/ng.2383 · Cited by 1,912
Power and predictive accuracy of polygenic risk scores
Dudbridge, F. (2013) · PLoS Genetics · doi:10.1371/journal.pgen.1003348 · Cited by 1,509
“What sample size would have sufficient power to detect association of the polygenic score? For breast cancer the heritability of liability is estimated as 44% [21].”
BackgroundMethodInfluentialThe personal and clinical utility of polygenic risk scores
Torkamani, A., Wineinger, N. E., & Topol, E. J. (2018) · Nature Reviews Genetics · doi:10.1038/s41576-018-0018-x · Cited by 1,655
The mystery of missing heritability: Genetic interactions create phantom heritability
Zuk, O., Hechter, E., Sunyaev, S. R., & Lander, E. S. (2012) · Proceedings of the National Academy of Sciences · doi:10.1073/pnas.1119675109 · Cited by 1,542
Metadata
- Authors
- Wray, N. R., Yang, J., Goddard, M. E., & Visscher, P. M.
- Affiliations
- QIMR Berghofer Medical Research Institute (AU)
- The University of Melbourne (AU)
- Corresponding author
- Wray, Naomi R.
- Venue
- PLoS Genetics
- Publisher
- Public Library of Science (PLoS)
- Published
- 2010-02-26
- Volume
- 6
- Issue
- 2
- Pages
- e1000864
- ISSN
- 1553-7390 (ISSN-L)
- 1553-7404
- PMC
- PMC2829056
- OpenAlex
- W1990700240
- Cited by
- 334
- References
- 52
- Citations by year
- 2026: 11 · 2025: 16 · 2024: 9 · 2023: 16 · 2022: 13 · 2021: 26 · 2020: 27 · 2019: 28 · 2018: 14 · 2017: 24 · 2016: 14 · 2015: 19 · 2014: 30 · 2013: 22 · 2012: 34
- FWCI
- 15.45
- Type
- journal article
- Language
- en
- Open access
- gold
- doi.org
- Locations
- PLoS Genetics (publishedVersion, cc-by)
- Europe PMC (PubMed Central) (publishedVersion, cc-by)
- PubMed Central (publishedVersion, cc-by)
- PubMed (publishedVersion)
- DOAJ (DOAJ: Directory of Open Access Journals) (submittedVersion, cc-by-sa)
- Figshare (submittedVersion, cc-by)
- Minerva Access (University of Melbourne) (submittedVersion, cc-by)
- Funders
- Medical Research Council
- Australian Research Council (DP0770096)
- National Health and Medical Research Council (496688, 442915, DP0770096, 389892)
- Topics
- Life Sciences › Biochemistry, Genetics and Molecular Biology › Genetics › Genetic Associations and Epidemiology
- Life Sciences › Biochemistry, Genetics and Molecular Biology › Genetics › Genetic and phenotypic traits in livestock
- Life Sciences › Biochemistry, Genetics and Molecular Biology › Genetics › Genetic Mapping and Diversity in Plants and Animals
- Keywords
- area under the ROC curve, genomic profiling, genetic risk prediction, heritability, disease prevalence, sibling recurrence risk, liability scale, complex genetic disorders, genome-wide association study, genetic epidemiology
- MeSH terms
- Aged, 80 and over, Disease, Humans, Macular Degeneration, ROC Curve, Genome, Human, Prevalence, Area Under Curve, Gene Expression Profiling, Inheritance Patterns
About these checks
Registry, retraction, Cites and statistics results are computed, not judged, with one exception: a printed reference that no index lists is read once by a model before it counts as a citation error. Claims are extracted by a model and kept only when their quote appears verbatim in the text; each cited source is then checked, with a model’s help, for whether it says what the claim relies on. Those verdicts can be wrong — read the claim’s quote and the cited source before relying on one.
Statistics and arithmetic are recomputed, not judged.
Confidence bands are shown only for fields calibrated on our annotated test set. None is calibrated yet, so no band is shown.
What counts as a claim ›How we measure confidence ›How we check this ›
Are you an author, or do you see a problem with this page? Request a review
