

The DOI matches its Crossref record; 49 of the 49 references it cites were found in a registry or an index.
Digital Quantification of Human Eye Color Highlights Genetic Association of Three New Loci
Open accessAbstract
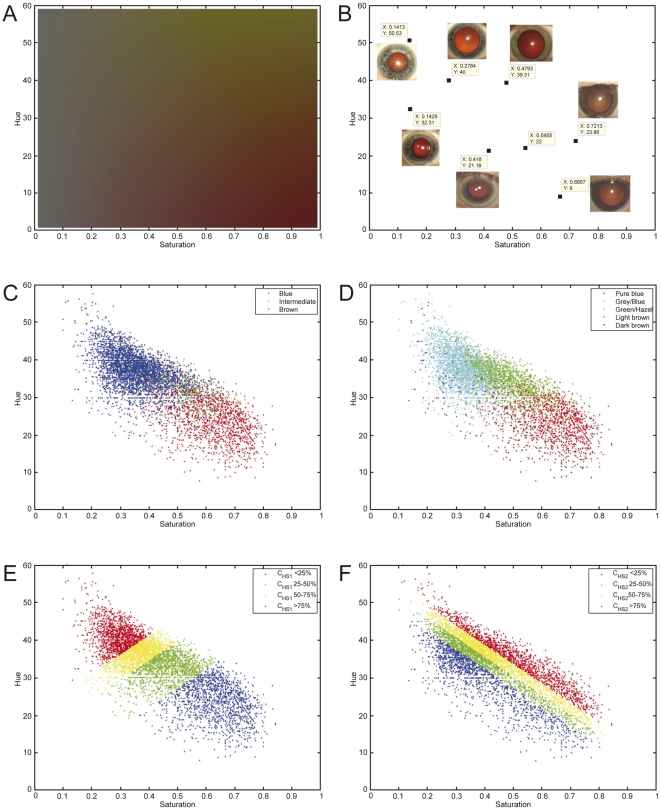
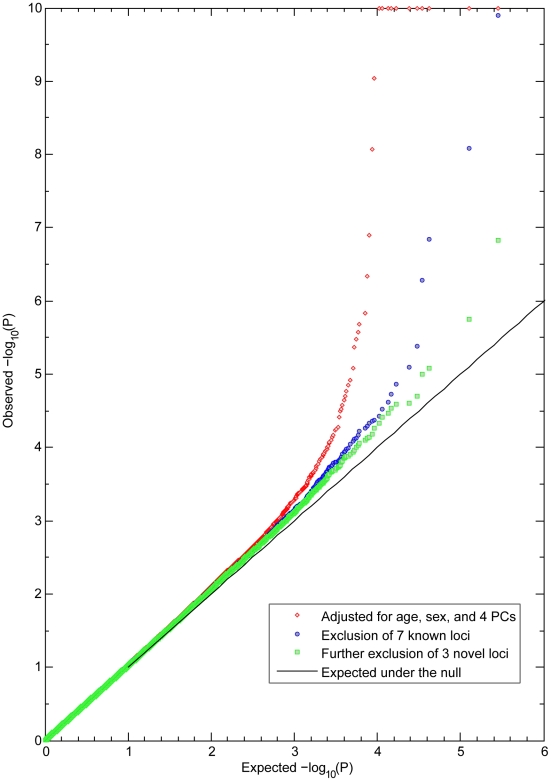
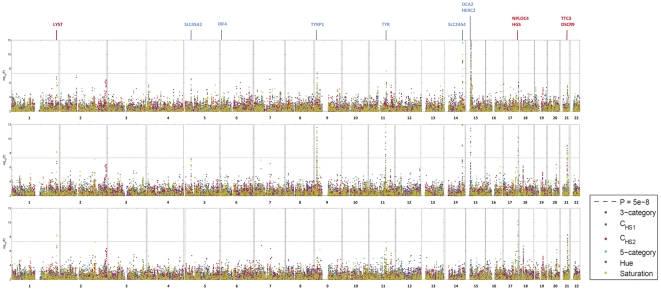
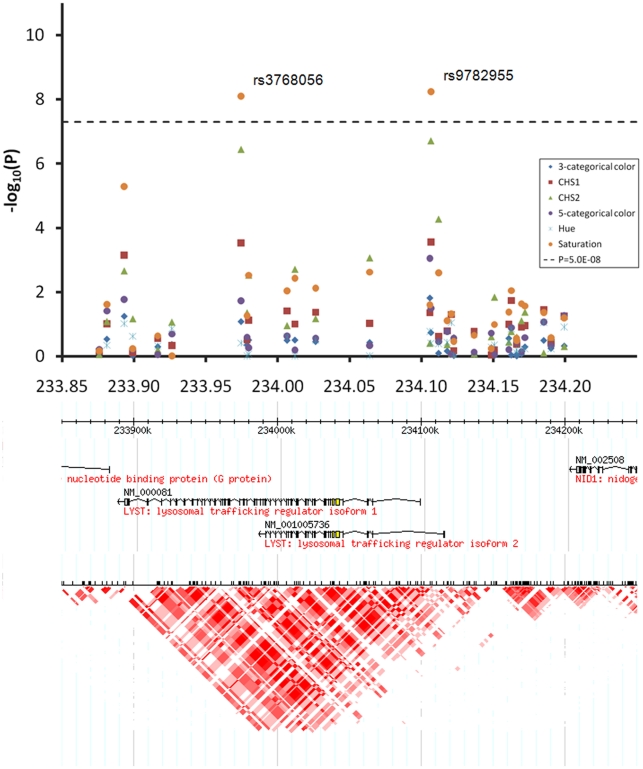
Previous studies have successfully identified genetic variants in several genes associated with human iris (eye) color; however, they all used simplified categorical trait information. Here, we quantified continuous eye color variation into hue and saturation values using high-resolution digital full-eye photographs and conducted a genome-wide association study on 5,951 Dutch Europeans from the Rotterdam Study. Three new regions, 1q42.3, 17q25.3, and 21q22.13, were highlighted meeting the criterion for genome-wide statistically significant association. The latter two loci were replicated in 2,261 individuals from the UK and in 1,282 from Australia. The LYST gene at 1q42.3 and the DSCR9 gene at 21q22.13 serve as promising functional candidates. A model for predicting quantitative eye colors explained over 50% of trait variance in the Rotterdam Study. Over all our data exemplify that fine phenotyping is a useful strategy for finding genes involved in human complex traits.
Overview
The claims and statistics of this paper haven’t been checked yet.
Run the check — free, no account needed. It reads the open-access text and checks the sources it cites.
Integrity signals
Registry
Cites
Statistics
Figures
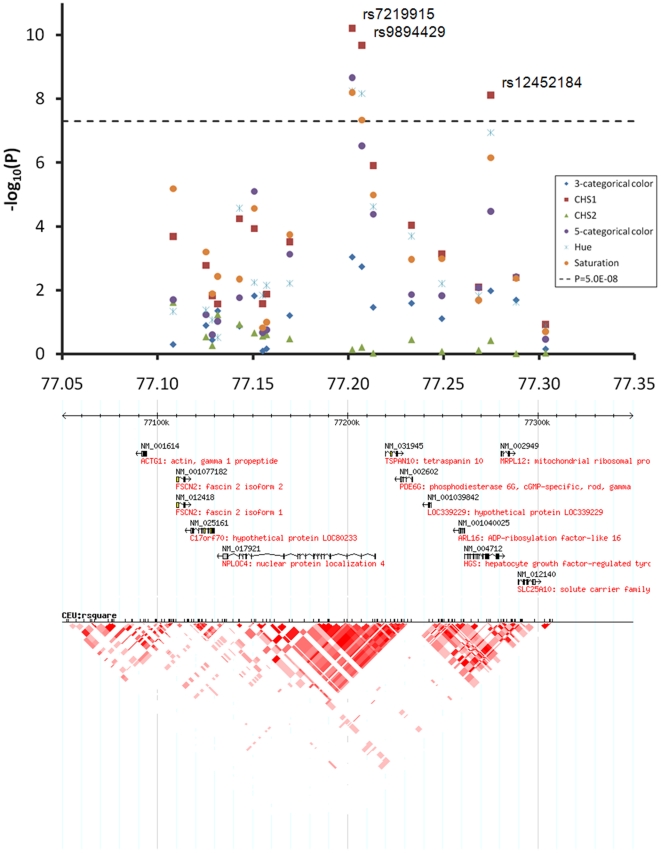
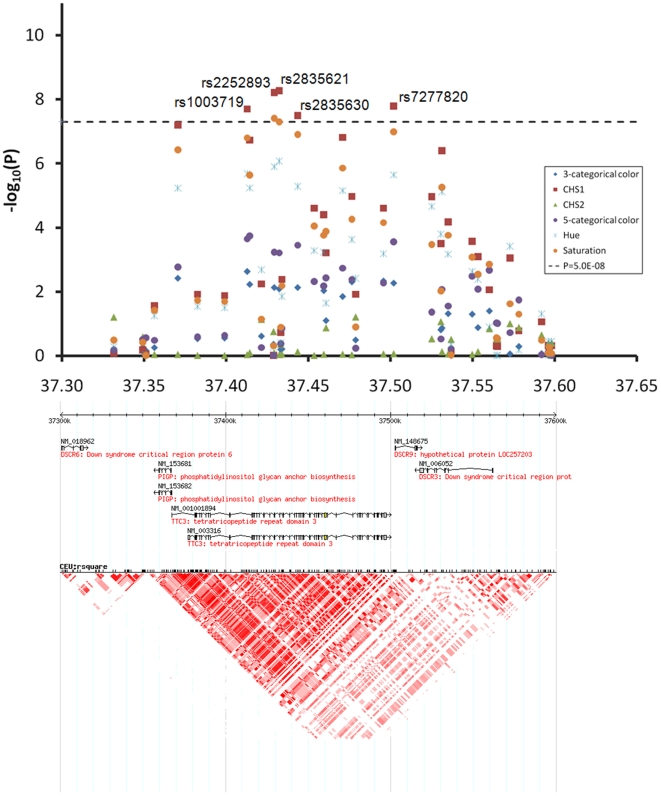
Verification
Claims the paper makes
The claims and statistics of this paper haven’t been checked yet.
Run the check — free, no account needed. It reads the open-access text and checks the sources it cites.
Claims other papers make about this one
Each is checked against this paper’s own text: does it say what the citing paper says it does?
The source backs part of the claim, not all of it — or backs it for a different population, condition or comparison.
In the citing paper
“This eye color locus was later refined to a small region 50 kb upstream of OCA2 in an intron of the HERC2 gene [7], [8], [10].”
From Genetic Architecture of Skin and Eye Color in an African-European Admixed Population (2013) · cites this paper as [8]
Experimental — accuracy not yet measuredIn the citing paper
“A recent study by Liu et al. (2010) found that rs12913832 has the strongest effect when eye color is measured quantitatively and can explain most of the variance in eye color amongst Europeans.”
From A global view of the OCA2-HERC2 region and pigmentation (2012) · cites this paper as Liu et al. (2010)
In the citing paper
“These authors report that the quantitation improved the power to detect the association signals at some known pigmentation genes and also facilitated the identification of two novel replicated eye color loci at 17q25 and 21q22.”
From Genome-Wide Association Studies of Quantitatively Measured Skin, Hair, and Eye Pigmentation in Four European Populations (2012) · cites this paper as [11]
In the citing paper
“In contrast, other eye color loci reported [11] have been estimated each to explain less than 1% of the phenotypic variation, for which our GWAS sample size is under-powered.”
From Genome-Wide Association Studies of Quantitatively Measured Skin, Hair, and Eye Pigmentation in Four European Populations (2012) · cites this paper as [11]
In the citing paper
“rs12913832 is a strong predictor of eye color; it alone explains 44–48% of the variance in quantitative measures of eye color in Dutch Europeans [11].”
From Genome-Wide Association Studies of Quantitatively Measured Skin, Hair, and Eye Pigmentation in Four European Populations (2012) · cites this paper as [11]
Self-check
Percentages, sums and reported differences re-computed from the paper’s own numbers.
The self-check needs the paper’s full text.
Citations
Cites
A new look at the statistical model identification
Akaike, H. (1974) · IEEE Transactions on Automatic Control · doi:10.1109/tac.1974.1100705 · Cited by 51,879
PLINK: a tool set for whole-genome association and population-based linkage analyses.
Purcell, S., Neale, B., Todd-Brown, K., Thomas, L., Ferreira, M. A. R., Bender, D., Maller, J., Sklar, P., de Bakker, P. I. W., Daly, M. J., et al. (2007) · The American Journal of Human Genetics · doi:10.1086/519795 · Cited by 34,089
Haploview: analysis and visualization of LD and haplotype maps
Barrett, J. C., Fry, B., Maller, J., & Daly, M. J. (2004) · Bioinformatics · doi:10.1093/bioinformatics/bth457 · Cited by 14,563
Merlin—rapid analysis of dense genetic maps using sparse gene flow trees
Abecasis, G. R., Cherny, S. S., Cookson, W., & Cardon, L. R. (2001) · Nature Genetics · doi:10.1038/ng786 · Cited by 3,323
GenABEL: an R library for genome-wide association analysis
Aulchenko, Y. S., Ripke, S., Isaacs, A., & van Duijn, C. M. (2007) · Bioinformatics · doi:10.1093/bioinformatics/btm108 · Cited by 1,836 · cited 1×
“4-3 [38] for genotyped SNPs and PLINK v1.”
BackgroundPersonal genomes: The case of the missing heritability
Maher, B. (2008) · Nature · doi:10.1038/456018a · Cited by 1,737
The Rotterdam Study: objectives and design update
Albert Hofman, D., Breteler, M. M. B., van Duijn, C. M., Krestin, G. P., Pols, H. A. P., Stricker, B. H. C., Tiemeier, H. W., Uitterlinden, A. G., Vingerling, J. R., & Witteman, J. C. M. (2007) · European Journal of Epidemiology · doi:10.1007/s10654-007-9199-x · Cited by 1,408
Self-citationWada, K., Tanaka, K., & Nakashima, K. (2011) · PubMed · Cited by 1,132
Determinants of disease and disability in the elderly: The Rotterdam elderly study
Albert Hofman, D., Grobbee, D. E., de Jong, P. T. V. M., & Ouweland, F. A. V. D. (1991) · European Journal of Epidemiology · doi:10.1007/bf00145007 · Cited by 1,120
Li, Y., Willer, C., Sanna, S., & Abecasis, G. (2009) · Annual Review of Genomics and Human Genetics · doi:10.1146/annurev.genom.9.081307.164242 · Cited by 990
Cited by
Sorted by citations
Houle, D., Govindaraju, D. R., & Omholt, S. W. (2010) · Nature Reviews Genetics · doi:10.1038/nrg2897 · Cited by 1,319
Improving human forensics through advances in genetics, genomics and molecular biology
Kayser, M., & de Knijff, P. (2011) · Nature Reviews Genetics · doi:10.1038/nrg2952 · Cited by 538
Self-citationKayser, M. (2015) · Forensic Science International Genetics · doi:10.1016/j.fsigen.2015.02.003 · Cited by 475
Self-citationRuiz-Linares, A., Adhikari, K., Acuña-Alonzo, V., Quinto-Sanchez, M., Jaramillo, C., Arias, W., Fuentes, M., Pizarro, M., Everardo, P., de Avila, F., et al. (2014) · PLoS Genetics · doi:10.1371/journal.pgen.1004572 · Cited by 442
“Europeans and certain of these show large allele frequency differences between Europeans and non-Europeans [1,2,36].”
BackgroundThe HIrisPlex system for simultaneous prediction of hair and eye colour from DNA
Walsh, S., Liu, F., Wollstein, A., Kovatsi, L., Ralf, A., Kosiniak-Kamysz, A., Branicki, W., & Kayser, M. (2013) · Forensic Science International Genetics · doi:10.1016/j.fsigen.2012.07.005 · Cited by 428
Self-citation
Metadata
- Authors
- Liu, F., Wollstein, A., Hysi, P. G., Ankra-Badu, G. A., Spector, T. D., Park, D., Zhu, G., Larsson, M., Duffy, D. L., Montgomery, G. W., Mackey, D. A., Walsh, S., Lao, O., Hofman, A., Rivadeneira, F., Vingerling, J. R., Uitterlinden, A. G., Martin, N. G., Hammond, C. J., & Kayser, M.
- Affiliations
- Erasmus MC (NL)
- University of Cologne (DE)
- King's College London (GB)
- QIMR Berghofer Medical Research Institute (AU)
- Lions Eye Institute (AU)
- Corresponding author
- Kayser, Manfred
- ORCID
- Venue
- PLoS Genetics
- Publisher
- Public Library of Science (PLoS)
- Published
- 2010-05-06
- Volume
- 6
- Issue
- 5
- Pages
- e1000934
- ISSN
- 1553-7390 (ISSN-L)
- 1553-7404
- PMC
- PMC2865509
- OpenAlex
- W2045107415
- Semantic Scholar
- 87d9d57d10ad482fb9aa1836da62b1416f0293f0
- Cited by
- 191
- References
- 49
- Citations by year
- 2026: 5 · 2025: 5 · 2024: 9 · 2023: 7 · 2022: 11 · 2021: 9 · 2020: 13 · 2019: 16 · 2018: 12 · 2017: 10 · 2016: 11 · 2015: 12 · 2014: 14 · 2013: 20 · 2012: 17
- FWCI
- 8.03
- Type
- journal article
- Language
- en
- Open access
- gold
- doi.org
- Locations
- PLoS Genetics (publishedVersion, cc-by)
- Europe PMC (PubMed Central) (publishedVersion, cc-by)
- PubMed Central (publishedVersion, cc-by)
- PubMed (publishedVersion)
- EUR Research Repository (Erasmus University Rotterdam) (publishedVersion, other-oa)
- RePEc: Research Papers in Economics (submittedVersion)
- Minerva Access (University of Melbourne) (submittedVersion, cc-by)
- UWA Profiles and Research Repository (UWA) (submittedVersion, other-oa)
- EUR Research Repository (Erasmus University Rotterdam) (submittedVersion, other-oa)
- RePub (Erasmus University Rotterdam) (submittedVersion, other-oa)
- DOAJ (DOAJ: Directory of Open Access Journals) (submittedVersion)
- Figshare (submittedVersion, cc-by)
- Research Portal (King's College London) (submittedVersion)
- RePub (Erasmus University Rotterdam) (submittedVersion)
- Funders
- Helsingin Yliopisto
- Wellcome Trust (01254, 201865, 201413, HEALTH-F4-2007-201413)
- National Institute for Health and Care Research
- European Commission (QLG2-CT-2002-01254, 2007–2013, FP7 2007-2013, 201413, 201865, 01254, 014-93-015)
- ZonMw (050-060-810)
- Erasmus Universiteit Rotterdam
- Nederlandse Organisatie voor Wetenschappelijk Onderzoek (050.060.810, FP7 2007-2013, 014-93-015, 911-03-012, 175.010.2005.011)
- Oogfonds
- Algemene Nederlandse Vereniging ter voorkoming van Blindheid
- Heidelberg Engineering
- Stichting Nederlands Oogheelkundig Onderzoek
- National Institutes of Health (389875, QLG2-CT-2002-01254)
- Directorate for Biological Sciences
- Medical Research Council
- Biotechnology and Biological Sciences Research Council (G20234)
- Menzies Centre for Australian Studies, King's College London, University of London
- Australian Research Council (DP0343921)
- National Health and Medical Research Council (A7960034, 496739, 443036, A79906588, 389927, 389891, 552485, DP0212016, 552498, 442981, 389938, 241944, 339462, 442915, 389875, A79801419, 389892)
- Erasmus Universitair Medisch Centrum Rotterdam
- National Eye Institute (R01EY018246)
- National Cancer Institute (R01CA088363)
- Topics
- Life Sciences › Biochemistry, Genetics and Molecular Biology › Genetics › Genetic Associations and Epidemiology
- Life Sciences › Biochemistry, Genetics and Molecular Biology › Cell Biology › melanin and skin pigmentation
- Life Sciences › Biochemistry, Genetics and Molecular Biology › Genetics › Genetic Mapping and Diversity in Plants and Animals
- Keywords
- iris color, eye color, genome-wide association study, LYST, complex traits
- MeSH terms
- Adolescent, Adult, Aged, Aged, 80 and over, Eye Color, Humans, Male, Middle Aged, Photography, Cohort Studies, Polymorphism, Single Nucleotide, White People, Genome-Wide Association Study, Young Adult
About these checks
Registry, retraction, Cites and statistics results are computed, not judged, with one exception: a printed reference that no index lists is read once by a model before it counts as a citation error. Claims are extracted by a model and kept only when their quote appears verbatim in the text; each cited source is then checked, with a model’s help, for whether it says what the claim relies on. Those verdicts can be wrong — read the claim’s quote and the cited source before relying on one.
Statistics and arithmetic are recomputed, not judged.
Confidence bands are shown only for fields calibrated on our annotated test set. None is calibrated yet, so no band is shown.
What counts as a claim ›How we measure confidence ›How we check this ›
Are you an author, or do you see a problem with this page? Request a review
