

The DOI matches its Crossref record; 67 of the 67 references it cites were found in a registry or an index.
Transferability of Type 2 Diabetes Implicated Loci in Multi-Ethnic Cohorts from Southeast Asia
Open accessAbstract
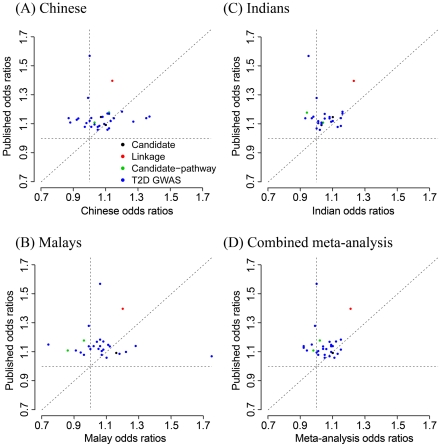
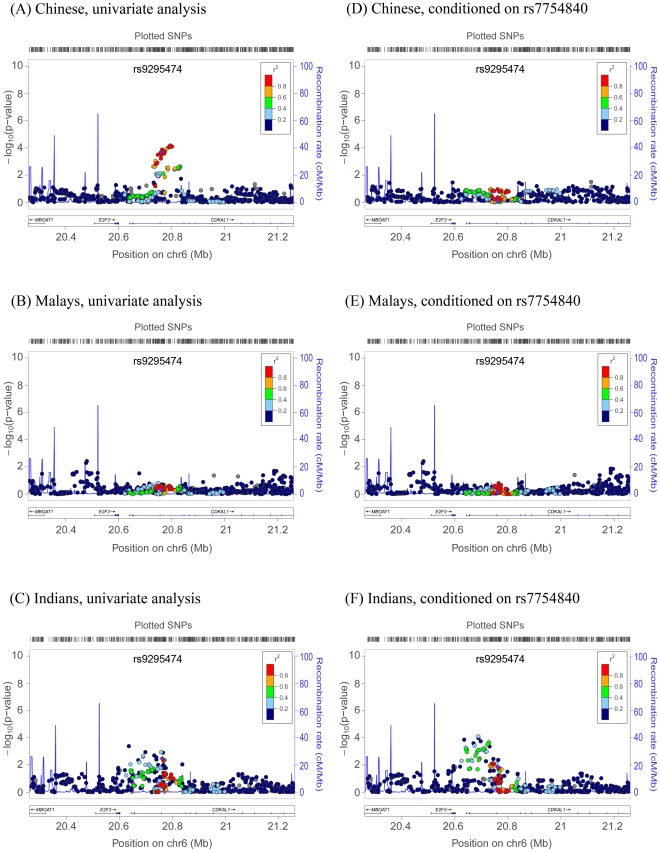
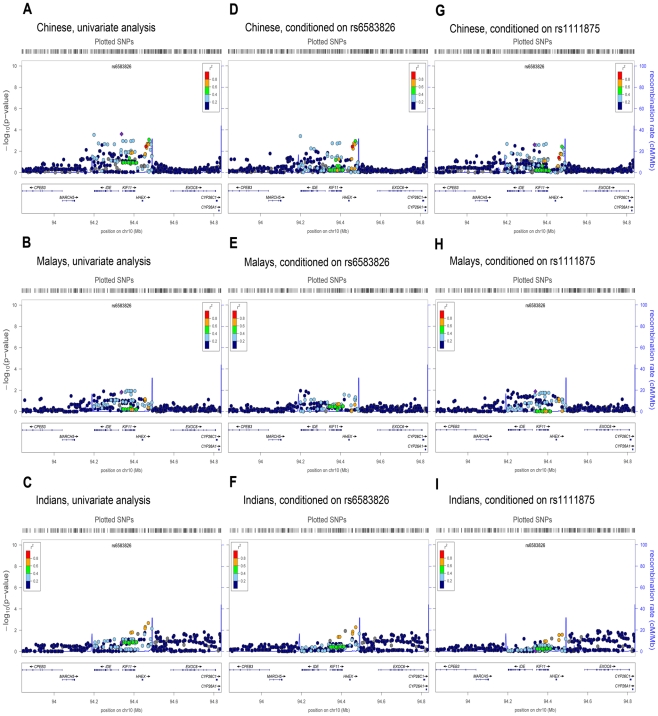
Recent large genome-wide association studies (GWAS) have identified multiple loci which harbor genetic variants associated with type 2 diabetes mellitus (T2D), many of which encode proteins not previously suspected to be involved in the pathogenesis of T2D. Most GWAS for T2D have focused on populations of European descent, and GWAS conducted in other populations with different ancestry offer a unique opportunity to study the genetic architecture of T2D. We performed genome-wide association scans for T2D in 3,955 Chinese (2,010 cases, 1,945 controls), 2,034 Malays (794 cases, 1,240 controls), and 2,146 Asian Indians (977 cases, 1,169 controls). In addition to the search for novel variants implicated in T2D, these multi-ethnic cohorts serve to assess the transferability and relevance of the previous findings from European descent populations in the three major ethnic populations of Asia, comprising half of the world's population. Of the SNPs associated with T2D in previous GWAS, only variants at CDKAL1 and HHEX/IDE/KIF11 showed the strongest association with T2D in the meta-analysis including all three ethnic groups. However, consistent direction of effect was observed for many of the other SNPs in our study and in those carried out in European populations. Close examination of the associations at both the CDKAL1 and HHEX/IDE/KIF11 loci provided some evidence of locus and allelic heterogeneity in relation to the associations with T2D. We also detected variation in linkage disequilibrium between populations for most of these loci that have been previously identified. These factors, combined with limited statistical power, may contribute to the failure to detect associations across populations of diverse ethnicity. These findings highlight the value of surveying across diverse racial/ethnic groups towards the fine-mapping efforts for the casual variants and also of the search for variants, which may be population-specific.
Overview
The claims and statistics of this paper haven’t been checked yet.
Run the check — free, no account needed. It reads the open-access text and checks the sources it cites.
Integrity signals
Registry
Cites
Statistics
Figures
Verification
Claims the paper makes
The claims and statistics of this paper haven’t been checked yet.
Run the check — free, no account needed. It reads the open-access text and checks the sources it cites.
Claims other papers make about this one
Each is checked against this paper’s own text: does it say what the citing paper says it does?
In the citing paper
“Under a mutation-selection balance model, it may be possible for different novel rare variants to have effects in each population, and fine mapping studies sometimes reveal subtle differences in the patterns of association [eg.67,68.”
From Rare and common variants: twenty arguments (2012) · cites this paper as [67]
Self-check
Percentages, sums and reported differences re-computed from the paper’s own numbers.
The self-check needs the paper’s full text.
Citations
Cites
Principal components analysis corrects for stratification in genome-wide association studies
Price, A. L., Patterson, N. J., Plenge, R. M., Weinblatt, M. E., Shadick, N. A., & Reich, D. (2006) · Nature Genetics · doi:10.1038/ng1847 · Cited by 10,248 · cited 6×
“Population structure ascertainment was carried out using principal components analysis (PCA) [59] with 4 panels from International Hapmap [60] and the Singapore Genome Variation Project [61] (http://www.nus-cme. org.sg/SGVP/) which includes 96 Chinese, 89 Malays and 83 Asian Indians from Singapore.”
MethodInfluentialGenome-wide association study of 14,000 cases of seven common diseases and 3,000 shared controls
The Wellcome Trust Case Control Consortium, Management Committee, Burton, P. R., Clayton, D. G., Cardon, L. R., Craddock, N., Deloukas, P., Duncanson, A., Kwiatkowski, D. P., McCarthy, M. I., et al. (2007) · Nature · doi:10.1038/nature05911 · Cited by 9,442
A second generation human haplotype map of over 3.1 million SNPs
The International HapMap Consortium (2007) · Nature · doi:10.1038/nature06258 · Cited by 4,438 · cited 3×
“Population structure ascertainment was carried out using principal components analysis (PCA) [59] with 4 panels from International Hapmap [60] and the Singapore Genome Variation Project [61] (http://www.nus-cme. org.sg/SGVP/) which includes 96 Chinese, 89 Malays and 83 Asian Indians from Singapore.”
MethodHowie, B. N., Donnelly, P., & Marchini, J. (2009) · PLoS Genetics · doi:10.1371/journal.pgen.1000529 · Cited by 3,928 · cited 1×
“2 [63], incorporating population-specific genotypes from SGVP.”
International Expert Committee report on the role of the A1c assay in the diagnosis of diabetes
The International Expert Committee (2009) · Diabetes Care · doi:10.2337/dc09-9033 · Cited by 3,185
Prevalence of Diabetes among Men and Women in China
Yang, W., Lu, J., Weng, J., Jia, W., Ji, L., Xiao, J., Shan, Z., Liu, J., Tian, H., Ji, Q., et al. (2010) · New England Journal of Medicine · doi:10.1056/nejmoa0908292 · Cited by 3,031 · cited 1×
“million people with T2D [3].”
Self-citationA genome-wide association study identifies novel risk loci for type 2 diabetes
Sladek, R., Rocheleau, G., Rung, J., Dina, C., Shen, L., Serre, D., Boutin, P., Vincent, D., Belisle, A., Hadjadj, S., et al. (2007) · Nature · doi:10.1038/nature05616 · Cited by 2,993 · cited 2×
“These genome-wide association studies (GWAS) have identified a number of novel loci harboring common variants that are associated with an increased risk of T2D [4–11], adding to the loci previously identified by candidate gene studies (PPARG [12], KCNJ11 [13–14], WFS1 [15–16]) and linkage studies TCF7L2 [17–19]).”
BackgroundResultGenome-wide association analysis identifies loci for type 2 diabetes and triglyceride levels
Saxena, R., Voight, B. F., Lyssenko, V., Burtt, N. P., de Bakker, P. I. W., Chen, H., Roix, J. J., Kathiresan, S., Hirschhorn, J. N., Daly, M. J., et al. (2007) · Science · doi:10.1126/science.1142358 · Cited by 2,843
A genome-wide association study of type 2 diabetes in Finns detects multiple susceptibility variants
Scott, L. J., Mohlke, K. L., Bonnycastle, L. L., Willer, C. J., Li, Y., Duren, W. L., Erdos, M. R., Stringham, H. M., Chines, P. S., Jackson, A. U., et al. (2007) · Science · doi:10.1126/science.1142382 · Cited by 2,753
Self-citationThe Wellcome Trust Case Control Consortium, U.K.
Mossman, K. (2008) · Scientific American · doi:10.1038/scientificamerican0108-42a · Cited by 2,714
Cited by
Sorted by citations
Rare and common variants: twenty arguments
Gibson, G. (2012) · Nature Reviews Genetics · doi:10.1038/nrg3118 · Cited by 1,278
The genetic architecture of type 2 diabetes
Fuchsberger, C., Flannick, J., Teslovich, T. M., Mahajan, A., Agarwala, V., Gaulton, K. J., Ma, C., Fontanillas, P., Moutsianas, L., McCarthy, D. J., et al. (2016) · Nature · doi:10.1038/nature18642 · Cited by 1,051
Self-citationGenetics of Type 2 Diabetes—Pitfalls and Possibilities
Prasad, R., & Groop, L. (2015) · Genes · doi:10.3390/genes6010087 · Cited by 458
Volgman, A. S., Palaniappan, L. S., Aggarwal, N. T., Gupta, M., Khandelwal, A., Krishnan, A. V., Lichtman, J. H., Mehta, L. S., Patel, H. N., Shah, K. S., et al. (2018) · Circulation · doi:10.1161/cir.0000000000000580 · Cited by 552
Epidemiology and determinants of type 2 diabetes in south Asia
Hills, A. P., Arena, R., Khunti, K., Yajnik, C. S., Jayawardena, R., Henry, C. J., Street, S. J., Soares, M. J., & Misra, A. (2018) · The Lancet Diabetes & Endocrinology · doi:10.1016/s2213-8587(18)30204-3 · Cited by 290
Phan, T. P., Alkema, L., Tai, E. S., Tan, K. H. X., Yang, Q., Lim, W., Teo, Y. Y., Cheng, C., Wang, X., Wong, T. Y., et al. (2014) · BMJ Open Diabetes Research & Care · doi:10.1136/bmjdrc-2013-000012 · Cited by 193
Self-citationTabassum, R., Chauhan, G., Dwivedi, O. P., Mahajan, A., Jaiswal, A., Kaur, I., Bandesh, K., Singh, T., Mathai, B. J., Pandey, Y., et al. (2012) · Diabetes · doi:10.2337/db12-0406 · Cited by 188
“Although GWAS have greatly improved our understanding of the genetic basis of T2D, most of these studies have been performed in Europeans (9), and the studies involving South Asians are very limited (7,10).”
BackgroundLin, Z., Bei, J., Shen, M., Li, Q., Liao, Z., Zhang, Y., Lv, Q., Wei, Q., Low, H.-Q., Guo, Y., et al. (2011) · Nature Genetics · doi:10.1038/ng.1005 · Cited by 166
Self-citationCheng, C., Schäche, M., Ikram, M. K., Young, T. L., Guggenheim, J. A., Vitart, V., MacGregor, S., Verhoeven, V. J. M., Barathi, V. A., Liao, J., et al. (2013) · The American Journal of Human Genetics · doi:10.1016/j.ajhg.2013.06.016 · Cited by 161
Self-citationA Form of the Metabolic Syndrome Associated with Mutations in DYRK1B
Keramati, A. R., Fathzadeh, M., Go, G., Singh, R., Choi, M., Faramarzi, S., Mane, S., Kasaei, M. M., Sarajzadeh, K., Hwa, J., et al. (2014) · New England Journal of Medicine · doi:10.1056/nejmoa1301824 · Cited by 161
Kwan, T., Wong, S. S., Hong, Y., Kanaya, A. M., Khan, S. S., Hayman, L. L., Shah, S. H., Welty, F. K., DEEDWANIA, P. C., Khaliq, A., et al. (2023) · Circulation · doi:10.1161/cir.0000000000001145 · Cited by 140
Insights into pancreatic islet cell dysfunction from type 2 diabetes mellitus genetics
Krentz, N. A. J., & Gloyn, A. L. (2020) · Nature Reviews Endocrinology · doi:10.1038/s41574-020-0325-0 · Cited by 129
Genetic Variants on Chromosome 1q41 Influence Ocular Axial Length and High Myopia
Fan, Q., Barathi, V. A., Cheng, C., Zhou, X., Meguro, A., Nakata, I., Khor, C. C., Goh, L.-K., Li, Y., Lim, W., et al. (2012) · PLoS Genetics · doi:10.1371/journal.pgen.1002753 · Cited by 116
“For SiMES Malays, we also excluded the samples falling in the main clusters of PCA plots of the Chinese and Indians ethnic groups, as described in the previous study [68].”
MethodSelf-citationAdeyemo, A., Zaghloul, N. A., Chen, G., Doumatey, A. P., Leitch, C. C., Hostelley, T. L., Nesmith, J. E., Zhou, J., Bentley, A. R., Shriner, D., et al. (2019) · Nature Communications · doi:10.1038/s41467-019-10967-7 · Cited by 117
Wu, Y., Waite, L. L., Jackson, A., Sheu, W. H., Buyske, S. G., Absher, D., Arnett, D. K., Boerwinkle, E., Bonnycastle, L. L., Carty, C. L., et al. (2013) · PLoS Genetics · doi:10.1371/journal.pgen.1003379 · Cited by 112
“Recently GWAS have identified more than one independent signal at loci associated with coronary artery disease [11] and type 2 diabetes [12,13].”
BackgroundSelf-citationChallenges in Elucidating the Genetics of Diabetic Retinopathy
Kuo, J. Z.-C., Wong, T. Y., & Rotter, J. I. (2013) · JAMA Ophthalmology · doi:10.1001/jamaophthalmol.2013.5024 · Cited by 111
Self-citationChen, G., Bentley, A. R., Adeyemo, A., Shriner, D., Zhou, J., Doumatey, A. P., Huang, H., Ramos, E., Erdos, M. R., Gerry, N. P., et al. (2012) · Human Molecular Genetics · doi:10.1093/hmg/dds282 · Cited by 83
Ehlert, T., Simon, P. D., & Moser, D. (2013) · Sports Medicine · doi:10.1007/s40279-012-0012-y · Cited by 84
“over-represented SNPs in thousands of type 2 diabetics from different ethnic populations [40–48].”
BackgroundGene loci associated with insulin secretion in islets from nondiabetic mice
Keller, M. P., Rabaglia, M. E., Schueler, K. L., Stapleton, D. S., Gatti, D. M., Vincent, M. J., Mitok, K. A., Wang, Z., Ishimura, T., Simonett, S. P., et al. (2019) · Journal of Clinical Investigation · doi:10.1172/jci129143 · Cited by 79
“A SNP near the HUNK gene is associated with type 2 diabetes in multi-ethnic cohorts from Southeast Asia (1).”
Wei, F., & Tomizawa, K. (2011) · Endocrine Journal · doi:10.1507/endocrj.ej11-0099 · Cited by 74
Comparing methods for performing trans-ethnic meta-analysis of genome-wide association studies
Wang, X., Chua, H.-X., Chen, P., Ong, R. T., Sim, X., Zhang, W., Takeuchi, F., Liu, X., Khor, C. C., Tay, W.-T., et al. (2013) · Human Molecular Genetics · doi:10.1093/hmg/ddt064 · Cited by 70
“Japan: This consists of a T2D study across 931 cases and 1404 controls sampled from four regions in Tokyo that have been genotyped on the Illumina HumanHap 550 BeadChip (13); SCES: The Singapore Chinese Eye Study included 302 T2D cases and 1089 controls, out of a total of 1952 Chinese subjects that have been genotyped…”
MethodSelf-citationEuropean genetic variants associated with type 2 diabetes in North African Arabs
Cauchi, S., Ezzidi, I., Achhab, Y. E., Mtiraoui, N., Chaïeb, L., Salah, D., Nejjari, C., Labrune, Y., Yengo, L., Beury, D., et al. (2012) · Diabetes & Metabolism · doi:10.1016/j.diabet.2012.02.003 · Cited by 70
Multi-ethnic studies in complex traits
Fu, J., Festen, E. A. M., & Wijmenga, C. (2011) · Human Molecular Genetics · doi:10.1093/hmg/ddr386 · Cited by 69
“(9) concluded that there is considerable locus and allelic heterogeneity in T2D association between populations.”
BackgroundGenetic Determinants of Age-Related Macular Degeneration in Diverse Populations From the PAGE Study
Restrepo, N. A., Spencer, K. L., Goodloe, R., Garrett, T. A., HEISS, G. M., kova, P. B., Jorgensen, N. W., Jensen, R. A., Matise, T. C., Hindorff, L. A., et al. (2014) · Investigative Ophthalmology & Visual Science · doi:10.1167/iovs.14-14246 · Cited by 66
“Genotyping details have been published elsewhere.(52) Genotyping methods with SiMES followed those of the SP2 cohort as previously described.”
MethodSelf-citationTransferability and Fine Mapping of Type 2 Diabetes Loci in African Americans
Ng, M. C. Y., Saxena, R., Li, J., Palmer, N. D., Dimitrov, L., Xu, J., Rasmussen-Torvik, L. J., Zmuda, J. M., Siscovick, D. S., Patel, S. R., et al. (2013) · Diabetes · doi:10.2337/db12-0266 · Cited by 62
“The reported index single nucleotide polymorphisms (SNPs) at these loci have been replicated in multiple populations (22 – 24) but less successfully in AfA (25 – 27).”
Insights into the genetic basis of type 2 diabetes
Kato, N. (2013) · Journal of Diabetes Investigation · doi:10.1111/jdi.12067 · Cited by 58
Hanscombe, K. B., Persyn, E., Traylor, M., Glanville, K. P., Hamer, M., Coleman, J. R. I., & Lewis, C. M. (2021) · Genome Medicine · doi:10.1186/s13073-021-00994-9 · Cited by 55
“trocardiography [60], diastolic blood pressure [61] and diabetes mellitus [62].”
BackgroundCui, Q., Feng, Q.-S., Mo, H., Sun, J., Xia, Y.-F., Zhang, H., Foo, J. N., Guo, Y., Chen, L.-Z., Li, M., et al. (2016) · Human Molecular Genetics · doi:10.1093/hmg/ddw200 · Cited by 53
Self-citationGao, H., Kim, Y., Chen, P., Igase, M., Kawamoto, R., Kim, M. K., Kohara, K., Lee, J., Miki, T., Ong, R. T., et al. (2013) · Diabetes · doi:10.2337/db13-0129 · Cited by 54
Self-citationTomasoni, M., Beyeler, M. J., Vela, S. O., Mounier, N., Porcu, E., Corre, T., Krefl, D., Button, A. L., Abouzeid, H., Konstantinidis, L., et al. (2023) · Ophthalmology Science · doi:10.1016/j.xops.2023.100288 · Cited by 47
Kwak, S. H., Chae, J., Lee, S., Choi, S., Koo, B. K., Yoon, J. W., Park, J., Cho, B., Moon, M. K., Lim, S. K., et al. (2018) · Diabetes · doi:10.2337/db18-0361 · Cited by 50
“In addition, the haplotype structure of certain risk loci and variant allele frequency are different among populations (6,7).”
BackgroundThe Architecture of Risk for Type 2 Diabetes: Understanding Asia in the Context of Global Findings
Abdullah, N., Attia, J., Oldmeadow, C. J., Scott, R. J., & Holliday, E. G. (2014) · International Journal of Endocrinology · doi:10.1155/2014/593982 · Cited by 47
“Chinese [117, 145, 146], African-American [121, 147, 148], Southeast Asian [124], Hispanic [149], Mexican-American [150], South Asian [92], Indo-European [151], and Indian Punjabi Sikh [152].”
BackgroundInfluentialA comparison of type 2 diabetes risk allele load between African Americans and European Americans
Keaton, J. M., Bailey, J. N. C., Palmer, N. D., Freedman, B. I., Langefeld, C. D., Ng, M. C. Y., & Bowden, D. W. (2014) · Human Genetics · doi:10.1007/s00439-014-1486-5 · Cited by 47
“We selected SNPs from T2D risk loci with prior evidence of association (p < 5 × 10⁻⁸) in GWAS of European, African American and other ethnicities (Steinthorsdottir et al. 2007; Diabetes Genetics Initiative of Broad Institute of Harvard and MIT, Lund University, and Novartis Institutes of BioMedical Research et al. 200…”
MethodProjection of prediabetes and diabetes population size in Singapore using a dynamic Markov model
Wong, L. Y., Toh, M. P. H. S., & Tham, L. (2016) · Journal of Diabetes · doi:10.1111/1753-0407.12384 · Cited by 46
The type 2 diabetes-associated HMG20A gene is mandatory for islet beta cell functional maturity
Mellado‐Gil, J. M., Fuente-Martín, E., Lorenzo, P. I., Cobo‐Vuilleumier, N., López–Noriega, L., Martín‐Montalvo, A., Herrera-Gómez, I. D. G., Ceballos-Chávez, M., Gómez-Jaramillo, L., Campos‐Caro, A., et al. (2018) · Cell Death and Disease · doi:10.1038/s41419-018-0272-z · Cited by 46
“We find that: (1) HMG20A is expressed in pancreatic islet beta cells, (2) HMG20A levels are decreased in T2DM islets, (3) high glucose stimulates HMG20A expression, (4) the T2DM-associated SNP within the 3′ UTR of the HMG20A transcript decreases luciferase activity, (5) HMG20A regulates key genes in beta cell function…”
BackgroundEdwards, D. R. V., Naj, A. C., Monda, K. L., North, K. E., Neuhouser, M. L., Magvanjav, O., Kusimo, I., Vitolins, M. Z., Manson, J. E., O’Sullivan, M. J., et al. (2012) · Human Genetics · doi:10.1007/s00439-012-1246-3 · Cited by 48
“Variation in ZPLD1 has been nominally associated with type 2 diabetes in Southeast Asians (Sim et al., 2011).”
BackgroundZhou, B., Wei, F., Kanai, N., Fujimura, A., Kaitsuka, T., & Tomizawa, K. (2014) · Human Molecular Genetics · doi:10.1093/hmg/ddu184 · Cited by 47
“Twelve SNPs in CDKAL1, including the three SNPs examined in the present study, have been associated with T2D [rs4712523 (23); rs4712524 (13); rs10440833 (24); rs6931514 (25); rs9465871 (26); rs9295474 (27); rs9356744, rs7773318, rs9465994 (28)].”
on behalf of the China Kadoorie Biobank Collaborative Group, Gan, W., Walters, R. G., Holmes, M. V., Bragg, F., Millwood, I. Y., Banasik, K., Chen, Y., Du, H., Iona, A., et al. (2016) · Diabetologia · doi:10.1007/s00125-016-3920-9 · Cited by 45
“Previous studies have reported that the majority of common variants are shared across different ethnic groups [24, 30, 47, 48].”
BackgroundPalit, S. P., Patel, R., Jadeja, S. D., RATHWA, N. N., Mahajan, A., Ramachandran, A. V., Dhar, M. K., Sharma, S., & Begum, R. (2020) · Scientific Reports · doi:10.1038/s41598-020-59845-z · Cited by 44
Silver, M. J., Chen, P., Li, R., Cheng, C., Wong, T. Y., Tai, E. S., Teo, Y., & Montana, G. (2013) · PLoS Genetics · doi:10.1371/journal.pgen.1003939 · Cited by 38
“after first round of quality control [52] and removal of monomorphic SNPs.”
BackgroundMethodInfluentialSelf-citationLi, Q., Wojciechowski, R., Simpson, C. L., Hysi, P. G., Verhoeven, V. J. M., Ikram, M. K., Höhn, R., Vitart, V., Hewitt, A. W., Oexle, K., et al. (2014) · Human Genetics · doi:10.1007/s00439-014-1500-y · Cited by 39
Self-citationGoyal, S., Tanigawa, Y., Zhang, W., Chai, J. F., Almeida, M., Sim, X., Lerner, M. R., Chainakul, J., Ramiu, J. G., Seraphin, C., et al. (2021) · Lipids in Health and Disease · doi:10.1186/s12944-021-01531-8 · Cited by 40
Self-citationHan, Y. Y., Dorajoo, R., Chang, X., Wang, L., Khor, C. C., Sim, X., Cheng, C., Shi, Y., Tham, Y. C., Zhao, W., et al. (2017) · Scientific Reports · doi:10.1038/s41598-017-18214-z · Cited by 38
Self-citationJordan, D. M., & Do, R. (2018) · Annual Review of Genomics and Human Genetics · doi:10.1146/annurev-genom-083117-021136 · Cited by 35
“Several examples exist of GWAS loci discovered in European cohorts failing to replicate in trans-ethnic cohorts or of trans-ethnic GWASs explaining less variance than GWASs performed on an ethnically homogeneous population (22, 38, 43, 61).”
BackgroundDissection of type 2 diabetes: a genetic perspective
Bonnefond, A., Florez, J. C., Loos, R. J. F., & Froguel, P. (2025) · The Lancet Diabetes & Endocrinology · doi:10.1016/s2213-8587(24)00339-5 · Cited by 44
Oei, L., Estrada, K., Duncan, E. L., Christiansen, C., Liu, C., Langdahl, B. L., Obermayer-Pietsch, B. M., Riancho, J. A., Prince, R. L., van Schoor, N. M., et al. (2013) · Bone · doi:10.1016/j.bone.2013.10.015 · Cited by 36
“When the linkage disequilibrium structure in the region differs across populations this may result in decreased power and lack of replication [74–77].”
BackgroundInvestigation on Cardiovascular Risk Prediction Using Genetic Information
Pu, L., Zhao, Z., & Zhang, Y. (2012) · IEEE Transactions on Information Technology in Biomedicine · doi:10.1109/titb.2012.2205009 · Cited by 37
Sohani, Z. N., Deng, W. Q., Paré, G., Meyre, D., Gerstein, H. C., & Anand, S. S. (2014) · Diabetologia · doi:10.1007/s00125-014-3354-1 · Cited by 35
“Four GWAS have been conducted in South Asians [14–17], which collectively identified nine SNPs ( p<5×10).”
InfluentialSgD-CNV, a database for common and rare copy number variants in three Asian populations
Xu, H., Poh, W.-T., Sim, X., Ong, R. T., Suo, C., Tay, W.-T., Khor, C. C., Seielstad, M. T., Liu, J., Aung, T., et al. (2011) · Human Mutation · doi:10.1002/humu.21601 · Cited by 34
Self-citationAssociation Analysis of Genetic Variants with Type 2 Diabetes in a Mongolian Population in China
Bai, H., Liu, H., Suyalatu, S., Guo, X., Chu, S., Chen, Y., Lan, T., Borjigin, B., Orlov, Y. L., Posukh, O. L., et al. (2015) · Journal of Diabetes Research · doi:10.1155/2015/613236 · Cited by 33
“SNPs found to be associated with T2D in Asian populations, rs1048886 (C6orf57) [5], rs4402960 (IGF2BP2) [28], rs5015480 (HHEX, IDE), rs1359790 (SPRY2) [29], rs1552224 (CENTD2), rs3923113 (GRB14), rs5215 (KCNJ11), rs7903146 (TCF7L2) [6], rs10886471 (GRK5), and rs7403531 (RASGRP1) [30], were not replicated in our study.”
BackgroundAssociation of melatonin & MTNR1B variants with type 2 diabetes in Gujarat population
Patel, R., RATHWA, N. N., Palit, S. P., Ramachandran, A. V., & Begum, R. (2018) · Biomedicine & Pharmacotherapy · doi:10.1016/j.biopha.2018.04.058 · Cited by 32
Kuo, J. Z.-C., Sheu, W. H., Assimes, T. L., Hung, Y., Absher, D., Chiu, Y., Mak, J. T., Wang, J., Kwon, S., Hsu, C., et al. (2013) · Diabetologia · doi:10.1007/s00125-013-3047-1 · Cited by 31
“05, which followed the αs used in an earlier trans-ethnic study of type 2 diabetes mellitus [11].”
BackgroundMethodResultPatel, R., Palit, S. P., RATHWA, N. N., Ramachandran, A. V., & Begum, R. (2018) · Clinical Nutrition · doi:10.1016/j.clnu.2018.06.962 · Cited by 30
Genetic Risk Factors for Type 2 Diabetes: Insights from the Emerging Genomic Evidence
Ntzani, E., & Kavvoura, F. K. (2012) · Current Vascular Pharmacology · doi:10.2174/157016112799305030 · Cited by 29
Osada, U. N., Sunagawa, H., Terauchi, Y., & Ueda, S. (2016) · PLoS ONE · doi:10.1371/journal.pone.0154821 · Cited by 29
“Both of these pathways may be hampered in carriers of CDKAL1 risk variants, in which actually impaired insulin secretion is reported [18][19][8][20].”
BackgroundYamakawa‐Kobayashi, K., Natsume, M., Aoki, S., Nakano, S., Inamori, T., Kasezawa, N., & Goda, T. (2012) · BMC Medical Genetics · doi:10.1186/1471-2350-13-11 · Cited by 27
“Furthermore, additional GWAS for Japanese and Chinese populations were performed and new susceptibility loci were detected [24-28], some of which have also been confirmed in Caucasians as well as Asian populations [24,25,29].”
BackgroundPeter, I., McCaffery, J. M., Kelley-Hedgepeth, A., Hakonarson, H. H., Reís, S. E., Wagenknecht, L. E., Kopin, A. S., Huggins, G. S., & Study, F. T. G. S. O. T. L. A. (2012) · Obesity · doi:10.1038/oby.2012.11 · Cited by 27
Replication of newly identified type 2 diabetes susceptible loci in Northwest Indian population
Sharma, V., Sharma, I., Sethi, I., Mahajan, A., Singh, G., Angural, A., Bhanwer, A. J. S., Dhar, M. K., Singh, V., Rai, E., et al. (2017) · Diabetes Research and Clinical Practice · doi:10.1016/j.diabres.2017.02.013 · Cited by 26
Chai, J. F., Raichur, S., Khor, I. W., Torta, F. T., Chew, W. S., Herr, D. R., Ching, J., Kovalik, J. P., Khoo, C. M., Wenk, M. R., et al. (2019) · Human Molecular Genetics · doi:10.1093/hmg/ddz246 · Cited by 23
Self-citationLi, J., Lee, H. M., Wang, Y., Tong, A. H.-Y., Yip, K. Y.-L., Tsui, S. K., Lok, S., Ozaki, R., Luk, A. O. Y., Kong, A. P. S., et al. (2016) · Scientific Reports · doi:10.1038/srep35228 · Cited by 24
“Asian GWAS datasets, we noted that rs7636 , a synonymous SNP within Acetylcholinesterase ( AChE ), exhibited genome-wide significance for T2D in Asian but not Caucasian populations with an odd ratios of 1.85 (95% CI: 1.42–2.41, p : 5.00E-6) 39 .”
InfluentialJayant, S. S., Gupta, R., Rastogi, A., Agrawal, K., Sachdeva, N. K., Ram, S., Dutta, P. R., Bhadada, S. K., & Bhansali, A. K. (2022) · Diabetes & Metabolic Syndrome Clinical Research & Reviews · doi:10.1016/j.dsx.2022.102418 · Cited by 23
Srinivasan, S., Liju, S., Sathish, N., Siddiqui, M. K., Anjana, R. M., Pearson, E. R., Doney, A. S. F., Mohan, V., Radha, V., & Palmer, C. N. A. (2023) · Diabetes Care · doi:10.2337/dc23-0243 · Cited by 25
Liu, C., Ng, M. C. Y., Rybin, D. V., Adeyemo, A., Bielinski, S. J., Boerwinkle, E., Borecki, I. B., Cade, B. E., Chen, Y. I., Djoussé, L., et al. (2012) · Diabetologia · doi:10.1007/s00125-012-2656-4 · Cited by 23
Cheng, G., Xue, H., Luo, J. M., Jia, H., Zhang, L., Dai, J., & Buyken, A. E. (2017) · Scientific Reports · doi:10.1038/s41598-017-00453-9 · Cited by 24
Comparative Genome of GK and Wistar Rats Reveals Genetic Basis of Type 2 Diabetes
Liu, T., Li, H., Ding, G., Wang, Z., Chen, Y., Liu, L., Li, Y., & Li, Y. (2015) · PLoS ONE · doi:10.1371/journal.pone.0141859 · Cited by 25
Horikoshi, M., Pasquali, L., Wiltshire, S., Huyghe, J. R., Mahajan, A., Asimit, J. L., Ferreira, T. C., Locke, A. E., Robertson, N. R., Wang, X., et al. (2016) · Human Molecular Genetics · doi:10.1093/hmg/ddw048 · Cited by 23
Self-citationSzabó, M. I., Máté, B., Csép, K., & Benedek, T. (2017) · Biochemical Genetics · doi:10.1007/s10528-017-9827-4 · Cited by 23
Anand, S. S., Meyre, D., Paré, G., Bailey, S. D., Xie, C., Zhang, X., Montpetit, A., Desai, D., Bosch, J., Mohan, V., et al. (2013) · Diabetes Care · doi:10.2337/dc12-2553 · Cited by 23
“Other investigators have evaluated T2DM genetic associations across multiple ethnicities with conflicting results, possibly attributable to limited statistical power, allelic heterogeneity, or linkage disequilibrium differences (20,21).”
Bhagwandin, C., Ashbeck, E. L., Whalen, M. B., Bandola-Simon, J. M., Roche, P. A., Szajman, A., Truong, S. M., Wertheim, B. C., Klimentidis, Y. C., Ishido, S., et al. (2018) · PLoS ONE · doi:10.1371/journal.pone.0204898 · Cited by 23
Efficiency of trans-ethnic genome-wide meta-analysis and fine-mapping
Ong, R. T., Wang, X., Liu, X., & Teo, Y. (2012) · European Journal of Human Genetics · doi:10.1038/ejhg.2012.88 · Cited by 20
Self-citationChikowore, T., van Zyl, T., Feskens, E. J. M., & Conradie, K. R. (2016) · Diabetes Research and Clinical Practice · doi:10.1016/j.diabres.2016.09.019 · Cited by 19
Klimentidis, Y. C., Lemas, D. J., Wiener, H. W., O’Brien, D. M., Havel, P. J., Stanhope, K. L., Hopkins, S. E., Tiwari, H. K., & Boyer, B. B. (2013) · Journal of Diabetes · doi:10.1111/1753-0407.12093 · Cited by 19
“Both CDKAL1 and HHEX variants were strongly associated with T2D and insulin secretion in several south-east Asian cohorts and among Pima Indians, respectively.(47,48) Our finding that the risk allele for the HHEX SNP as identified in GWAS corresponds to the “protective” allele in this sample is not uncommon in genetic…”
BackgroundQiu, J., Moore, J. H., & Darabos, C. (2016) · Genetic Epidemiology · doi:10.1002/gepi.21964 · Cited by 18
“E-mail: JHMoore@upenn.edu developing countries and 20% in developed countries by 2030 [Shaw et al., 2010; Zhao et al., 2012].”
BackgroundDissecting the Brain/Islet Axis in Metabesity
Fuente-Martín, E., Mellado‐Gil, J. M., Cobo‐Vuilleumier, N., Martín‐Montalvo, A., Romero‐Zerbo, S., Contreras, I. D., Hmadcha, A., Soria, B., Bermudo, F. M., Reyes, J. C., et al. (2019) · Genes · doi:10.3390/genes10050350 · Cited by 17
Hints of Unique Genetic Effects for Type 2 Diabetes in India
Holliday, E. G. (2013) · Diabetes · doi:10.2337/db12-1836 · Cited by 17
Wang, X., Liu, X., Sim, X., Xu, H., Khor, C. C., Ong, R. T., Tay, W.-T., Suo, C., Poh, W.-T., Ng, D. P. K., et al. (2011) · European Journal of Human Genetics · doi:10.1038/ejhg.2011.219 · Cited by 17
Self-citationVerma, G., Bowen, A., Gheibi, S., Hamilton, A., Muthukumar, S., Cataldo, L. R., Asplund, O., Esguerra, J. L. S., Karagiannopoulos, A., Lyons, C., et al. (2022) · Journal of Biological Chemistry · doi:10.1016/j.jbc.2022.101692 · Cited by 17
Genetic Determinants of Type 2 Diabetes in Asians
Qi, Q., Wang, X., Strizich, G., & Wang, T. (2015) · International Journal of Diabetology & Vascular Disease Research · doi:10.19070/2328-353x-si01001 · Cited by 19
“In addition, a GWAS of T2D in multi-ethnic cohorts from Southeast Asia (including Chinese, Malays and Asian Indians) observed consistent direction of effect for many T2D SNPs identified in European populations [85].”
BackgroundChen, Z., Pereira, M. A., Seielstad, M. T., Koh, W., Tai, E. S., Teo, Y.-Y., Liu, J., Hsu, C., Wang, R., Odegaard, A., et al. (2014) · PLoS ONE · doi:10.1371/journal.pone.0087762 · Cited by 15
“Since 2007, genomewide association studies (GWAS) have reported at least 57 additional thoroughly replicated genetic susceptibility loci harboring common variants for T2D [38–57].”
BackgroundSelf-citationXu, K., Jiang, L., Zhang, M., Zheng, X., Gu, Y., Wang, Z., Cai, Y., Dai, H., Shi, Y., Zheng, S., et al. (2016) · Medicine · doi:10.1097/md.0000000000003604 · Cited by 15
Ding, Q., Tan, A. L. M., Parra, E. J., Cruz, M., Sim, X., Teo, Y., Long, J., AlSafar, H. S., Petretto, E. G., Tai, E. S., et al. (2020) · Journal of Human Genetics · doi:10.1038/s10038-019-0720-3 · Cited by 14
“…0.586 Mexico City 2 2016 Mexico Mexican 140 448 306 166 415 306 0.592 0.578 Scott et al. 2007 Finland European 41 808 311 36 854 283 0.616 0.605 Sim et al. 2011 China Asian 190 864 907 255 852 833 0.666 0.647 correlation with serum glucose and insulin level across obese mice samples (r= 0.77…”
MethodInfluentialSelf-citationThe New Perspectives on Genetic Studies of Type 2 Diabetes and Thyroid Diseases
Xu, M., Bi, Y., Cui, B., Hong, J., Wang, W., & Ning, G. (2013) · Current Genomics · doi:10.2174/138920213804999138 · Cited by 14
“Since the first GWAS, the number of susceptibility loci for T2D has grown up to more than 50 (Table 1) [22-45].”
BackgroundChikowore, T., Conradie, K. R., Towers, G. W., & van Zyl, T. (2015) · OMICS A Journal of Integrative Biology · doi:10.1089/omi.2015.0116 · Cited by 13
Liu, H., He, J., Zhang, Q., Lv, W., Xia, X., Sun, C., Zhang, W., & Deng, H. (2017) · Molecular Genetics and Genomics · doi:10.1007/s00438-017-1381-6 · Cited by 13
“Another subset of 13 SNPs had not been reported to be associated with T2D but their annotated genes were mentioned as T2D associated in previous studies (details in the Supplementary Table S6) (Sim et al. 2011; Voight et al. 2011; Mahajan et al. 2014; Cook and Morris 2016).”
Admixture mapping and fine-mapping of type 2 diabetes susceptibility loci in African American women
Uribe‐Salazar, J. M., Palmer, J. R., Haddad, S. A., Rosenberg, L. A., & Ruiz-Narváez, E. (2018) · Journal of Human Genetics · doi:10.1038/s10038-018-0503-2 · Cited by 14
Lam, V. K. L., Ronald, C. W., Lee, H. M., Hu, C., Park, K. S., Furuta, H., Wang, Y., Tam, C. H. T., Sim, X., Ng, D. P. K., et al. (2013) · PLoS ONE · doi:10.1371/journal.pone.0062378 · Cited by 11
“Notwithstanding some heterogeneity of effect sizes possibly due to differences in population-specific LD architecture, allele frequency [18] and factors such as lifestyle and environment [22], rs1583645 of CPE and rs6583813 of IDE showed consistent associations with T2D on meta-analysis of multiple East Asian cohorts.”
BackgroundResultSelf-citationLi, Y., Gong, G., Geng, H., Yang, Z., Zhou, C., Xu, J., Qian, Y., Wang, X., & Chen, A. (2014) · Endocrine Journal · doi:10.1507/endocrj.ej14-0297 · Cited by 12
Contiguous mutation syndrome in the era of high‐throughput sequencing
Langouët, M., Siquier-Pernet, K., Sanquer, S., Bôle‐Feysot, C., Nitschké, P., Boddaert, N., Münnich, A., Mancini, G. M. S., Barouki, R., Amiel, J., et al. (2015) · Molecular Genetics & Genomic Medicine · doi:10.1002/mgg3.134 · Cited by 12
“associated with obesity in Chinese population (Sell et al. 1998; Li et al. 2003; Sim et al. 2011; Huang et al. 2012; Sanghera and Blackett 2012; Zhu et al. 2012).”
Common and rare exonic MUC5B variants associated with type 2 diabetes in Han Chinese
Chen, G., Zhang, Z., Adebamowo, S. N., Liu, G., Adeyemo, A., Zhou, Y., Doumatey, A. P., Wang, C., Zhou, J., Yan, W., et al. (2017) · PLoS ONE · doi:10.1371/journal.pone.0173784 · Cited by 11
Risk Prediction Using Genome-Wide Association Studies on Type 2 Diabetes
Choi, S., Bae, S., & Park, T. (2016) · Genomics & Informatics · doi:10.5808/gi.2016.14.4.138 · Cited by 12
“Some genes (AGR3, C2CD4B, C6orf57, CAMK1D, DNER, IGF2BP2, KCNJ11, KCNQ1, NXN, PLS1, and RGS7) were previously reported to be associated with T2D [44-53].”
BackgroundGenetic Architecture of Type 2 Diabetes
Prasad, R. B., & Groop, L. (2016) · Wiley eBooks · doi:10.1002/9781118924853.ch14 · Cited by 12
"Diabetes Associated Genes from the Dark Matter of the Human Proteome"
Narayanan, R. (2014) · MOJ Proteomics & Bioinformatics · doi:10.15406/mojpb.2014.01.00020 · Cited by 10
“The ORFs C6orf27 and C6orf47 were associated exclusively with type 1 diabetes [58-60], whereas ORF C6orf57 was associated with type 2 diabetes and CD40 ligand [61,62].”
BackgroundDirect‐to‐consumer genetic testing in China and its role in GWAS discovery and replication
Kang, K., Sun, X., Wang, L., Yao, X., Tang, S., Deng, J., Wu, X., Yang, C., & Chen, G. (2020) · Quantitative Biology · doi:10.1007/s40484-020-0209-2 · Cited by 11
Chai, J. F., Kao, S. L., Wang, C., Lim, V., Khor, I. W., Dou, J., Podgornaia, A., Chothani, S. P., Cheng, C., Sabanayagam, C., et al. (2020) · The Journal of Clinical Endocrinology & Metabolism · doi:10.1210/clinem/dgaa658 · Cited by 11
Self-citationKeaton, J. M., Hellwege, J. N., Ng, M. C. Y., Palmer, N. D., Pankow, J. S., Fornage, M., Wilson, J. G., Correa, A., Rasmussen‐Torvik, L. J., Rotter, J. I., et al. (2016) · Pacific Symposium on Biocomputing (PSB) · doi:10.1142/9789813207813_0024 · Cited by 10
Soltani, G., Hatefi, Z., Salehi, A. R., Khosravi, S., Ghiasi, M. R., Teke, K., Aminorroaya, A., & Salehi, R. (2018) · Advanced Biomedical Research · doi:10.4103/abr.abr_144_17 · Cited by 10
“[19-22] Carrying risk variants of CDKAL1 may attenuate normal functioning of CDKAL1 resulting in impaired insulin secretion.[16,23] Many studies have shown that rs7754840 in CDKAL1 gene is associated with risk of type 2 diabetes.”
BackgroundWan, L., Zhu, L., Huang, H., He, Y., Lv, J., Li, W., Chen, L., & He, W. (2017) · Journal of Biomedical Informatics · doi:10.1016/j.jbi.2017.09.006 · Cited by 10
Gómez-Marín, E., Marjanović, M. P., Zarzuela, L., Basurto-Cayuela, L., Guerrero-Martinez, J. A., Arribas, G., Yerbes, R., Ceballos-Chávez, M., Rodríguez‐Paredes, M., Tomé, M., et al. (2022) · Nucleic Acids Research · doi:10.1093/nar/gkac766 · Cited by 10
Characterizing the genetic risk for Type 2 diabetes in a Malaysian multi‐ethnic cohort
Abdullah, N., Murad, N. A. A., Attia, J., Oldmeadow, C. J., Hanif, E. A. M., Syafruddin, S. E., Jalal, N. A., Ismail, N., Ishak, M., Jamal, R., et al. (2015) · Diabetic Medicine · doi:10.1111/dme.12735 · Cited by 9
Association of serine racemase gene variants with type 2 diabetes in the C hinese H an population
Zhang, S., Xiao, J., Ren, Q., Han, X., Tang, Y. C., Yang, W., Zhou, X., & Ji, L. (2013) · Journal of Diabetes Investigation · doi:10.1111/jdi.12145 · Cited by 9
Metadata
- Authors
- Sim, X., Ong, R. T.-H., Suo, C., Tay, W.-T., Liu, J., Ng, D. P.-K., Boehnke, M., Chia, K.-S., Wong, T.-Y., Seielstad, M., Teo, Y.-Y., & Tai, E.-S.
- Affiliations
- National University of Singapore (SG)
- Agency for Science, Technology and Research (SG)
- Singapore National Eye Center (SG)
- University of Michigan (US)
- The University of Melbourne (AU)
- Corresponding author
- Teo, Yik-Ying
- Tai, E-Shyong
- ORCID
- Venue
- PLoS Genetics
- Publisher
- Public Library of Science (PLoS)
- Published
- 2011-04-07
- Volume
- 7
- Issue
- 4
- Pages
- e1001363
- ISSN
- 1553-7390 (ISSN-L)
- 1553-7404
- PMC
- PMC3072366
- OpenAlex
- W2025086473
- Cited by
- 152
- References
- 67
- Citations by year
- 2026: 2 · 2025: 3 · 2024: 4 · 2023: 3 · 2022: 6 · 2021: 9 · 2020: 9 · 2019: 5 · 2018: 14 · 2017: 9 · 2016: 15 · 2015: 12 · 2014: 19 · 2013: 19 · 2012: 17
- FWCI
- 12.17
- Type
- journal article
- Language
- en
- Open access
- gold
- doi.org
- Licence
- cc-by
- Locations
- PLoS Genetics (publishedVersion, cc-by)
- Europe PMC (PubMed Central) (publishedVersion, cc-by)
- PubMed Central (publishedVersion, cc-by)
- PubMed (publishedVersion)
- National University of Singapore (submittedVersion)
- RePEc: Research Papers in Economics (submittedVersion)
- DOAJ (DOAJ: Directory of Open Access Journals) (submittedVersion, cc-by-sa)
- eScholarship (California Digital Library) (submittedVersion)
- eScholarship (California Digital Library) (submittedVersion, cc-by)
- Figshare (submittedVersion, cc-by)
- Minerva Access (University of Melbourne) (submittedVersion, cc-by)
- Funders
- National Research Foundation (03/1/27/18/216)
- National University of Singapore
- National Research Foundation Singapore (NRF-RF-2010-05)
- Genome Institute of Singapore
- Medical Research Council
- National Medical Research Council (09/1/35/19/616, NMRC/STaR/0003/2008, 03/1/27/18/216, 08/1/35/19/550, 0796/2003, STAR/0003/2008)
- Biomedical Research Council (08/1/35/19/550, 03/1/27/18/216, 0796/2003, 09/1/35/19/616)
- National Human Genome Research Institute (R56HG000376, R01HG000376)
- Topics
- Life Sciences › Biochemistry, Genetics and Molecular Biology › Genetics › Genetic Associations and Epidemiology
- Life Sciences › Biochemistry, Genetics and Molecular Biology › Genetics › Genetic Mapping and Diversity in Plants and Animals
- Life Sciences › Biochemistry, Genetics and Molecular Biology › Genetics › Diabetes and associated disorders
- Keywords
- type 2 diabetes, genetic susceptibility loci, multi-ethnic cohort, Chinese, Malay language, Asian Indians, CDKAL1, population-specific variants, allelic heterogeneity, linkage disequilibrium, fine mapping, genetic architecture
- MeSH terms
- Adult, Aged, Asia, Southeastern, Diabetes Mellitus, Type 2, Female, Humans, Male, Middle Aged, tRNA Methyltransferases, Linkage Disequilibrium, Case-Control Studies, Kinesins, Genetic Predisposition to Disease, Polymorphism, Single Nucleotide, Cyclin-Dependent Kinase 5, Genome-Wide Association Study, Genetic Loci
About these checks
Registry, retraction, Cites and statistics results are computed, not judged, with one exception: a printed reference that no index lists is read once by a model before it counts as a citation error. Claims are extracted by a model and kept only when their quote appears verbatim in the text; each cited source is then checked, with a model’s help, for whether it says what the claim relies on. Those verdicts can be wrong — read the claim’s quote and the cited source before relying on one.
Statistics and arithmetic are recomputed, not judged.
Confidence bands are shown only for fields calibrated on our annotated test set. None is calibrated yet, so no band is shown.
What counts as a claim ›How we measure confidence ›How we check this ›
Are you an author, or do you see a problem with this page? Request a review
