

The DOI matches its Crossref record; 35 of the 36 references it cites were found in a registry or an index.
Large-Scale Gene-Centric Analysis Identifies Novel Variants for Coronary Artery Disease
Open accessAbstract
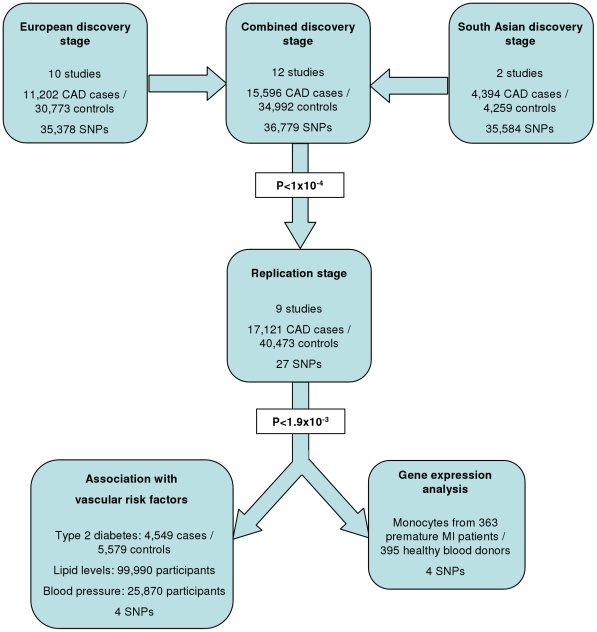
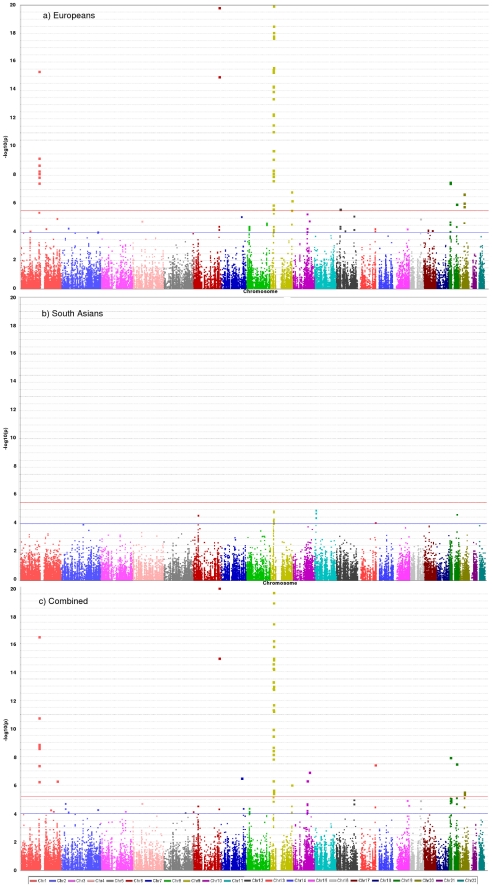
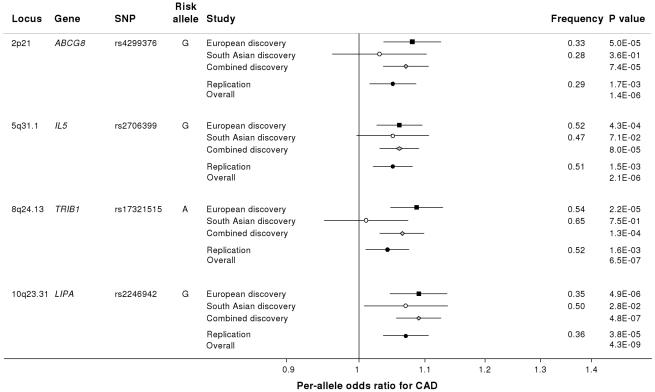
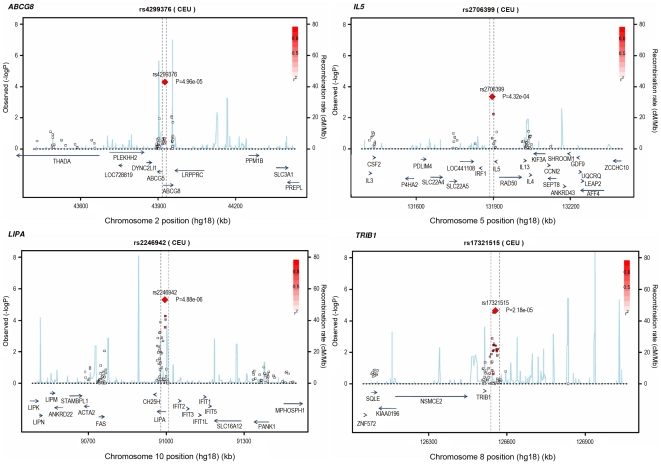
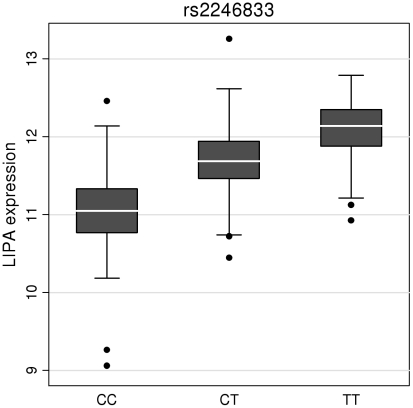
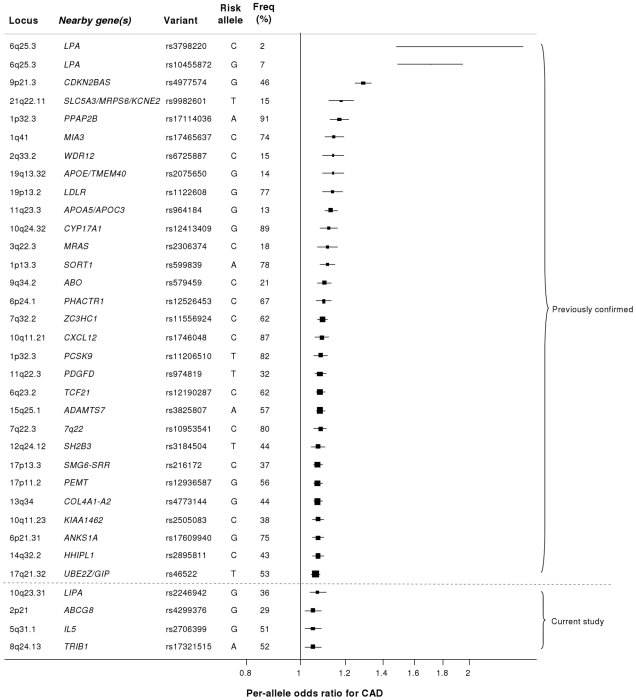
Coronary artery disease (CAD) has a significant genetic contribution that is incompletely characterized. To complement genome-wide association (GWA) studies, we conducted a large and systematic candidate gene study of CAD susceptibility, including analysis of many uncommon and functional variants. We examined 49,094 genetic variants in ∼2,100 genes of cardiovascular relevance, using a customised gene array in 15,596 CAD cases and 34,992 controls (11,202 cases and 30,733 controls of European descent; 4,394 cases and 4,259 controls of South Asian origin). We attempted to replicate putative novel associations in an additional 17,121 CAD cases and 40,473 controls. Potential mechanisms through which the novel variants could affect CAD risk were explored through association tests with vascular risk factors and gene expression. We confirmed associations of several previously known CAD susceptibility loci (eg, 9p21.3:p<10(-33); LPA:p<10(-19); 1p13.3:p<10(-17)) as well as three recently discovered loci (COL4A1/COL4A2, ZC3HC1, CYP17A1:p<5×10(-7)). However, we found essentially null results for most previously suggested CAD candidate genes. In our replication study of 24 promising common variants, we identified novel associations of variants in or near LIPA, IL5, TRIB1, and ABCG5/ABCG8, with per-allele odds ratios for CAD risk with each of the novel variants ranging from 1.06-1.09. Associations with variants at LIPA, TRIB1, and ABCG5/ABCG8 were supported by gene expression data or effects on lipid levels. Apart from the previously reported variants in LPA, none of the other ∼4,500 low frequency and functional variants showed a strong effect. Associations in South Asians did not differ appreciably from those in Europeans, except for 9p21.3 (per-allele odds ratio: 1.14 versus 1.27 respectively; P for heterogeneity = 0.003). This large-scale gene-centric analysis has identified several novel genes for CAD that relate to diverse biochemical and cellular functions and clarified the literature with regard to many previously suggested genes.
Overview
The claims and statistics of this paper haven’t been checked yet.
Run the check — free, no account needed. It reads the open-access text and checks the sources it cites.
Integrity signals
Registry
Cites
Statistics
Figures

Verification
Claims the paper makes
The claims and statistics of this paper haven’t been checked yet.
Run the check — free, no account needed. It reads the open-access text and checks the sources it cites.
Claims other papers make about this one
Each is checked against this paper’s own text: does it say what the citing paper says it does?
In the citing paper
“Since 2007, genomewide association analyses have identified more than 50 independent loci associated with the risk of coronary artery disease.7–15”
From Genetic Risk, Adherence to a Healthy Lifestyle, and Coronary Disease (2016) · cites this paper as [13]
Self-check
Percentages, sums and reported differences re-computed from the paper’s own numbers.
The self-check needs the paper’s full text.
Citations
Cites
PLINK: a tool set for whole-genome association and population-based linkage analyses.
Purcell, S., Neale, B., Todd-Brown, K., Thomas, L., Ferreira, M. A. R., Bender, D., Maller, J., Sklar, P., de Bakker, P. I. W., Daly, M. J., et al. (2007) · The American Journal of Human Genetics · doi:10.1086/519795 · Cited by 34,089
Genome-wide association study of 14,000 cases of seven common diseases and 3,000 shared controls
The Wellcome Trust Case Control Consortium, Management Committee, Burton, P. R., Clayton, D. G., Cardon, L. R., Craddock, N., Deloukas, P., Duncanson, A., Kwiatkowski, D. P., McCarthy, M. I., et al. (2007) · Nature · doi:10.1038/nature05911 · Cited by 9,442
Self-citationInflammation, Atherosclerosis, and Coronary Artery Disease
Hansson, G. K. (2005) · New England Journal of Medicine · doi:10.1056/nejmra043430 · Cited by 8,773
Hindorff, L. A., Sethupathy, P., Junkins, H. A., Ramos, E. M., Mehta, J. P., Collins, F. S., & Manolio, T. A. (2009) · Proceedings of the National Academy of Sciences · doi:10.1073/pnas.0903103106 · Cited by 4,013
Biological, clinical and population relevance of 95 loci for blood lipids
Teslovich, T. M., Musunuru, K., Smith, A. V., Edmondson, A. C., Stylianou, I. M., Koseki, M., Pirruccello, J. P., Ripatti, S., Chasman, D. I., Willer, C. J., et al. (2010) · Nature · doi:10.1038/nature09270 · Cited by 3,487
The Wellcome Trust Case Control Consortium, U.K.
Mossman, K. (2008) · Scientific American · doi:10.1038/scientificamerican0108-42a · Cited by 2,714
Genomewide Association Analysis of Coronary Artery Disease
Samani, N. J., Erdmann, J., Hall, A. S., Hengstenberg, C., Mangino, M., Mayer, B., Dixon, R. J., Meitinger, T., Braund, P., Wichmann, H.-E., et al. (2007) · New England Journal of Medicine · doi:10.1056/nejmoa072366 · Cited by 2,044
Large-scale association analysis identifies 13 new susceptibility loci for coronary artery disease
Cardiogenics, Schunkert, H., the CARDIoGRAM Consortium, König, I. R., Kathiresan, S., Reilly, M. P., Assimes, T. L., Holm, H., Preuss, M., Stewart, A. F. R., et al. (2011) · Nature Genetics · doi:10.1038/ng.784 · Cited by 1,866
Wellcome Trust Case Control Consortium, Zeggini, E., Scott, L. J., Saxena, R., Voight, B. F., Marchini, J. L., Hu, T., de Bakker, P. I., Abecasis, G. R., Almgren, P., et al. (2008) · Nature Genetics · doi:10.1038/ng.120 · Cited by 1,864
Genetic Variants Associated with Lp(a) Lipoprotein Level and Coronary Disease
Clarke, R., Peden, J. F., Hopewell, J. C., Kyriakou, T., Goel, A., Heath, S. C., Parish, S., Barlera, S., Franzosi, M. G., Rust, S., et al. (2009) · New England Journal of Medicine · doi:10.1056/nejmoa0902604 · Cited by 1,671
Cited by
Sorted by citations
A comprehensive 1000 Genomes–based genome-wide association meta-analysis of coronary artery disease
the CARDIoGRAMplusC4D Consortium (2015) · Nature Genetics · doi:10.1038/ng.3396 · Cited by 2,447
Self-citationLarge-scale association analysis identifies new risk loci for coronary artery disease
The CARDIoGRAMplusC4D Consortium, Deloukas, P., DIAGRAM Consortium, CARDIOGENICS Consortium, MuTHER Consortium, Wellcome Trust Case Control Consortium, Kanoni, S., Willenborg, C., Farrall, M., Assimes, T. L., et al. (2013) · Nature Genetics · doi:10.1038/ng.2480 · Cited by 1,614
Genetic Risk, Adherence to a Healthy Lifestyle, and Coronary Disease
Khera, A. V., Emdin, C. A., Drake, I., Natarajan, P., Bick, A. G., Cook, N. R., Chasman, D. I., Baber, U., Mehran, R., Rader, D. J., et al. (2016) · New England Journal of Medicine · doi:10.1056/nejmoa1605086 · Cited by 1,460
The immunology of atherosclerosis
Gisterå, A., & Hansson, G. K. (2017) · Nature Reviews Nephrology · doi:10.1038/nrneph.2017.51 · Cited by 982
Ference, B. A., Yoo, W., Alesh, I., Mahajan, N., Mirowska, K. K., Mewada, A., Kahn, J., Afonso, L., Williams, K. A., & Flack, J. M. (2012) · Journal of the American College of Cardiology · doi:10.1016/j.jacc.2012.09.017 · Cited by 898
Metadata
- Authors
- The IBC 50K CAD Consortium
- Affiliations
- QIMR Berghofer Medical Research Institute (AU)
- Corresponding author
- The IBC 50K CAD Consortium
- Venue
- PLoS Genetics
- Publisher
- Public Library of Science (PLoS)
- Published
- 2011-09-22
- Volume
- 7
- Issue
- 9
- Pages
- e1002260
- ISSN
- 1553-7390 (ISSN-L)
- 1553-7404
- PMC
- PMC3178591
- OpenAlex
- W1590005134
- Cited by
- 237
- References
- 36
- Citations by year
- 2026: 8 · 2025: 7 · 2024: 2 · 2023: 7 · 2022: 12 · 2021: 11 · 2020: 7 · 2019: 9 · 2018: 17 · 2017: 18 · 2016: 22 · 2015: 25 · 2014: 36 · 2013: 28 · 2012: 26
- FWCI
- 18.36
- Type
- journal article
- Language
- en
- Update notices
- correction (2012-08-14)
- Open access
- gold
- doi.org
- Locations
- PLoS Genetics (publishedVersion, cc-by)
- PubMed Central (publishedVersion, cc-by)
- PubMed (publishedVersion)
- Research Publications (Maastricht University) (publishedVersion, cc-by)
- Pure Amsterdam UMC (publishedVersion)
- EUR Research Repository (Erasmus University Rotterdam) (publishedVersion, other-oa)
- ENLIGHTEN (Jurnal Bimbingan dan Konseling Islam) (acceptedVersion)
- Archivio Istituzionale della Ricerca (Universita Degli Studi Di Milano) (submittedVersion, other-oa)
- Surrey Research Insight Open Access (The University of Surrey) (submittedVersion)
- Data Archiving and Networked Services (DANS) (submittedVersion)
- RePEc: Research Papers in Economics (submittedVersion)
- DOAJ (DOAJ: Directory of Open Access Journals) (submittedVersion, cc-by-sa)
- Utrecht University Repository (Utrecht University) (submittedVersion, other-oa)
- UCL Discovery (University College London) (submittedVersion)
- Figshare (submittedVersion, cc-by)
- Leicester Research Archive (University of Leicester) (submittedVersion, other-oa)
- Site cant be reached (submittedVersion, cc-by)
- Research Explorer (The University of Manchester) (submittedVersion)
- SERVAL (Université de Lausanne) (submittedVersion)
- Spiral (Imperial College London) (submittedVersion, other-oa)
- Hirsla (Landspítali University Hospital) (submittedVersion)
- Radboud Repository (Radboud University) (submittedVersion, other-oa)
- Research Publications (Maastricht University) (submittedVersion, other-oa)
- Funders
- AstraZeneca
- GlaxoSmithKline
- University of Pennsylvania
- Wellcome Trust (090532)
- National Institute for Health and Care Research (RP-PG-0310-1002, CL-2010-11-001, PG-0310-1002)
- British Heart Foundation (LSHM-CT-2007-037273, RG/09/12/28096, RP-PG-0310-1002, PG-0310-1002, RG/08/014/24067)
- University of Cambridge
- European Commission (201668, LSHM-CT-2007–037273, LSHM-CT 2006–037593, 28,29, LSHM-CT-2004-503485, 57,58)
- Fondation Leducq (05-CVD)
- ZonMw
- Bundesministerium für Bildung und Forschung (01GS0834)
- College ter Beoordeling van Geneesmiddelen
- Nederlandse Organisatie voor Wetenschappelijk Onderzoek (2001.064)
- Hjärt-Lungfonden
- Karolinska Institutet
- Knut och Alice Wallenbergs Stiftelse
- Novo Nordisk
- Stockholms Läns Landsting (560283)
- Top Institute Pharma
- KWF Kankerbestrijding
- Center for Translational Molecular Medicine
- Universität Ulm
- Medical Research Council (09/12)
- World Cancer Research Fund
- Agentschap NL
- Münchner Zentrum für Gesundheitswissenschaften
- National Heart, Lung, and Blood Institute
- Topics
- Life Sciences › Biochemistry, Genetics and Molecular Biology › Genetics › Genetic Associations and Epidemiology
- Health Sciences › Medicine › Cardiology and Cardiovascular Medicine › Cardiovascular Health and Risk Factors
- Life Sciences › Immunology and Microbiology › Immunology › Atherosclerosis and Cardiovascular Diseases
- Keywords
- coronary artery disease, genetic susceptibility, candidate gene association, novel genetic variants, 9p21.3, LPA, LIPA, TRIB1, ABCG5/ABCG8, CYP17A1, low-frequency variants, functional variants, South Asian populations, European populations, replication, gene expression, serum lipids
- MeSH terms
- Adult, Aged, Alleles, Coronary Artery Disease, Female, Humans, Male, Middle Aged, Risk, Genetic Variation, Case-Control Studies, Genetic Predisposition to Disease, Polymorphism, Single Nucleotide, White People, Asian People, Genome-Wide Association Study
About these checks
Registry, retraction, Cites and statistics results are computed, not judged, with one exception: a printed reference that no index lists is read once by a model before it counts as a citation error. Claims are extracted by a model and kept only when their quote appears verbatim in the text; each cited source is then checked, with a model’s help, for whether it says what the claim relies on. Those verdicts can be wrong — read the claim’s quote and the cited source before relying on one.
Statistics and arithmetic are recomputed, not judged.
Confidence bands are shown only for fields calibrated on our annotated test set. None is calibrated yet, so no band is shown.
What counts as a claim ›How we measure confidence ›How we check this ›
Are you an author, or do you see a problem with this page? Request a review
