

The DOI matches its Crossref record; 41 of the 41 references it cites were found in a registry or an index.
Ancestral Components of Admixed Genomes in a Mexican Cohort
Open accessAbstract
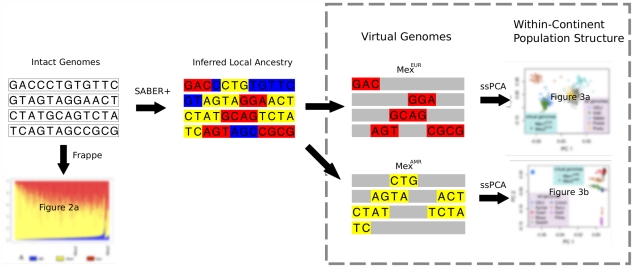
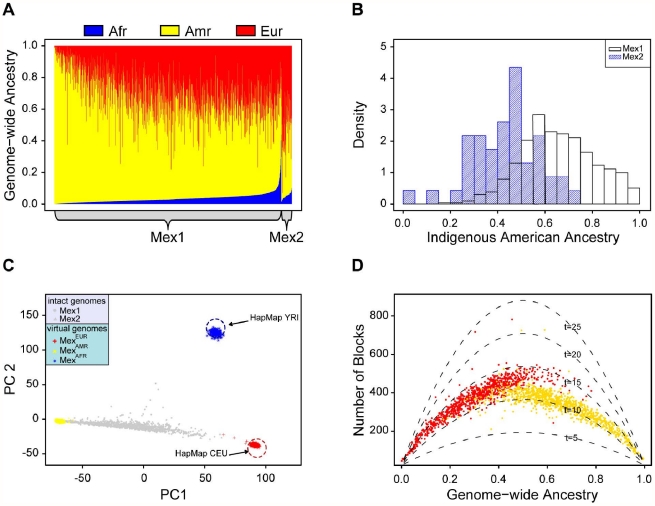
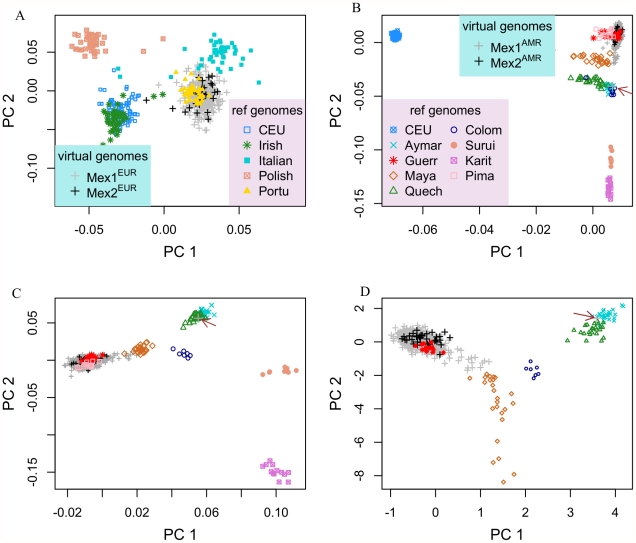
For most of the world, human genome structure at a population level is shaped by interplay between ancient geographic isolation and more recent demographic shifts, factors that are captured by the concepts of biogeographic ancestry and admixture, respectively. The ancestry of non-admixed individuals can often be traced to a specific population in a precise region, but current approaches for studying admixed individuals generally yield coarse information in which genome ancestry proportions are identified according to continent of origin. Here we introduce a new analytic strategy for this problem that allows fine-grained characterization of admixed individuals with respect to both geographic and genomic coordinates. Ancestry segments from different continents, identified with a probabilistic model, are used to construct and study "virtual genomes" of admixed individuals. We apply this approach to a cohort of 492 parent-offspring trios from Mexico City. The relative contributions from the three continental-level ancestral populations-Africa, Europe, and America-vary substantially between individuals, and the distribution of haplotype block length suggests an admixing time of 10-15 generations. The European and Indigenous American virtual genomes of each Mexican individual can be traced to precise regions within each continent, and they reveal a gradient of Amerindian ancestry between indigenous people of southwestern Mexico and Mayans of the Yucatan Peninsula. This contrasts sharply with the African roots of African Americans, which have been characterized by a uniform mixing of multiple West African populations. We also use the virtual European and Indigenous American genomes to search for the signatures of selection in the ancestral populations, and we identify previously known targets of selection in other populations, as well as new candidate loci. The ability to infer precise ancestral components of admixed genomes will facilitate studies of disease-related phenotypes and will allow new insight into the adaptive and demographic history of indigenous people.
Overview
The claims and statistics of this paper haven’t been checked yet.
Run the check — free, no account needed. It reads the open-access text and checks the sources it cites.
Integrity signals
Registry
Cites
Statistics
Figures
Verification
Claims the paper makes
The claims and statistics of this paper haven’t been checked yet.
Run the check — free, no account needed. It reads the open-access text and checks the sources it cites.
Claims other papers make about this one
Each is checked against this paper’s own text: does it say what the citing paper says it does?
In the citing paper
“in previous work on admixed populations from Mexico [24], we have found that accurate local ancestry estimates can be obtained using imperfect ancestral populations (including CEU and YRI), as long as the haplotype phasing is accurate.”
From Genetic Architecture of Skin and Eye Color in an African-European Admixed Population (2013) · cites this paper as [24]
Self-check
Percentages, sums and reported differences re-computed from the paper’s own numbers.
The self-check needs the paper’s full text.
Citations
Cites
LIII. On lines and planes of closest fit to systems of points in space
Pearson, K. (1901) · The London Edinburgh and Dublin Philosophical Magazine and Journal of Science · doi:10.1080/14786440109462720 · Cited by 12,864
Principal components analysis corrects for stratification in genome-wide association studies
Price, A. L., Patterson, N. J., Plenge, R. M., Weinblatt, M. E., Shadick, N. A., & Reich, D. (2006) · Nature Genetics · doi:10.1038/ng1847 · Cited by 10,248
A Map of Recent Positive Selection in the Human Genome
Voight, B. F., Kudaravalli, S., Wen, X., & Pritchard, J. K. (2006) · PLoS Biology · doi:10.1371/journal.pbio.0040072 · Cited by 2,925
Genetic Structure of Human Populations
Rosenberg, N. A., Pritchard, J. K., Weber, J. L., Cann, H. M., Kidd, K. K., Zhivotovsky, L. A., & Feldman, M. W. (2002) · Science · doi:10.1126/science.1078311 · Cited by 2,222
Detecting recent positive selection in the human genome from haplotype structure
Sabeti, P. C., Reich, D. E., Higgins, J. M., Levine, H. Z. P., Richter, D. J., Schaffner, S. F., Gabriel, S. B., Platko, J. V., Patterson, N. J., McDonald, G. J., et al. (2002) · Nature · doi:10.1038/nature01140 · Cited by 2,106
Worldwide Human Relationships Inferred from Genome-Wide Patterns of Variation
Li, J. Z., Absher, D. M., Tang, H., Southwick, A. M., Casto, A. M., Ramachandran, S., Cann, H. M., Barsh, G. S., Feldman, M. W., Cavalli-Sforza, L. L., et al. (2008) · Science · doi:10.1126/science.1153717 · Cited by 1,915
Pathwise coordinate optimization
Friedman, J. H., Hastie, T. J., Höfling, H., & Tibshirani, R. J. (2007) · The Annals of Applied Statistics · doi:10.1214/07-aoas131 · Cited by 1,906
Osteoimmunology: shared mechanisms and crosstalk between the immune and bone systems
Takayanagi, H. (2007) · Nature Reviews Immunology · doi:10.1038/nri2062 · Cited by 1,878
A high-resolution recombination map of the human genome
Kong, A., Gudbjartsson, D. F., Sainz, J., Jonsdottir, G. M., Gudjonsson, S. A., Richardsson, B., Sigurdardottir, S. L., Barnard, J., Hallbeck, B., Másson, G., et al. (2002) · Nature Genetics · doi:10.1038/ng917 · Cited by 1,750
Browning, B. L., & Browning, S. R. (2009) · The American Journal of Human Genetics · doi:10.1016/j.ajhg.2009.01.005 · Cited by 1,640
Cited by
Sorted by citations
Wu, G. A., Prochnik, S. E., Jenkins, J. W., Salse, J., Hellsten, U., Murat, F., Perrier, X., Ruíz, M., Scalabrin, S., Terol, J., et al. (2014) · Nature Biotechnology · doi:10.1038/nbt.2906 · Cited by 698
The genetics of Mexico recapitulates Native American substructure and affects biomedical traits
Moreno-Estrada, A., Gignoux, C. R., Fernández-López, J. C., Zakharia, F., Sikora, M., Contreras, A. V., Acuña-Alonzo, V., Sandoval, K., Eng, C., Romero-Hidalgo, S., et al. (2014) · Science · doi:10.1126/science.1251688 · Cited by 478
Reconstructing the population genetic history of the Caribbean
Moreno-Estrada, A., Gravel, S., Zakharia, F., McCauley, J. L., Byrnes, J. K., Gignoux, C. R., Ortiz-Tello, P. A., Martínez, R. J., Hedges, D. J., Morris, R. W., et al. (2013) · PLoS Genetics · doi:10.1371/journal.pgen.1003925 · Cited by 327
Toward a new history and geography of human genes informed by ancient DNA
Pickrell, J. K., & Reich, D. (2014) · Trends in Genetics · doi:10.1016/j.tig.2014.07.007 · Cited by 276
Fast and accurate inference of local ancestry in Latino populations
Baran, Y., Paşaniuc, B., Sankararaman, S., Torgerson, D. G., Gignoux, C. R., Eng, C. S., Rodríguez-Cintrón, W., Chapela, R., Ford, J. G., Avila, P. C., et al. (2012) · Bioinformatics · doi:10.1093/bioinformatics/bts144 · Cited by 242
Interethnic admixture and the evolution of Latin American populations
Salzano, F. M., & Sans, M. (2014) · Genetics and Molecular Biology · doi:10.1590/s1415-47572014000200003 · Cited by 249
Detecting Structure of Haplotypes and Local Ancestry
Guan, Y. (2014) · Genetics · doi:10.1534/genetics.113.160697 · Cited by 216
Population Stratification in Genetic Association Studies
Hellwege, J. N., Keaton, J. M., Giri, A., Gao, X., Edwards, D. R. V., & Edwards, T. L. (2017) · Current Protocols in Human Genetics · doi:10.1002/cphg.48 · Cited by 232
A genomic perspective on HLA evolution
Meyer, D., Aguiar, V. R. C., Bitarello, B. D., Brandt, D. Y. C., & Nunes, K. (2017) · Immunogenetics · doi:10.1007/s00251-017-1017-3 · Cited by 190
Genetic Architecture of Skin and Eye Color in an African-European Admixed Population
Beleza, S., Johnson, N. A., Candille, S. I., Absher, D. M., Coram, M. A., Lopes, J., Campos, J., Araújo, I. I., Anderson, T. M., Vilhjálmsson, B. J., et al. (2013) · PLoS Genetics · doi:10.1371/journal.pgen.1003372 · Cited by 161
Self-citationGenetic structure characterization of Chileans reflects historical immigration patterns
Eyheramendy, S., Martínez, F. I., Manevy, F., Vial, C., & Repetto, G. M. (2015) · Nature Communications · doi:10.1038/ncomms7472 · Cited by 146
Unravelling the hidden ancestry of American admixed populations
Montinaro, F., Busby, G., Pascali, V. L., Myers, S., Hellenthal, G., & Capelli, C. (2015) · Nature Communications · doi:10.1038/ncomms7596 · Cited by 122
Reiner, A. P., Beleza, S. S., Franceschini, N., Auer, P. L., Robinson, J. G., Kooperberg, C. L., Peters, U., & Tang, H. (2012) · The American Journal of Human Genetics · doi:10.1016/j.ajhg.2012.07.023 · Cited by 128
Fast, accurate local ancestry inference with FLARE
Browning, S. R., Waples, R. K., & Browning, B. L. (2023) · The American Journal of Human Genetics · doi:10.1016/j.ajhg.2022.12.010 · Cited by 100
Kidd, J. M., Gravel, S., Byrnes, J., Moreno-Estrada, A., Musharoff, S., Bryc, K., Degenhardt, J. D., Brisbin, A., Sheth, V., Chen, R., et al. (2012) · The American Journal of Human Genetics · doi:10.1016/j.ajhg.2012.08.025 · Cited by 95
Adhikari, K., Mendoza‐Revilla, J., Chacón-Duque, J. C., Fuentes‐Guajardo, M., & Ruiz‐Linares, A. (2016) · Current Opinion in Genetics & Development · doi:10.1016/j.gde.2016.09.003 · Cited by 104
Galaverni, M., Caniglia, R., Pagani, L., Fabbri, E., Boattini, A., & Randi, E. (2017) · Molecular Biology and Evolution · doi:10.1093/molbev/msx169 · Cited by 101
Limited Evidence for Classic Selective Sweeps in African Populations
Granka, J. M., Henn, B. M., Gignoux, C. R., Kidd, J. M., Bustamante, C. D., & Feldman, M. W. (2012) · Genetics · doi:10.1534/genetics.112.144071 · Cited by 81
Browning, S. R., Grinde, K. E., Plantinga, A., Gogarten, S. M., Stilp, A. M., Kaplan, R. C., Avilés-Santa, L. M., Browning, B. L., & Laurie, C. C. (2016) · G3 Genes Genomes Genetics · doi:10.1534/g3.116.028779 · Cited by 72
Inferring ancestry from population genomic data and its applications
Padhukasahasram, B. (2014) · Frontiers in Genetics · doi:10.3389/fgene.2014.00204 · Cited by 68
The PHF21B gene is associated with major depression and modulates the stress response
Wong, M., Arcos‐Burgos, M., Liu, S., Velez, J. I., Yu, C., Baune, B. T., Jawahar, M. C., Arolt, V., Dannlowski, U., Chuah, A., et al. (2016) · Molecular Psychiatry · doi:10.1038/mp.2016.174 · Cited by 65
Leveraging population admixture to characterize the heritability of complex traits
Zaitlen, N., Pasaniuc, B., Sankararaman, S., Bhatia, G., Zhang, J., Gusev, A., Young, T., Tandon, A., Pollack, S., Vilhjálmsson, B. J., et al. (2014) · Nature Genetics · doi:10.1038/ng.3139 · Cited by 63
Thornton, T. A., & Bermejo, J. L. (2014) · Genetic Epidemiology · doi:10.1002/gepi.21819 · Cited by 60
Strong Selection at MHC in Mexicans since Admixture
Zhou, Q., Zhao, L., & Guan, Y. (2016) · PLoS Genetics · doi:10.1371/journal.pgen.1005847 · Cited by 62
Martin, E. R., Tunc, I., Liu, Z., Slifer, S. H., Beecham, A. H., & Beecham, G. W. (2017) · Genetic Epidemiology · doi:10.1002/gepi.22103 · Cited by 51
Korunes, K. L., & Goldberg, A. (2021) · PLOS Genetics · doi:10.1371/journal.pgen.1009374 · Cited by 51
Genomic approaches to identify hybrids and estimate admixture times in European wildcat populations
Mattucci, F., Galaverni, M., Lyons, L. A., Alves, P. C., Randi, E., Velli, E., Pagani, L., & Caniglia, R. (2019) · Scientific Reports · doi:10.1038/s41598-019-48002-w · Cited by 58
Contreras-Cubas, C., Sánchez-Hernández, B. E., Garcia‐Ortíz, H., Martínez-Hernández, A. G., Barajas-Olmos, F. M., Cid-Soto, M. A., Mendoza‐Caamal, E., Centeno-Cruz, F., Ortiz‐Cruz, G., Jiménez-López, J. C., et al. (2016) · PLoS ONE · doi:10.1371/journal.pone.0163248 · Cited by 48
Paşaniuc, B., Sankararaman, S., Torgerson, D. G., Gignoux, C. R., Zaitlen, N., Eng, C. S., Rodríguez-Cintrón, W., Chapela, R., Ford, J. G., Avila, P. C., et al. (2013) · Bioinformatics · doi:10.1093/bioinformatics/btt166 · Cited by 42
The genomic signatures of natural selection in admixed human populations
Cuadros-Espinoza, S., Laval, G., Quintana‐Murci, L., & Patin, É. (2022) · The American Journal of Human Genetics · doi:10.1016/j.ajhg.2022.02.011 · Cited by 41
The time and place of European admixture in Ashkenazi Jewish history
Xue, J. R., Lencz, T., Darvasi, A., Pe’er, I., & Carmi, S. (2017) · PLoS Genetics · doi:10.1371/journal.pgen.1006644 · Cited by 41
Ostrom, Q. T., Egan, K. M., Nabors, B., Gerke, T. A., Thompson, R. C., Olson, J. J., LaRocca, R. V., Chowdhary, S. A., Eckel‐Passow, J. E., Armstrong, G., et al. (2019) · International Journal of Cancer · doi:10.1002/ijc.32318 · Cited by 39
Bermúdez, V., Rojas, J., Martínez, M. S., Apruzzese, V., Chávez-Castillo, M., González, R., Torres, Y., Salazar, J. J., Bello, L., Áñez, R., et al. (2014) · International Scholarly Research Notices · doi:10.1155/2014/616271 · Cited by 36
Population inference from contemporary A merican craniometrics
Algee‐Hewitt, B. F. B. (2016) · American Journal of Physical Anthropology · doi:10.1002/ajpa.22959 · Cited by 40
Libiger, O., & Schork, N. J. (2013) · Frontiers in Genetics · doi:10.3389/fgene.2012.00322 · Cited by 32
Biswas, P., Villanueva, A., Soto‐Hermida, A., Duncan, J. L., Matsui, H., Borooah, S., Kurmanov, B., Richard, G., Khan, S. Y., Branham, K. E. H., et al. (2021) · PLoS Genetics · doi:10.1371/journal.pgen.1009848 · Cited by 32
Wolf outside, dog inside? The genomic make-up of the Czechoslovakian Wolfdog
Caniglia, R., Fabbri, E., Hulva, P., Bolfíková, B. Č., Jindřichová, M., Strønen, A. V., Dykyy, I. V., Camatta, A., Carnier, P., Randi, E., et al. (2018) · BMC Genomics · doi:10.1186/s12864-018-4916-2 · Cited by 33
Amezcua, L., Beecham, A. H., Delgado, S. R., Chinea, A. R., Burnett, M., Manrique, C. P., Gomez, R., Comabella, M., Montalbán, X., Ortega, M. R., et al. (2018) · Annals of Clinical and Translational Neurology · doi:10.1002/acn3.646 · Cited by 30
Sun, X., Chandar, A. K., Canto, M. I., Thota, P. N., Brock, M. V., Shaheen, N. J., Beer, D. G., Wang, J. S., Falk, G. W., Iyer, P. G., et al. (2017) · PLoS ONE · doi:10.1371/journal.pone.0184962 · Cited by 30
Enhanced Localization of Genetic Samples through Linkage-Disequilibrium Correction
Baran, Y., Quintela, I., Carracedo, Á., Paşaniuc, B., & Halperin, E. (2013) · The American Journal of Human Genetics · doi:10.1016/j.ajhg.2013.04.023 · Cited by 32
Orozco, A. C., Contreras, A. M. M., Velásquez, C., Uscátegui, R. M., Parra, M. V., Villada, F. A. P., Correa, L. M. M., Parra, B. E., Estrada, A., & Agudelo, G. M. (2014) · PubMed · doi:10.1590/s0120-41572014000400007 · Cited by 28
Enhanced Methods for Local Ancestry Assignment in Sequenced Admixed Individuals
Brown, R., & Paşaniuc, B. (2014) · PLoS Computational Biology · doi:10.1371/journal.pcbi.1003555 · Cited by 28
Genome-wide Analysis in Brazilians Reveals Highly Differentiated Native American Genome Regions
Mychaleckyj, J. C., Havt, A., Nayak, U., Pinkerton, R., Farber, E., CONCANNON, P. J., Lima, A. Â. M., & Guerrant, R. L. (2016) · Molecular Biology and Evolution · doi:10.1093/molbev/msw249 · Cited by 31
Yu, C., Arcos‐Burgos, M., Licinio, J., & Wong, M. (2017) · Translational Psychiatry · doi:10.1038/tp.2017.102 · Cited by 27
Genetic Ancestry Inference and Its Application for the Genetic Mapping of Human Diseases
Suarez-Pajes, E., Usera, A. D.-D., Marcelino-Rodríguez, I., Guillén‐Guío, B., & Flores, C. (2021) · International Journal of Molecular Sciences · doi:10.3390/ijms22136962 · Cited by 29
Jin, W., Li, R., Zhou, Y., & Xu, S. (2013) · European Journal of Human Genetics · doi:10.1038/ejhg.2013.265 · Cited by 26
Pathogenic EFHC 1 mutations are tolerated in healthy individuals dependent on reported ancestry
Subaran, R. L., Conte, J. M., Stewart, W. C. L., & Greenberg, D. A. (2014) · Epilepsia · doi:10.1111/epi.12864 · Cited by 23
Yelmen, B., Mondal, M., Marnetto, D., Pathak, A. K., Montinaro, F., Romero, I. G., Kivisild, T., Metspalu, M., & Pagani, L. (2019) · Molecular Biology and Evolution · doi:10.1093/molbev/msz037 · Cited by 23
Contreras-Cubas, C., Garcia‐Ortíz, H., Velázquez‐Cruz, R., Barajas-Olmos, F. M., Baca, P., Martínez-Hernández, A. G., Barbosa‐Cobos, R. E., Ramírez‐Bello, J., López-Hernández, M. A., Svyryd, Y., et al. (2019) · Scientific Reports · doi:10.1038/s41598-019-48451-3 · Cited by 21
Unique spectrum of GJB2 mutations in Mexico
Arenas‐Sordo, M. D. L. L., Menéndez, I., Hernández‐Zamora, E., Sırmacı, A., Gutiérrez-Tinajero, D. J., McGetrick, M. E., Murphy-Ruiz, P. C., Leyva-Juárez, X., Huesca-Hernández, F., Domínguez-Aburto, J., et al. (2012) · International Journal of Pediatric Otorhinolaryngology · doi:10.1016/j.ijporl.2012.08.005 · Cited by 20
Models, methods and tools for ancestry inference and admixture analysis
Yuan, K., Zhou, Y., Ni, X., Wang, Y., Liu, C., & Xu, S. (2017) · Quantitative Biology · doi:10.1007/s40484-017-0117-2 · Cited by 18
vonHoldt, B. M., Brzeski, K. E., Aardema, M. L., Schell, C. J., Rutledge, L. Y., Fain, S. R., Shutt, A. C., Linderholm, A. E., & Murphy, W. J. (2021) · Molecular Ecology · doi:10.1111/mec.16200 · Cited by 19
Modeling SNP array ascertainment with Approximate Bayesian Computation for demographic inference
Quinto-Cortés, C. D., Woerner, A. E., Watkins, J. C., & Hammer, M. F. (2018) · Scientific Reports · doi:10.1038/s41598-018-28539-y · Cited by 19
Genetic Analysis of 17 Y-STRs in a Mestizo Population from the Central Valley of Mexico
Santana, C., Noris, G., Meraz‐Ríos, M. A., Magaña, J. J., Calderon-Aranda, E. S., Muñoz, M. D. L., & Gómez, R. (2014) · Human Biology · doi:10.13110/humanbiology.86.4.0289 · Cited by 18
Spatial Localization of Recent Ancestors for Admixed Individuals
Yang, W.-Y., Platt, A., Chiang, C. W. K., Eskin, E., Novembre, J., & Paşaniuc, B. (2014) · G3 Genes Genomes Genetics · doi:10.1534/g3.114.014274 · Cited by 17
Santander, C. G., Molinaro, L., Mutti, G., Martínez, F. I., Mathe, J., da Silva, M. J. F., Caldon, M., Oteo‐García, G., Aldeias, V., Archer, W., et al. (2022) · BMC Ecology and Evolution · doi:10.1186/s12862-022-01999-7 · Cited by 17
Yu, C., Baune, B. T., Licinio, J., & Wong, M. (2017) · Scientific Reports · doi:10.1038/srep44389 · Cited by 17
vonHoldt, B. M., Hinton, J. W., Shutt, A. C., Murphy, S. M., Karlin, M., Adams, J. R., Waits, L. P., & Brzeski, K. E. (2022) · Science Advances · doi:10.1126/sciadv.abn7731 · Cited by 14
Vásquez‐Loarte, T., Trubnykova, M., & Guio, H. (2015) · BMC Genetics · doi:10.1186/s12863-015-0280-2 · Cited by 14
DNA fingerprinting in anthropological genetics: past, present, future
Crawford, M. H., & Beaty, K. G. (2013) · Investigative Genetics · doi:10.1186/2041-2223-4-23 · Cited by 13
Joint genotype‐ and ancestry‐based genome‐wide association studies in admixed populations
Szulc, P., Bogdan, M., Frommlet, F., & Tang, H. (2017) · Genetic Epidemiology · doi:10.1002/gepi.22056 · Cited by 13
Detecting Heterogeneity in Population Structure Across the Genome in Admixed Populations
McHugh, C., Brown, L., & Thornton, T. A. (2016) · Genetics · doi:10.1534/genetics.115.184184 · Cited by 14
Yu, C., Baune, B. T., Licinio, J., & Wong, M. (2017) · Psychiatry Research · doi:10.1016/j.psychres.2017.02.041 · Cited by 12
Admixture, Genetics and Complex Diseases in Latin Americans and US Hispanics
Soares‐Souza, G. B., Borda, V., Kehdy, F. S. G., & Tarazona‐Santos, E. (2018) · Current Genetic Medicine Reports · doi:10.1007/s40142-018-0151-z · Cited by 13
Mas-Sandoval, À., Arauna, L. R., Gouveia, M. H., Barreto, M. L., Horta, B. L., Lima‐Costa, M. F., Pereira, A. C., Salzano, F. M., Hünemeier, T., Tarazona‐Santos, E., et al. (2019) · Genome Biology and Evolution · doi:10.1093/gbe/evz161 · Cited by 10
Yu, C., Baune, B. T., Wong, M., & Licinio, J. (2017) · Journal of Affective Disorders · doi:10.1016/j.jad.2017.05.044 · Cited by 12
Investigation of short tandem repeats in major depression using whole-genome sequencing data
Yu, C., Baune, B. T., Wong, M., & Licinio, J. (2018) · Journal of Affective Disorders · doi:10.1016/j.jad.2018.02.046 · Cited by 11
Inter-individual genomic heterogeneity within European population isolates
Anagnostou, P., Dominici, V., Battaggia, C., Lisi, A., Sarno, S., Boattini, A., Calò, C. M., Francalacci, P., Vona, G., Tofanelli, S., et al. (2019) · PLoS ONE · doi:10.1371/journal.pone.0214564 · Cited by 10
Women in Neurosurgery: First Neurosurgeon in Latin America and Current Mexican Leaders
Beltrán, J. Q., Ogando‐Rivas, E., Nettel-Rueda, B., Velasco‐Campos, F., Navarro-Olvera, J. L., Aguado-Carrillo, G., Soriano-Sánchez, J. A., Alpízar-Aguirre, A., & Carrillo-Ruiz, J. D. (2021) · World Neurosurgery · doi:10.1016/j.wneu.2021.03.102 · Cited by 9
Genetic Admixture in the Culturally Unique Peranakan Chinese Population in Southeast Asia
Wu, D., Li, P. Y., Pan, B., Tiang, Z., Dou, J., Williantarra, I., Pribowo, A., Nurdiansyah, R., The SG Peranakan Project, Foo, R., et al. (2021) · Molecular Biology and Evolution · doi:10.1093/molbev/msab187 · Cited by 15
Association of vWA and TPOX Polymorphisms with Venous Thrombosis in Mexican Mestizos
Meraz‐Ríos, M. A., Majluf‐Cruz, A., Santana, C., Noris, G., Camacho-Mejorado, R., Acosta‐Saavedra, L. C., Calderon-Aranda, E. S., Hernández‐Juárez, J., Magaña, J. J., & Gómez, R. (2014) · BioMed Research International · doi:10.1155/2014/697689 · Cited by 9
Yorgov, D., Edwards, K. L., & Santorico, S. A. (2014) · BMC Proceedings · doi:10.1186/1753-6561-8-s1-s6 · Cited by 9
Salas-Martínez, M. G., Saldaña‐Alvarez, Y., Córdova, E. J., Mendiola-Soto, D. K., Cid-Soto, M. A., Luckie-Duque, A., Vicenteño-Ayala, H., Barajas-Olmos, F. M., Contreras-Cubas, C., Garcia‐Ortíz, H., et al. (2019) · PLoS ONE · doi:10.1371/journal.pone.0225030 · Cited by 10
Rare Functional Variants Associated with Antidepressant Remission in Mexican-Americans
Wong, M., Arcos‐Burgos, M., Liu, S., Licinio, A. W., Yu, C., Chin, E., Yao, W.-D., Lu, X., Bornstein, S. R., & Licinio, J. (2020) · Journal of Affective Disorders · doi:10.1016/j.jad.2020.10.027 · Cited by 8
Characterisation of genetic structure of the Mayan population in Guatemala by autosomal STR analysis
Martínez-González, L. J., Álvarez-Cubero, M. J., Saiz, M., Álvarez, J. C., Martínez‐Labarga, C., & Lorente, J. A. (2015) · Annals of Human Biology · doi:10.3109/03014460.2015.1069891 · Cited by 7
Impact of A118G Polymorphism on the Mu Opioid Receptor Function in Pain
Soto, E. J. L. (2013) · Journal of Pain & Relief · doi:10.4172/2167-0846.1000119 · Cited by 7
Adaptation and co‐adaptation of skin pigmentation and vitamin D genes in native Americans
Missaggia, B. O., Reales, G., Cybis, G. B., Hünemeier, T., & Bortolini, M. C. (2020) · American Journal of Medical Genetics Part C Seminars in Medical Genetics · doi:10.1002/ajmg.c.31873 · Cited by 8
Avadhanam, S., & Williams, A. L. (2022) · The American Journal of Human Genetics · doi:10.1016/j.ajhg.2022.06.016 · Cited by 8
Burguete-Argueta, N., Cruz, B. M. D. L., Camacho-Mejorado, R., Santana, C., Noris, G., López‐Bayghen, E., Arellano‐Galindo, J., Majluf‐Cruz, A., Meraz‐Ríos, M. A., & Gómez, R. (2015) · Annals of Human Biology · doi:10.3109/03014460.2015.1127424 · Cited by 6
Camacho-Mejorado, R., Noris, G., Santana, C., Magaña, J. J., Majluf‐Cruz, A., Arellano‐Galindo, J., de la Peña-Dı́az, A., Hernández‐Juárez, J., Calderon-Aranda, E. S., Meraz‐Ríos, M. A., et al. (2015) · Genetics and Molecular Research · doi:10.4238/2015.march.31.24 · Cited by 6
Barquera, R., Martínez-Álvarez, J. C., Hernández-Zaragoza, D. I., Bravo-Acevedo, A., Juárez-Nicolás, F., Arriaga-Perea, A. J., Vega-Martínez, M. D. R., Ortega-Yáñez, A., Benítez-Arvizu, G., Arrieta‐Bolaños, E., et al. (2019) · Human Immunology · doi:10.1016/j.humimm.2019.07.297 · Cited by 6
Isolated postaxial polydactyly: Epidemiologic characteristics from a multicenter birth defects study
Ortiz‐Cruz, G., Luna‐Muñoz, L., Arteaga‐Vázquez, J., & Mutchinick, O. M. (2019) · American Journal of Medical Genetics Part A · doi:10.1002/ajmg.a.61193 · Cited by 5
Mowry, C. B., Wilson, L. A., & vonHoldt, B. M. (2021) · Diversity · doi:10.3390/d13080372 · Cited by 5
“The number of dog ancestry block switches was used to infer the timing at which dog alleles first appeared in Carmine’s ancestral genome through gene flow [41] by rearranging the equation for diploid genomes:”
BackgroundMethodEvidence of epigenetic admixture in the Colombian population
Rawlik, K., Rowlatt, A., Sanabria‐Salas, M. C., Hernandez-Suarez, G. A., Serrano, M. L., Zabaleta, J., & Tenesa, A. (2016) · Human Molecular Genetics · doi:10.1093/hmg/ddw407 · Cited by 5
GENETIC STRUCTURE OF HUMAN POPULATION
Tang, H., & Tang, K. (2015) · WORLD SCIENTIFIC eBooks · doi:10.1142/9789814583312_0025 · Cited by 5
Orozco, A. C., Contreras, A. M. M., Uscátegui, R. M., Parra, M. V., Villada, F. A. P., Correa, L. M. M., Parra, B. E., Estrada, A., Agudelo, G. M., & Velásquez, C. (2014) · Biomédica · doi:10.7705/biomedica.v34i4.2246 · Cited by 4
Domínguez-Cruz, M. G., Muñoz, M. D. L., Totomoch-Serra, A., García‐Escalante, M. G., Valadéz-González, N., Pinto-Escalante, D. D. C., & Díaz-Badillo, Á. (2016) · Journal of Advances in Medicine and Medical Research · doi:10.9734/bjmmr/2016/28660 · Cited by 4
Admixture with indigenous people helps local adaptation: admixture-enabled selection in Polynesians
Isshiki, M., Naka, I., Kimura, R., Nishida, N., Furusawa, T., Natsuhara, K., Yamauchi, T., Nakazawa, M., Ishida, T., Inaoka, T., et al. (2021) · BMC Ecology and Evolution · doi:10.1186/s12862-021-01900-y · Cited by 4
Genetic structure in Finland and Sweden : aspects of population history and gene mapping
Salmela, E. (2012) · Työväentutkimus Vuosikirja · Cited by 5
Critical Issues in Genetic Association Studies
Prom‐Wormley, E. C., Adkins, A. E., Waldman, I. D., & Dick, D. M. (2017) · Wiley eBooks · doi:10.1002/9781119095910.ch12 · Cited by 4
Genomic evaluation considering the mosaic genome of the crossbred pig
Sevillano, C. A. (2018) · doi:10.18174/464062 · Cited by 4
Trujillo-Cáceres, S. J., Torres‐Sánchez, L., Burguete-García, A. I., Orihuela, Y. C. O., Vázquez‐Salas, R. A., Álvarez-Topete, E., & Gómez, R. (2019) · Oncotarget · doi:10.18632/oncotarget.26592 · Cited by 3
Multiple-Ancestor Localization for Recently Admixed Individuals
Margalit, Y., Baran, Y., & Halperin, E. (2015) · Lecture notes in computer science · doi:10.1007/978-3-662-48221-6_9 · Cited by 3
GeneOnEarth: Fitting Genetic PC Plots on the Globe
Torres-Sánchez, S., Medina-Medina, N., Gignoux, C. R., Abad‐Grau, M. M., & Burchard, E. G. (2013) · IEEE Transactions on Computational Biology and Bioinformatics · doi:10.1109/tcbb.2013.81 · Cited by 3
Perspectivas de la Ecología Molecular en un país megadiverso
Rodríguez-Correa, H. A., González‐Rodríguez, A., & Oyama, K. (2017) · Revista Mexicana de Biodiversidad · doi:10.1016/j.rmb.2017.10.002 · Cited by 3
A genealogy-based approach for revealing ancestry-specific structures in admixed populations
Tang, J., & Chiang, C. W. K. (2025) · The American Journal of Human Genetics · doi:10.1016/j.ajhg.2025.06.016 · Cited by 5
Hernández-Tobías, E. A., Torres‐Sánchez, L., Noris, G., Santana, C., Samano, M. R., Arellano‐Galindo, J., Arenas‐Sordo, M. D. L. L., Brooks, D., Rodríguez-Ventura, A. L., Meraz‐Ríos, M. A., et al. (2016) · Ethnicity & Disease · doi:10.18865/ed.26.4.477 · Cited by 2
The role of population genetics and its implications in the study of complex-Disease risk
Gómez, R. (2017) · Journal of genetics and molecular biology · doi:10.35841/genetics-molecular-biology.1.1.12-13 · Cited by 2
Pérez-Páramo, Y. X., Hernández‐Cabrera, F., Rojas‐Martínez, A., & Ortı́z-López, R. (2015) · Drug Metabolism and Personalized Therapy · doi:10.1515/dmpt-2015-0017 · Cited by 1
Reconstructing the Human Past using Ancient and Modern Genomes
Skoglund, P. (2013) · Uppsala University Publications (Uppsala University) · Cited by 1
Metadata
- Authors
- Johnson, N. A., Coram, M. A., Shriver, M. D., Romieu, I., Barsh, G. S., London, S. J., & Tang, H.
- Affiliations
- Stanford University (US)
- Stanford Medicine (US)
- Pennsylvania State University (US)
- Instituto Nacional de Salud Pública (MX)
- National Institutes of Health (US)
- Corresponding author
- Barsh, Gregory S.
- Tang, Hua
- Venue
- PLoS Genetics
- Publisher
- Public Library of Science (PLoS)
- Published
- 2011-12-15
- Volume
- 7
- Issue
- 12
- Pages
- e1002410
- ISSN
- 1553-7390 (ISSN-L)
- 1553-7404
- PMC
- PMC3240599
- OpenAlex
- W1984534730
- Cited by
- 114
- References
- 41
- Citations by year
- 2026: 1 · 2025: 1 · 2023: 2 · 2022: 6 · 2021: 8 · 2020: 3 · 2019: 10 · 2018: 6 · 2017: 15 · 2016: 13 · 2015: 11 · 2014: 17 · 2013: 14 · 2012: 7
- FWCI
- 7.58
- Type
- journal article
- Language
- en
- Open access
- gold
- doi.org
- Licence
- Locations
- PLoS Genetics (publishedVersion, public-domain)
- PubMed Central (publishedVersion, public-domain)
- PubMed (publishedVersion)
- RePEc: Research Papers in Economics (submittedVersion)
- DOAJ (DOAJ: Directory of Open Access Journals) (submittedVersion, cc-by-sa)
- Figshare (submittedVersion, cc-by)
- Funders
- U.S. Department of Health and Human Services
- Alfred P. Sloan Foundation
- National Institutes of Health
- National Human Genome Research Institute (T32HG000044)
- National Institute of General Medical Sciences (GM073059, R01GM073059)
- NHLBI Division of Intramural Research
- Topics
- Life Sciences › Biochemistry, Genetics and Molecular Biology › Genetics › Forensic and Genetic Research
- Life Sciences › Biochemistry, Genetics and Molecular Biology › Genetics › Genetic diversity and population structure
- Social Sciences › Anthropology › Race, Genetics, and Society
- Keywords
- admixture, biogeographic ancestry, Native American ancestry, African ancestry, European ancestry, Yucatán Peninsula, Mayans, African Americans, selection signatures, candidate loci, parent-offspring trios, population structure
- MeSH terms
- Black or African American, Demography, Ethnicity, Haplotypes, Hispanic or Latino, Humans, Mexico, Population, Selection, Genetic, Cohort Studies, Genome, Human, Evolution, Molecular, Polymorphism, Single Nucleotide, Principal Component Analysis, Black People, White People, American Indian or Alaska Native
About these checks
Registry, retraction, Cites and statistics results are computed, not judged, with one exception: a printed reference that no index lists is read once by a model before it counts as a citation error. Claims are extracted by a model and kept only when their quote appears verbatim in the text; each cited source is then checked, with a model’s help, for whether it says what the claim relies on. Those verdicts can be wrong — read the claim’s quote and the cited source before relying on one.
Statistics and arithmetic are recomputed, not judged.
Confidence bands are shown only for fields calibrated on our annotated test set. None is calibrated yet, so no band is shown.
What counts as a claim ›How we measure confidence ›How we check this ›
Are you an author, or do you see a problem with this page? Request a review
