

The DOI matches its Crossref record; 75 of the 75 references it cites were found in a registry or an index.
Networks of Neuronal Genes Affected by Common and Rare Variants in Autism Spectrum Disorders
Open accessAbstract
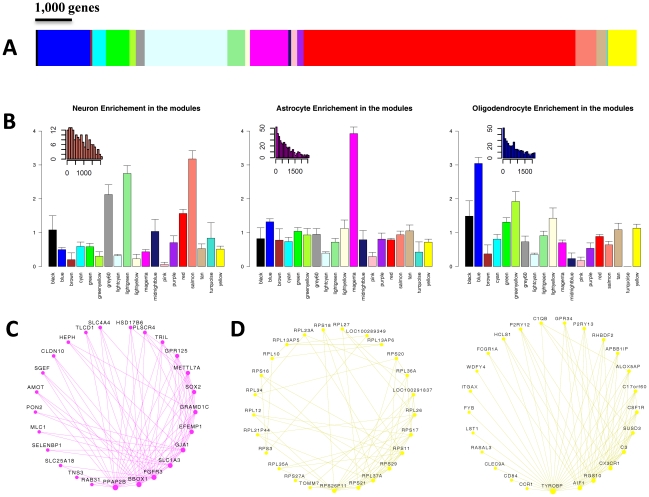
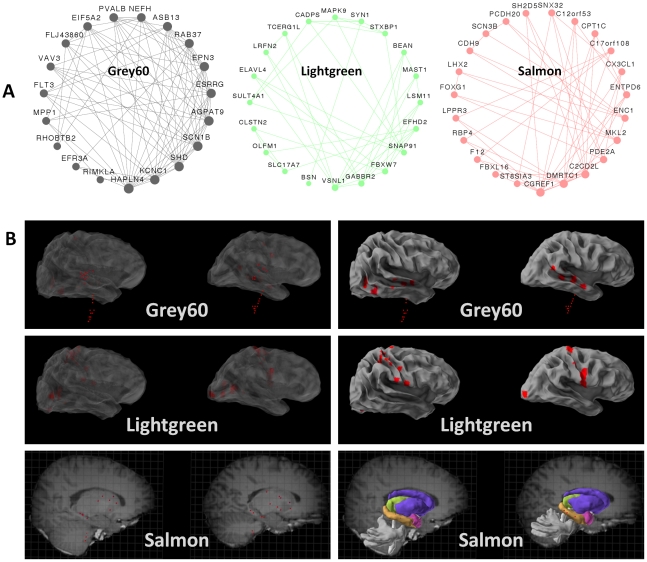
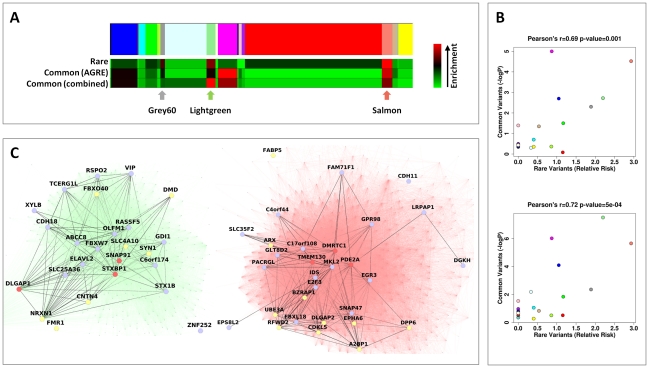
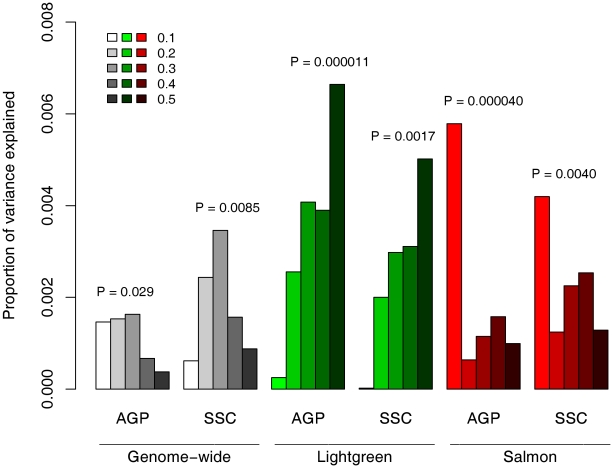
Autism spectrum disorders (ASD) are neurodevelopmental disorders with phenotypic and genetic heterogeneity. Recent studies have reported rare and de novo mutations in ASD, but the allelic architecture of ASD remains unclear. To assess the role of common and rare variations in ASD, we constructed a gene co-expression network based on a widespread survey of gene expression in the human brain. We identified modules associated with specific cell types and processes. By integrating known rare mutations and the results of an ASD genome-wide association study (GWAS), we identified two neuronal modules that are perturbed by both rare and common variations. These modules contain highly connected genes that are involved in synaptic and neuronal plasticity and that are expressed in areas associated with learning and memory and sensory perception. The enrichment of common risk variants was replicated in two additional samples which include both simplex and multiplex families. An analysis of the combined contribution of common variants in the neuronal modules revealed a polygenic component to the risk of ASD. The results of this study point toward contribution of minor and major perturbations in the two sub-networks of neuronal genes to ASD risk.
Overview
The claims and statistics of this paper haven’t been checked yet.
Run the check — free, no account needed. It reads the open-access text and checks the sources it cites.
Integrity signals
Registry
Cites
Statistics
Figures
Verification
Claims the paper makes
The claims and statistics of this paper haven’t been checked yet.
Run the check — free, no account needed. It reads the open-access text and checks the sources it cites.
Claims other papers make about this one
Each is checked against this paper’s own text: does it say what the citing paper says it does?
In the citing paper
“The first study to do this identified co-expression modules that had cell type-specific and region-specific expression patterns using nearly 1,000 adult brain regions12,109, and identified neuronal gene-enriched modules containing ASD candidate genes and ASD GWAS signals.”
From Systems biology and gene networks in neurodevelopmental and neurodegenerative disorders (2015) · cites this paper as [109]
In the citing paper
“Moreover, this study found that genes in these modules have dynamic developmental trajectories, demonstrating a role for ASD risk genes in neural development.”
From Systems biology and gene networks in neurodevelopmental and neurodegenerative disorders (2015) · cites this paper as [109]
In the citing paper
“As shown by multiple studies, gene network analyses can aid in understanding genetic association studies.”
From Systems biology and gene networks in neurodevelopmental and neurodegenerative disorders (2015) · cites this paper as [109]
In the citing paper
“Grouping genetic findings using disease- and tissue-relevant modules can increase the power to detect genetic associations with disease by combining signals that reflect similar underlying biology while simultaneously informing biological mechanism by functionally annotating genetic findings30,109,122,183.”
From Systems biology and gene networks in neurodevelopmental and neurodegenerative disorders (2015) · cites this paper as [109]
In the citing paper
“Many studies of complex neuropsychiatric disorders have also concluded that disease-causing variants are often clustered in protein-interaction networks with a high degree of connectivity among themselves and that these clustered networks are often enriched with functional pathways relevant to brain functions [72–80].”
From An integrated analysis of genes and functional pathways for aggression in human and rodent models (2019) · cites this paper as [76]
In the citing paper
“The analysis of genes affected by rare CNVs has confirmed the crucial role of abnormalities in synapse formation and maintenance, but also identified other affected pathways, including cellular proliferation and motility, GTPase/Ras signaling, and neurogenesis”
From Autism risk factors: genes, environment, and gene-environment interactions (2012) · cites this paper as [35]
In the citing paper
“a recent analysis of genetic variations associated with ASD suggests that common and rare variants contribute to ASD by perturbation of common neuronal networks”
From Autism risk factors: genes, environment, and gene-environment interactions (2012) · cites this paper as [35]
Self-check
Percentages, sums and reported differences re-computed from the paper’s own numbers.
The self-check needs the paper’s full text.
Citations
Cites
Cytoscape: A software Environment for integrated models of biomolecular interaction networks
Shannon, P., Markiel, A., Ozier, O., Baliga, N. S., Wang, J. T., Ramage, D., Amin, N., Schwikowski, B., & Ideker, T. (2003) · Genome Research · doi:10.1101/gr.1239303 · Cited by 51,888
Systematic and integrative analysis of large gene lists using DAVID bioinformatics resources
Huang, D. W., Sherman, B. T., & Lempicki, R. A. (2009) · Nature Protocols · doi:10.1038/nprot.2008.211 · Cited by 35,890
PLINK: a tool set for whole-genome association and population-based linkage analyses.
Purcell, S., Neale, B., Todd-Brown, K., Thomas, L., Ferreira, M. A. R., Bender, D., Maller, J., Sklar, P., de Bakker, P. I. W., Daly, M. J., et al. (2007) · The American Journal of Human Genetics · doi:10.1086/519795 · Cited by 34,089
WGCNA: an R package for weighted correlation network analysis
Langfelder, P., & Horvath, S. (2008) · BMC Bioinformatics · doi:10.1186/1471-2105-9-559 · Cited by 27,252
Genome-wide association study of 14,000 cases of seven common diseases and 3,000 shared controls
The Wellcome Trust Case Control Consortium, Management Committee, Burton, P. R., Clayton, D. G., Cardon, L. R., Craddock, N., Deloukas, P., Duncanson, A., Kwiatkowski, D. P., McCarthy, M. I., et al. (2007) · Nature · doi:10.1038/nature05911 · Cited by 9,442
A General Framework for Weighted Gene Co-Expression Network Analysis
Zhang, B., & Horvath, S. (2005) · Statistical Applications in Genetics and Molecular Biology · doi:10.2202/1544-6115.1128 · Cited by 5,684
Common polygenic variation contributes to risk of schizophrenia and bipolar disorder
The International Schizophrenia Consortium (2009) · Nature · doi:10.1038/nature08185 · Cited by 4,821
PENFIELD, W., & BOLDREY, E. (1937) · Brain · doi:10.1093/brain/60.4.389 · Cited by 4,188
Cahoy, J. D., Emery, B., Kaushal, A., Foo, L. C., Zamanian, J. L., Christopherson, K. S., Xing, Y., Lubischer, J. L., Krieg, P. A., Krupenko, S. A., et al. (2008) · The Journal of Neuroscience · doi:10.1523/jneurosci.4178-07.2008 · Cited by 3,129
Strong association of de novo copy number mutations with autism
Sebat, J., Lakshmi, B., Malhotra, D., Troge, J., Lese-Martin, C., Walsh, T., Yamrom, B., Yoon, S., Krasnitz, A., Kendall, J., et al. (2007) · Science · doi:10.1126/science.1138659 · Cited by 2,795
Research works printed but not linked: 1
- 2007, Nature, Nature, 447, 661
Cited by
Sorted by citations
Maternal immune activation and abnormal brain development across CNS disorders
Knuesel, I., Chicha, L., Britschgi, M., Schobel, S. A., Bodmer, M., Hellings, J. A., Toovey, S., & Prinssen, E. P. (2014) · Nature Reviews Neurology · doi:10.1038/nrneurol.2014.187 · Cited by 880
Autism risk factors: genes, environment, and gene-environment interactions
Chaste, P., & Leboyer, M. (2012) · Dialogues in Clinical Neuroscience · doi:10.31887/dcns.2012.14.3/pchaste · Cited by 807
Gupta, S., Ellis, S. E., Ashar, F. N., Moes, A., Bader, J. S., Zhan, J., West, A. B., & Arking, D. E. (2014) · Nature Communications · doi:10.1038/ncomms6748 · Cited by 504
“Previous studies have identified an enrichment of genetic association signals in genes selectively expressed in neurons 10,25,32,33 .”
Single-cell analysis of experience-dependent transcriptomic states in the mouse visual cortex
Hrvatin, S., Hochbaum, D. R., Nagy, M. A., Cicconet, M., Robertson, K., Cheadle, L., Zilionis, R., Ratner, A., Borges-Monroy, R., Klein, A. M., et al. (2018) · Nature Neuroscience · doi:10.1038/s41593-017-0029-5 · Cited by 497
Gene hunting in autism spectrum disorder: on the path to precision medicine
Geschwind, D. H., & State, M. W. (2015) · The Lancet Neurology · doi:10.1016/s1474-4422(15)00044-7 · Cited by 513
Metadata
- Authors
- Ben-David, E., & Shifman, S.
- Affiliations
- Hebrew University of Jerusalem (IL)
- Corresponding author
- Shifman, Sagiv
- ORCID
- Shifman, Sagiv
- Venue
- PLoS Genetics
- Publisher
- Public Library of Science (PLoS)
- Published
- 2012-03-08
- Volume
- 8
- Issue
- 3
- Pages
- e1002556
- ISSN
- 1553-7390 (ISSN-L)
- 1553-7404
- PMC
- PMC3297570
- OpenAlex
- W2129185980
- Cited by
- 145
- References
- 75
- Citations by year
- 2026: 5 · 2025: 6 · 2024: 2 · 2023: 4 · 2022: 2 · 2021: 5 · 2020: 10 · 2019: 13 · 2018: 8 · 2017: 11 · 2016: 14 · 2015: 18 · 2014: 25 · 2013: 14 · 2012: 8
- FWCI
- 10.63
- Type
- journal article
- Language
- en
- Open access
- gold
- doi.org
- Locations
- PLoS Genetics (publishedVersion, cc-by)
- PubMed Central (publishedVersion, cc-by)
- PubMed (publishedVersion)
- DOAJ (DOAJ: Directory of Open Access Journals) (submittedVersion, cc-by-sa)
- Figshare (submittedVersion, cc-by)
- Funders
- Autism Speaks
- Legacy Heritage Fund
- Simons Foundation Autism Research Initiative
- Israel Science Foundation
- University of California, Los Angeles
- National Institute of Mental Health (U24MH081810)
- Topics
- Life Sciences › Neuroscience › Cognitive Neuroscience › Autism Spectrum Disorder Research
- Life Sciences › Biochemistry, Genetics and Molecular Biology › Genetics › Genetics and Neurodevelopmental Disorders
- Life Sciences › Biochemistry, Genetics and Molecular Biology › Molecular Biology › Bioinformatics and Genomic Networks
- Keywords
- autism spectrum disorder, gene co-expression network, neuronal genes, rare variants, common genetic variants, de novo mutations, synaptic plasticity, neuroplasticity, polygenic risk, brain gene expression
- MeSH terms
- Brain, Brain Mapping, Child, Child Development Disorders, Pervasive, Gene Expression Regulation, Humans, Learning, Memory, Mutation, Nerve Net, Neurons, Polymorphism, Genetic, Genetic Predisposition to Disease, Chromosome Pairing, Gene Regulatory Networks
About these checks
Registry, retraction, Cites and statistics results are computed, not judged, with one exception: a printed reference that no index lists is read once by a model before it counts as a citation error. Claims are extracted by a model and kept only when their quote appears verbatim in the text; each cited source is then checked, with a model’s help, for whether it says what the claim relies on. Those verdicts can be wrong — read the claim’s quote and the cited source before relying on one.
Statistics and arithmetic are recomputed, not judged.
Confidence bands are shown only for fields calibrated on our annotated test set. None is calibrated yet, so no band is shown.
What counts as a claim ›How we measure confidence ›How we check this ›
Are you an author, or do you see a problem with this page? Request a review
