CoChat

Dissection of Pol II Trigger Loop Function and Pol II Activity–Dependent Control of Start Site Selection In Vivo

Open access

The DOI matches its Crossref record; 113 of the 113 references it cites were found in a registry or an index.

Abstract

Structural and biochemical studies have revealed the importance of a conserved, mobile domain of RNA Polymerase II (Pol II), the Trigger Loop (TL), in substrate selection and catalysis. The relative contributions of different residues within the TL to Pol II function and how Pol II activity defects correlate with gene expression alteration in vivo are unknown. Using Saccharomyces cerevisiae Pol II as a model, we uncover complex genetic relationships between mutated TL residues by combinatorial analysis of multiply substituted TL variants. We show that in vitro biochemical activity is highly predictive of in vivo transcription phenotypes, suggesting direct relationships between phenotypes and Pol II activity. Interestingly, while multiple TL residues function together to promote proper transcription, individual residues can be separated into distinct functional classes likely relevant to the TL mechanism. In vivo, Pol II activity defects disrupt regulation of the GTP-sensitive IMD2 gene, explaining sensitivities to GTP-production inhibitors, but contrasting with commonly cited models for this sensitivity in the literature. Our data provide support for an existing model whereby Pol II transcriptional activity provides a proxy for direct sensing of NTP levels in vivo leading to IMD2 activation. Finally, we connect Pol II activity to transcription start site selection in vivo, implicating the Pol II active site and transcription itself as a driver for start site scanning, contravening current models for this process.

Overview

The claims and statistics of this paper haven’t been checked yet.

Free: it reads the open-access text and checks the first 5 claims that cite a source we can check. Create a free account to check every claim.

A few free checks a day · papers already verified open instantly · results are public

Integrity signals

Registry

Crossref · 10.1371/journal.pgen.1002627

Cites

113 of 113 references verified0 citation errors · 0 not checkable

Statistics

Figures

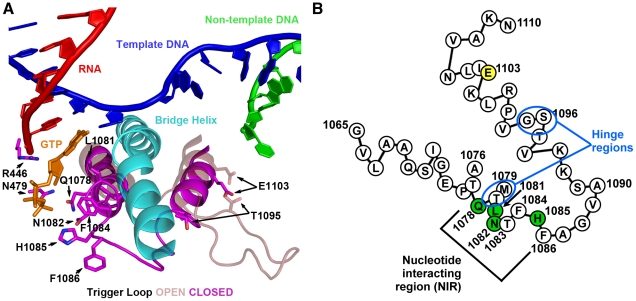
Figure 1 S. cerevisiae Rpb1 trigger loop conformations and sequence. A. Cartoon representation of “closed” Pol II TL in relation to nucleic acids, Rpb1 bridge helix and a matched GTP substrate from structure PDB 2E2H [1] overlaid with TL constrained in open conformation by TFIIS (not shown) from structure PDB 1Y1V [69]. Amino acids (all derived from Rpb1) adjacent to the matched GTP substrate are indicated by numbers and single-letter amino acid codes. This figure was created with Pymol [111]. B. Schematic of TL showing amino acid sequence in single-letter code, with positions of interest numbered, residues with direct contact to GTP substrate in structure 2E2H shown in green, and position 1103 shown in yellow. Two hinge regions, about which the TL appears to change conformation from the open to closed positions are indicated.
Figure 1 S. cerevisiae Rpb1 trigger loop conformations and sequence. A. Cartoon representation of “closed” Pol II TL in relation to nucleic acids, Rpb1 bridge helix and a matched GTP substrate from structure PDB 2E2H [1] overlaid with TL constrained in open conformation by TFIIS (not shown) from structure PDB 1Y1V [69]. Amino acids (all derived from Rpb1) adjacent to the matched GTP substrate are indicated by numbers and single-letter amino acid codes. This figure was created with Pymol [111]. B. Schematic of TL showing amino acid sequence in single-letter code, with positions of interest numbered, residues with direct contact to GTP substrate in structure 2E2H shown in green, and position 1103 shown in yellow. Two hinge regions, about which the TL appears to change conformation from the open to closed positions are indicated.CC BY · PubMed Central
Figure 2 Genetic analyses of Pol II TL single substitution mutants. A. 10-fold serial dilutions of saturated cultures of Pol II TL mutant strains plated on different media. YPD is rich medium with dextrose as a carbon source. YPRaf is rich medium with raffinose as a carbon source. YPRaf/Gal has both raffinose and galactose, allowing assay of gal10Δ56-dependent galactose toxicity phenotypes. SC-Leu is defined, complete medium lacking leucine. MPA was added to this medium (SC-Leu+MPA) to 20 µg/ml final concentration, showing that a number of Pol II mutants are sensitive to this drug. SC-Lys is defined, complete medium lacking lysine, and detects the Spt− phenotype (Lys+) for strains containing lys2-128∂. WT strains grow robustly on most media, but will not grow on SC-Lys when lys2-128∂ is present and grow very poorly on YPRaf/Gal when gal10Δ56 is present. Mutant-dependent transcriptional phenotypes allow modulation of these specific growth defects. B. Schematic of TL (as diagrammed in Figure 1B) showing distribution of viable substitutions with their growth defects on YPD as well as lethal substitutions. All mutants were examined in the background of an Rpb1 T69 change, which is the allele present in the S288C reference genome as well as being normally found in our strains, representing a distinction for the subset of mutants described previously [2](see Materials and Methods, Text S1 and note concerning viability of Q1078S). Scoring of phenotypic strength is based on visual inspection of (A). C. Distribution of gal10Δ56 suppression (Gal resistance) or enhancement (Gal super-sensitivity) among TL substitutions. Scoring of phenotypic strength is based on visual inspection of (A). *Indicates strength of gal10Δ56 suppression is likely underestimated due to confounding generic growth defects. D. Distribution of MPA phenotypes among TL substitutions. Scoring of phenotypic strength is based on visual inspection of (A). E. Distribution of lys2-128∂ suppression (Spt− phenotype scored as Lys+) among TL substitutions. Scoring of phenotypic strength is based on visual inspection of (A).
Figure 2 Genetic analyses of Pol II TL single substitution mutants. A. 10-fold serial dilutions of saturated cultures of Pol II TL mutant strains plated on different media. YPD is rich medium with dextrose as a carbon source. YPRaf is rich medium with raffinose as a carbon source. YPRaf/Gal has both raffinose and galactose, allowing assay of gal10Δ56-dependent galactose toxicity phenotypes. SC-Leu is defined, complete medium lacking leucine. MPA was added to this medium (SC-Leu+MPA) to 20 µg/ml final concentration, showing that a number of Pol II mutants are sensitive to this drug. SC-Lys is defined, complete medium lacking lysine, and detects the Spt− phenotype (Lys+) for strains containing lys2-128∂. WT strains grow robustly on most media, but will not grow on SC-Lys when lys2-128∂ is present and grow very poorly on YPRaf/Gal when gal10Δ56 is present. Mutant-dependent transcriptional phenotypes allow modulation of these specific growth defects. B. Schematic of TL (as diagrammed in Figure 1B) showing distribution of viable substitutions with their growth defects on YPD as well as lethal substitutions. All mutants were examined in the background of an Rpb1 T69 change, which is the allele present in the S288C reference genome as well as being normally found in our strains, representing a distinction for the subset of mutants described previously [2](see Materials and Methods, Text S1 and note concerning viability of Q1078S). Scoring of phenotypic strength is based on visual inspection of (A). C. Distribution of gal10Δ56 suppression (Gal resistance) or enhancement (Gal super-sensitivity) among TL substitutions. Scoring of phenotypic strength is based on visual inspection of (A). *Indicates strength of gal10Δ56 suppression is likely underestimated due to confounding generic growth defects. D. Distribution of MPA phenotypes among TL substitutions. Scoring of phenotypic strength is based on visual inspection of (A). E. Distribution of lys2-128∂ suppression (Spt− phenotype scored as Lys+) among TL substitutions. Scoring of phenotypic strength is based on visual inspection of (A).CC BY · PubMed Central
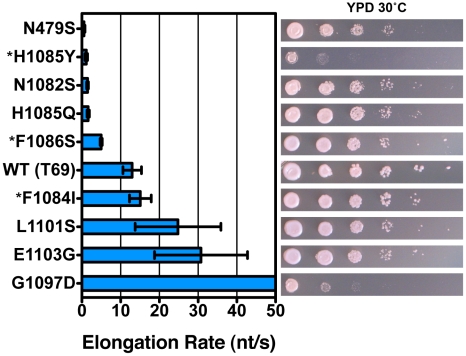
Figure 3 Pol II TL substitution mutants show a wide range of elongation rates in vitro. Pol II TL single substitution elongation rates as determined in vitro using reconstituted Pol II elongation complexes with synthetic oligonucleotides and an RNA primer (Materials and Methods). Raw data for some mutants (*) are from [2] and are shown for comparison. Plotted data are maximal elongation rates as determined by non-linear regression of elongation rates determined for different NTP substrate concentrations, and error bars indicate the range of the 95% confidence intervals (Figures S4, S5). Growth on rich medium of mutants is shown in the right panels for comparison with elongation defects (from Figure 2).
Figure 3 Pol II TL substitution mutants show a wide range of elongation rates in vitro. Pol II TL single substitution elongation rates as determined in vitro using reconstituted Pol II elongation complexes with synthetic oligonucleotides and an RNA primer (Materials and Methods). Raw data for some mutants (*) are from [2] and are shown for comparison. Plotted data are maximal elongation rates as determined by non-linear regression of elongation rates determined for different NTP substrate concentrations, and error bars indicate the range of the 95% confidence intervals (Figures S4, S5). Growth on rich medium of mutants is shown in the right panels for comparison with elongation defects (from Figure 2).CC BY · PubMed Central
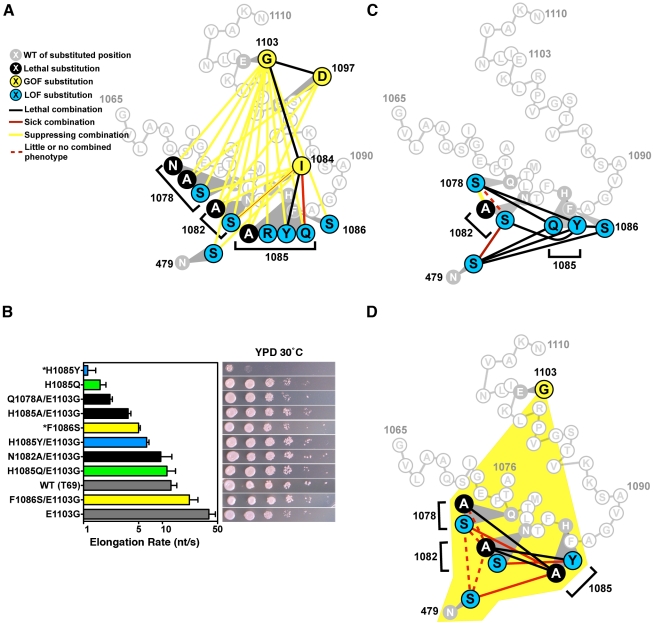
Figure 4 Combination of TL substitutions alters in vivo growth and in vitro biochemical phenotypes. A. GOF-GOF and GOF-LOF genetic interactions among rpb1 TL and other substitutions. GOF (yellow) and LOF (blue) classifications were determined by biochemical and genetic phenotypes of single substitution mutants, with lethal single substitutions shown in black. Double mutant phenotypes are illustrated as the colored lines connecting colored nodes of particular single mutants. Schematic of TL sequence and orientation is as in Figure 1B. Data were compiled from Figure S2, Figure S3 and Table 1. N1082S/F1084I shows a complex interaction with exacerbation of growth defects on rich medium but mutual suppression of other conditional plate phenotypes. B. In vitro elongation rates determined as in Figure 3 for select Pol II TL double mutant enzymes. Single mutants and their relevant E1103G double mutants are indicated by color-coding: F1086 and F1086/E1103G, yellow; H1085Q and H1085Q/E1103G, green; H1085Y and H1085Y/E1103G, blue. Black bars indicate double mutants with E1103G for which the counterpart single substitution mutant is inviable (Q1078A, N1082A, H1085A). Single mutant data are from Figure 3. Raw data for some mutants (*) are from [2] and are shown for comparison. Error bars indicate the ranges of the 95% confidence intervals. Note that x-axis is logarithmic scale. Growth on rich medium of mutants is shown in the right panels for comparison with elongation defects (from Figure 2, Figure S2). C. Interaction diagram showing phenotypes of pairwise combinations of rpb1 LOF alleles (legend shown in (A)). D. Interaction diagram illustrating genetic interactions between pairs of Rpb1 substitution mutants each in the presence of the E1103G substitution (yellow shading encompassing all relevant residues, legend shown in (A)).
Figure 4 Combination of TL substitutions alters in vivo growth and in vitro biochemical phenotypes. A. GOF-GOF and GOF-LOF genetic interactions among rpb1 TL and other substitutions. GOF (yellow) and LOF (blue) classifications were determined by biochemical and genetic phenotypes of single substitution mutants, with lethal single substitutions shown in black. Double mutant phenotypes are illustrated as the colored lines connecting colored nodes of particular single mutants. Schematic of TL sequence and orientation is as in Figure 1B. Data were compiled from Figure S2, Figure S3 and Table 1. N1082S/F1084I shows a complex interaction with exacerbation of growth defects on rich medium but mutual suppression of other conditional plate phenotypes. B. In vitro elongation rates determined as in Figure 3 for select Pol II TL double mutant enzymes. Single mutants and their relevant E1103G double mutants are indicated by color-coding: F1086 and F1086/E1103G, yellow; H1085Q and H1085Q/E1103G, green; H1085Y and H1085Y/E1103G, blue. Black bars indicate double mutants with E1103G for which the counterpart single substitution mutant is inviable (Q1078A, N1082A, H1085A). Single mutant data are from Figure 3. Raw data for some mutants (*) are from [2] and are shown for comparison. Error bars indicate the ranges of the 95% confidence intervals. Note that x-axis is logarithmic scale. Growth on rich medium of mutants is shown in the right panels for comparison with elongation defects (from Figure 2, Figure S2). C. Interaction diagram showing phenotypes of pairwise combinations of rpb1 LOF alleles (legend shown in (A)). D. Interaction diagram illustrating genetic interactions between pairs of Rpb1 substitution mutants each in the presence of the E1103G substitution (yellow shading encompassing all relevant residues, legend shown in (A)).CC BY · PubMed Central
Figure 5 Pol II TL mutants alter transcription of IMD2 and URA2, genes required for GTP and UTP synthesis, respectively. A. Northern blotting for different Pol II mutants in the presence or absence of 20 µg/ml MPA (2 hours treatment) for expression of IMD gene(s) using IMD2 DNA probe (top). SED1 was probed as a loading control. Values for IMD normalized to the WT ratio of IMD/SED1 are shown in the graph and represent the mean relative expression for IMD transcript(s) +/− the standard deviation for at least three independent experiments. B. Northern blotting for URA2 expression in the presence or absence of 20 µg/ml MPA (2 hours treatment) (top). SED1 was probed as a loading control. Values for URA2 normalized to the WT ratio of URA2/SED1 are shown in the graph and represent the mean relative expression for URA2 +/− the standard deviation for at least three independent experiments. C. Schematic of IMD2 gene transcription in the absence or presence of MPA. IMD2 is not functionally expressed in the absence of MPA or low GTP because upstream transcriptional starts are terminated at a terminator element (stop sign) that can be bypassed by utilization of downstream start sites. D. Primer extension analysis for downstream IMD2 start site usage in Pol II TL mutants in presence or absence of 20 µg/ml MPA (2 hours treatment). Numbers on right indicate position of RNA terminus relative to the A of the IMD2 ATG codon. Sequence ladder on right is derived from the primer used in (E) and has been cross-referenced with the primer used here. E. Primer extension analysis for upstream IMD2 start site usage in Pol II TL mutants as in (D). Numbers on right indicate position of RNA terminus relative to the A of the IMD2 ATG codon. Sequence ladder on right is derived from the same primer used. The examples in D and E are representative of at least three independent experiments.
Figure 5 Pol II TL mutants alter transcription of IMD2 and URA2, genes required for GTP and UTP synthesis, respectively. A. Northern blotting for different Pol II mutants in the presence or absence of 20 µg/ml MPA (2 hours treatment) for expression of IMD gene(s) using IMD2 DNA probe (top). SED1 was probed as a loading control. Values for IMD normalized to the WT ratio of IMD/SED1 are shown in the graph and represent the mean relative expression for IMD transcript(s) +/− the standard deviation for at least three independent experiments. B. Northern blotting for URA2 expression in the presence or absence of 20 µg/ml MPA (2 hours treatment) (top). SED1 was probed as a loading control. Values for URA2 normalized to the WT ratio of URA2/SED1 are shown in the graph and represent the mean relative expression for URA2 +/− the standard deviation for at least three independent experiments. C. Schematic of IMD2 gene transcription in the absence or presence of MPA. IMD2 is not functionally expressed in the absence of MPA or low GTP because upstream transcriptional starts are terminated at a terminator element (stop sign) that can be bypassed by utilization of downstream start sites. D. Primer extension analysis for downstream IMD2 start site usage in Pol II TL mutants in presence or absence of 20 µg/ml MPA (2 hours treatment). Numbers on right indicate position of RNA terminus relative to the A of the IMD2 ATG codon. Sequence ladder on right is derived from the primer used in (E) and has been cross-referenced with the primer used here. E. Primer extension analysis for upstream IMD2 start site usage in Pol II TL mutants as in (D). Numbers on right indicate position of RNA terminus relative to the A of the IMD2 ATG codon. Sequence ladder on right is derived from the same primer used. The examples in D and E are representative of at least three independent experiments.CC BY · PubMed Central
Figure 6 Pol II TL contributes to start site selection at a number of genes. A. Primer extension analysis of RNA 5′-ends at ADH1 in Pol II TL mutants. Sequence ladder at left is derived from primer used in Figure 5E but has been cross-referenced with ADH1 primer used for primer extension here. Numbers indicate positions of putative start sites in relation to the ADH1 ATG (A is +1). Right panel quantifies start site usage at ADH1 as determined by primer extension with a radiolabeled oligo. Signals in each lane were divided into bins based on positions of start sites relative to ADH1 ATG sequence (A is +1) and normalized to total signal per lane. WT start site fractions were subtracted from mutant start site fractions for particular regions to determine the relative alteration in start site distribution in Pol II mutant strains. A negative value indicates that the mutant has relatively lower usage for that particular group of start sites and a positive value indicates a relatively higher usage for that particular group of start sites. Values shown are the average of at least four independent experiments +/− standard deviation. B. Primer extension analysis of RNA 5′-ends at HIS4 and PMA1 in Pol II TL mutants. C. Primer extension analysis of RNA 5′-ends at GAL1 in Pol II TL mutants. Cells are grown in medium lacking raffinose and then GAL1 is induced by addition of galactose to 2% for two hours. Sequence ladder at left is derived from the same primer used for primer extension. Numbers indicate positions of putative start sites in relation to the GAL1 ATG (A is +1).
Figure 6 Pol II TL contributes to start site selection at a number of genes. A. Primer extension analysis of RNA 5′-ends at ADH1 in Pol II TL mutants. Sequence ladder at left is derived from primer used in Figure 5E but has been cross-referenced with ADH1 primer used for primer extension here. Numbers indicate positions of putative start sites in relation to the ADH1 ATG (A is +1). Right panel quantifies start site usage at ADH1 as determined by primer extension with a radiolabeled oligo. Signals in each lane were divided into bins based on positions of start sites relative to ADH1 ATG sequence (A is +1) and normalized to total signal per lane. WT start site fractions were subtracted from mutant start site fractions for particular regions to determine the relative alteration in start site distribution in Pol II mutant strains. A negative value indicates that the mutant has relatively lower usage for that particular group of start sites and a positive value indicates a relatively higher usage for that particular group of start sites. Values shown are the average of at least four independent experiments +/− standard deviation. B. Primer extension analysis of RNA 5′-ends at HIS4 and PMA1 in Pol II TL mutants. C. Primer extension analysis of RNA 5′-ends at GAL1 in Pol II TL mutants. Cells are grown in medium lacking raffinose and then GAL1 is induced by addition of galactose to 2% for two hours. Sequence ladder at left is derived from the same primer used for primer extension. Numbers indicate positions of putative start sites in relation to the GAL1 ATG (A is +1).CC BY · PubMed Central
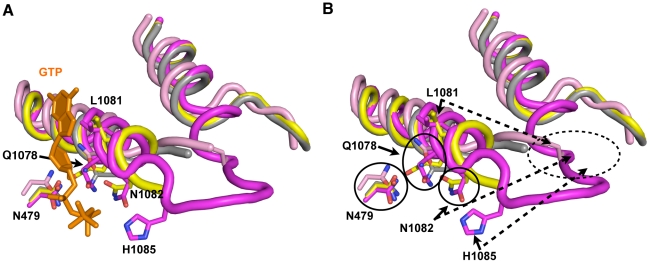
Figure 7 Model for stepwise function of TL residues in contributing to TL folding and function. A. Structural cartoon showing overlay of TLs and Rpb1 N479 from a number of Pol II elongation complex/initial transcribing complex crystal structures with TLs in different states of folding/NTP interaction. Matched GTP nucleotide (orange) and TL and N479 (magenta) are from PDP 2E2H [1], which shows TL in a closed conformation. Partially folded TL and N479 (yellow) from PDB 4A3F [13], which contains a matched NTP analog (not shown) and short RNA (not shown). Related structure to PDB 4A3F from PDB 4A3D [13], but without matched NTP analog is shown in gray. Partially folded TL from PDB 1R9T, containing a mismatched NTP (not shown) is shown in pink. B. Same figure as in (A) but with GTP omitted. Certain residues are relatively closely positioned in all structures overlaid (N479, Q1078), while other residues are observed stabilized in partially folded structures directly adjacent to the active site (L1081, N1082). H1085 is observed positioned adjacent to the active site only upon complete folding/stabilization of the TL. Dashed oval indicates likely location of TL NIR residues when in out conformation where the TL is either mobile or unfolded. This figure was created with Pymol [111].
Figure 7 Model for stepwise function of TL residues in contributing to TL folding and function. A. Structural cartoon showing overlay of TLs and Rpb1 N479 from a number of Pol II elongation complex/initial transcribing complex crystal structures with TLs in different states of folding/NTP interaction. Matched GTP nucleotide (orange) and TL and N479 (magenta) are from PDP 2E2H [1], which shows TL in a closed conformation. Partially folded TL and N479 (yellow) from PDB 4A3F [13], which contains a matched NTP analog (not shown) and short RNA (not shown). Related structure to PDB 4A3F from PDB 4A3D [13], but without matched NTP analog is shown in gray. Partially folded TL from PDB 1R9T, containing a mismatched NTP (not shown) is shown in pink. B. Same figure as in (A) but with GTP omitted. Certain residues are relatively closely positioned in all structures overlaid (N479, Q1078), while other residues are observed stabilized in partially folded structures directly adjacent to the active site (L1081, N1082). H1085 is observed positioned adjacent to the active site only upon complete folding/stabilization of the TL. Dashed oval indicates likely location of TL NIR residues when in out conformation where the TL is either mobile or unfolded. This figure was created with Pymol [111].CC BY · PubMed Central
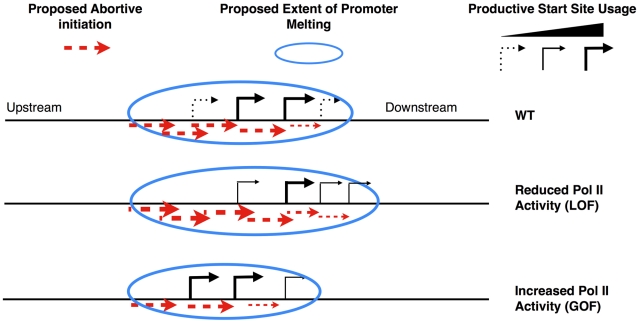
Figure 8 Model for transcription-assisted start site scanning through abortive initiation. Cartoon showing predicted start site distribution for an ADH1-like gene in WT cells (top) or alteration in distribution in the presence of LOF (middle) or GOF (bottom) Pol II TL mutants.
Figure 8 Model for transcription-assisted start site scanning through abortive initiation. Cartoon showing predicted start site distribution for an ADH1-like gene in WT cells (top) or alteration in distribution in the presence of LOF (middle) or GOF (bottom) Pol II TL mutants.CC BY · PubMed Central

Verification

Claims the paper makes

The claims and statistics of this paper haven’t been checked yet.

Free: it reads the open-access text and checks the first 5 claims that cite a source we can check. Create a free account to check every claim.

A few free checks a day · papers already verified open instantly · results are public

Claims other papers make about this one

Each is checked against this paper’s own text: does it say what the citing paper says it does?

Self-check

Percentages, sums and reported differences re-computed from the paper’s own numbers.

The self-check needs the paper’s full text.

Citations

Cites

Show all 113 references

Cited by

See all 110

Metadata

Authors
Kaplan, C. D., Jin, H., Zhang, I. L., & Belyanin, A.
Affiliations
  • Texas A&M University (US)
  • University of Wisconsin System (US)
  • Bowdoin College (US)
Corresponding author
Kaplan, Craig D.
Venue
PLoS Genetics
Published
2012-04-12
Volume
8
Issue
4
Pages
e1002627
ISSN
  • 1553-7390 (ISSN-L)
  • 1553-7404
OpenAlex
W2067438466
Cited by
97
References
113
Citations by year
2026: 4 · 2025: 4 · 2024: 6 · 2023: 5 · 2022: 7 · 2021: 6 · 2020: 8 · 2019: 6 · 2018: 2 · 2017: 10 · 2016: 10 · 2015: 3 · 2014: 7 · 2013: 12 · 2012: 7
FWCI
3.73
Type
journal article
Language
en
Open access
Locations
  • PLoS Genetics (publishedVersion, cc-by)
  • Europe PMC (PubMed Central) (publishedVersion, cc-by)
  • PubMed Central (publishedVersion, cc-by)
  • PubMed (publishedVersion)
  • DOAJ (DOAJ: Directory of Open Access Journals) (submittedVersion, cc-by-sa)
  • Figshare (submittedVersion, cc-by)
  • OakTrust (Texas A&M University Libraries) (submittedVersion)
Funders
  • National Science Foundation (0851611)
  • National Institutes of Health
  • National Institute of General Medical Sciences (GM036659, F32GM077787, R01GM097260, R37GM036659, R01GM036659, GM097260)
Topics
  • Life Sciences › Biochemistry, Genetics and Molecular Biology › Molecular Biology › Genomics and Chromatin Dynamics
  • Life Sciences › Biochemistry, Genetics and Molecular Biology › Molecular Biology › Nuclear Structure and Function
  • Life Sciences › Biochemistry, Genetics and Molecular Biology › Molecular Biology › Fungal and yeast genetics research
Keywords
RNA polymerase II, trigger loop, transcription start site selection, Saccharomyces cerevisiae, transcriptional regulation, gene expression
MeSH terms
Catalysis, Guanosine Triphosphate, IMP Dehydrogenase, Models, Genetic, Mutation, RNA Polymerase II, Saccharomyces cerevisiae, Substrate Specificity, Transcription, Genetic, Gene Expression Regulation, Fungal, Catalytic Domain, Transcription Initiation Site, Saccharomyces cerevisiae Proteins

About these checks

Registry, retraction, Cites and statistics results are computed, not judged, with one exception: a printed reference that no index lists is read once by a model before it counts as a citation error. Claims are extracted by a model and kept only when their quote appears verbatim in the text; each cited source is then checked, with a model’s help, for whether it says what the claim relies on. Those verdicts can be wrong — read the claim’s quote and the cited source before relying on one.

Statistics and arithmetic are recomputed, not judged.

Confidence bands are shown only for fields calibrated on our annotated test set. None is calibrated yet, so no band is shown.

What counts as a claim ›How we measure confidence ›How we check this ›

Are you an author, or do you see a problem with this page? Request a review

How to cite

Cite CoChat for the checks on this page, and the paper for its own findings.

This page
CoChat. (2026). Citation check: Dissection of Pol II Trigger Loop Function and Pol II Activity–Dependent Control of Start Site Selection In Vivo. https://app.cochat.ai/papers/10.1371/journal.pgen.1002627
The paper
Kaplan, C. D., Jin, H., Zhang, I. L., & Belyanin, A. (2012). Dissection of Pol II Trigger Loop Function and Pol II Activity–Dependent Control of Start Site Selection In Vivo. PLoS Genetics. https://doi.org/10.1371/journal.pgen.1002627

Data sources

Bibliographic data: Semantic Scholar, OpenAlex, Crossref.

Contains information from the Semantic Scholar Academic Graph Datasets, made available under the ODC Attribution License (ODC-BY 1.0).

Semantic Scholar’s data is described in: Kinney, R., et al. (2023). The Semantic Scholar Open Data Platform. arXiv:2301.10140.