Cited by 162Mitochondrial Function and PathologyAlzheimer's disease research and treatmentsAutophagy in Disease and Therapy

The DOI matches its Crossref record; 59 of the 59 references it cites were found in a registry or an index.

Loss of Prohibitin Membrane Scaffolds Impairs Mitochondrial Architecture and Leads to Tau Hyperphosphorylation and Neurodegeneration

Open access

Abstract

Fusion and fission of mitochondria maintain the functional integrity of mitochondria and protect against neurodegeneration, but how mitochondrial dysfunctions trigger neuronal loss remains ill-defined. Prohibitins form large ring complexes in the inner membrane that are composed of PHB1 and PHB2 subunits and are thought to function as membrane scaffolds. In Caenorhabditis elegans, prohibitin genes affect aging by moderating fat metabolism and energy production. Knockdown experiments in mammalian cells link the function of prohibitins to membrane fusion, as they were found to stabilize the dynamin-like GTPase OPA1 (optic atrophy 1), which mediates mitochondrial inner membrane fusion and cristae morphogenesis. Mutations in OPA1 are associated with dominant optic atrophy characterized by the progressive loss of retinal ganglion cells, highlighting the importance of OPA1 function in neurons. Here, we show that neuron-specific inactivation of Phb2 in the mouse forebrain causes extensive neurodegeneration associated with behavioral impairments and cognitive deficiencies. We observe early onset tau hyperphosphorylation and filament formation in the hippocampus, demonstrating a direct link between mitochondrial defects and tau pathology. Loss of PHB2 impairs the stability of OPA1, affects mitochondrial ultrastructure, and induces the perinuclear clustering of mitochondria in hippocampal neurons. A destabilization of the mitochondrial genome and respiratory deficiencies manifest in aged neurons only, while the appearance of mitochondrial morphology defects correlates with tau hyperphosphorylation in the absence of PHB2. These results establish an essential role of prohibitin complexes for neuronal survival in vivo and demonstrate that OPA1 stability, mitochondrial fusion, and the maintenance of the mitochondrial genome in neurons depend on these scaffolding proteins. Moreover, our findings establish prohibitin-deficient mice as a novel genetic model for tau pathologies caused by a dysfunction of mitochondria and raise the possibility that tau pathologies are associated with other neurodegenerative disorders caused by deficiencies in mitochondrial dynamics.

Overview

The claims and statistics of this paper haven’t been checked yet.

Run the check — free, no account needed. It reads the open-access text and checks the sources it cites.

A few free checks a day · papers already verified open instantly · results are public

Integrity signals

Registry

Crossref · 10.1371/journal.pgen.1003021

Cites

59 of 59 references verified0 citation errors · 0 not checkable

Statistics

Figures

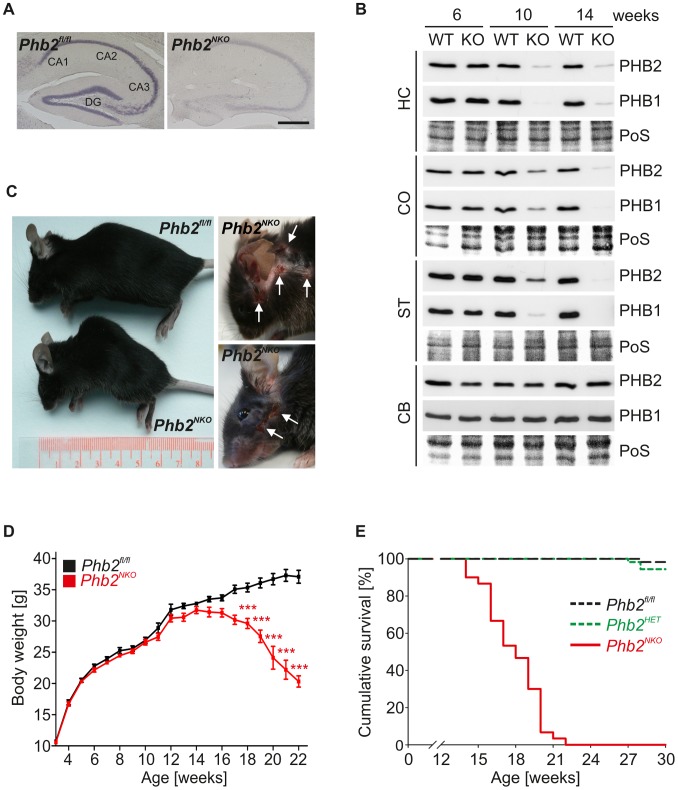
Figure 1 CaMKIIa-Cre-mediated inactivation of the mouse Phb2 gene in forebrain neurons. (A) In-situ hybridization of Phb2 mRNA in the hippocampus of 8-week-old Phb2NKO and Phb2fl/fl control mice. Scale bar: 500 µm. (B) Immunoblot analysis of tissue lysates generated from the indicated brain regions of Phb2NKO (KO) and Phb2fl/fl (WT) control mice of different age using PHB1- and PHB2-specific antibodies. Ponceau S (PoS) staining was used to monitor equal gel loading. Cortex (CO), striatum (ST), hippocampus (HC), cerebellum (CB). (C) Representative photographs of 20-week-old Phb2NKO mice of the indicated genotypes showing lordokyphosis (left panel) and excessive pathological grooming (right panel). White arrows indicate regions of self-inflicted open skin lesions. (D) Body weight analysis of Phb2NKO and Phb2fl/fl control animals. n = 20. ***P<0.001. Error bars indicate SEM. (E) Kaplan-Meier survival plot of Phb2NKO (n = 30) and control animals (Phb2fl/fl (n = 59), Phb2HET (n = 19)). P<0.0001.
Figure 1 CaMKIIa-Cre-mediated inactivation of the mouse Phb2 gene in forebrain neurons. (A) In-situ hybridization of Phb2 mRNA in the hippocampus of 8-week-old Phb2NKO and Phb2fl/fl control mice. Scale bar: 500 µm. (B) Immunoblot analysis of tissue lysates generated from the indicated brain regions of Phb2NKO (KO) and Phb2fl/fl (WT) control mice of different age using PHB1- and PHB2-specific antibodies. Ponceau S (PoS) staining was used to monitor equal gel loading. Cortex (CO), striatum (ST), hippocampus (HC), cerebellum (CB). (C) Representative photographs of 20-week-old Phb2NKO mice of the indicated genotypes showing lordokyphosis (left panel) and excessive pathological grooming (right panel). White arrows indicate regions of self-inflicted open skin lesions. (D) Body weight analysis of Phb2NKO and Phb2fl/fl control animals. n = 20. ***P<0.001. Error bars indicate SEM. (E) Kaplan-Meier survival plot of Phb2NKO (n = 30) and control animals (Phb2fl/fl (n = 59), Phb2HET (n = 19)). P<0.0001.CC BY · PubMed Central
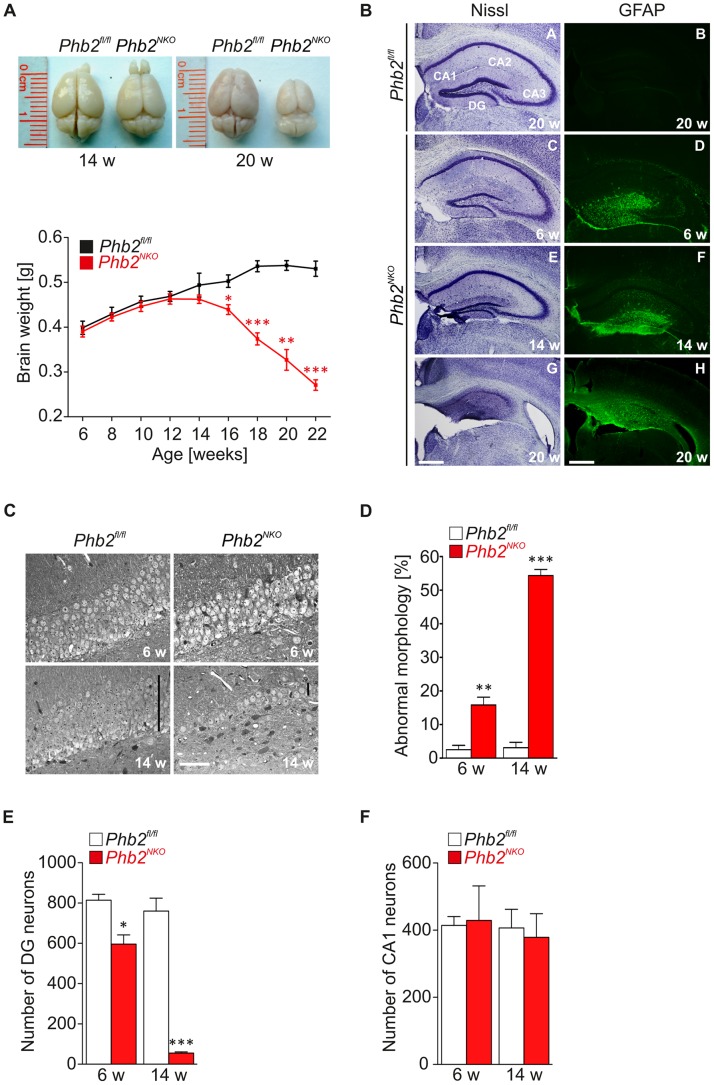
Figure 2 Progressive astrogliosis and loss of hippocampal neurons in Phb2NKO mice. (A) Representative photographs of brains isolated from 14- or 20-week-old Phb2NKO and Phb2fl/fl control mice (upper panel). Brain weights of Phb2NKO and Phb2fl/fl control animals were monitored at the indicated time points (lower panel). n = 5 per genotype and time point, *P<0.05; **P<0.01; ***P<0.001. Error bars indicate SEM. (B) Nissl staining of coronal sections across the hippocampal region from Phb2NKO and Phb2fl/fl control brains of the indicated age (left panel). Immunohistochemistry using GFAP antibody reveals progressive astrogliosis in the hippocampus of Phb2NKO mice (right panel). Scale bars: 400 µm. (C) Coronal semithin sections of the hippocampal DG from 6-week (upper panel) or 14-week-old (lower panel) Phb2NKO and Phb2fl/fl control mice. Black vertical bars show the thickness of the neuronal layers. White scale bar: 40 µm. (D) Quantification of neurons with degenerative features and vacuolization in the DG of Phb2NKO and Phb2fl/fl control mice of the indicated age. Data are expressed as percentage of total cells counted. At least 200 cells were scored per section; in case of the Phb2NKO at 14 weeks all residual neurons were scored. Error bars indicate SEM (n = 3). (E) Number of DG and (F) CA1 neurons in 6- and 14-week-old Phb2NKO mice. Error bars indicate SEM (n = 3).
Figure 2 Progressive astrogliosis and loss of hippocampal neurons in Phb2NKO mice. (A) Representative photographs of brains isolated from 14- or 20-week-old Phb2NKO and Phb2fl/fl control mice (upper panel). Brain weights of Phb2NKO and Phb2fl/fl control animals were monitored at the indicated time points (lower panel). n = 5 per genotype and time point, *P<0.05; **P<0.01; ***P<0.001. Error bars indicate SEM. (B) Nissl staining of coronal sections across the hippocampal region from Phb2NKO and Phb2fl/fl control brains of the indicated age (left panel). Immunohistochemistry using GFAP antibody reveals progressive astrogliosis in the hippocampus of Phb2NKO mice (right panel). Scale bars: 400 µm. (C) Coronal semithin sections of the hippocampal DG from 6-week (upper panel) or 14-week-old (lower panel) Phb2NKO and Phb2fl/fl control mice. Black vertical bars show the thickness of the neuronal layers. White scale bar: 40 µm. (D) Quantification of neurons with degenerative features and vacuolization in the DG of Phb2NKO and Phb2fl/fl control mice of the indicated age. Data are expressed as percentage of total cells counted. At least 200 cells were scored per section; in case of the Phb2NKO at 14 weeks all residual neurons were scored. Error bars indicate SEM (n = 3). (E) Number of DG and (F) CA1 neurons in 6- and 14-week-old Phb2NKO mice. Error bars indicate SEM (n = 3).CC BY · PubMed Central
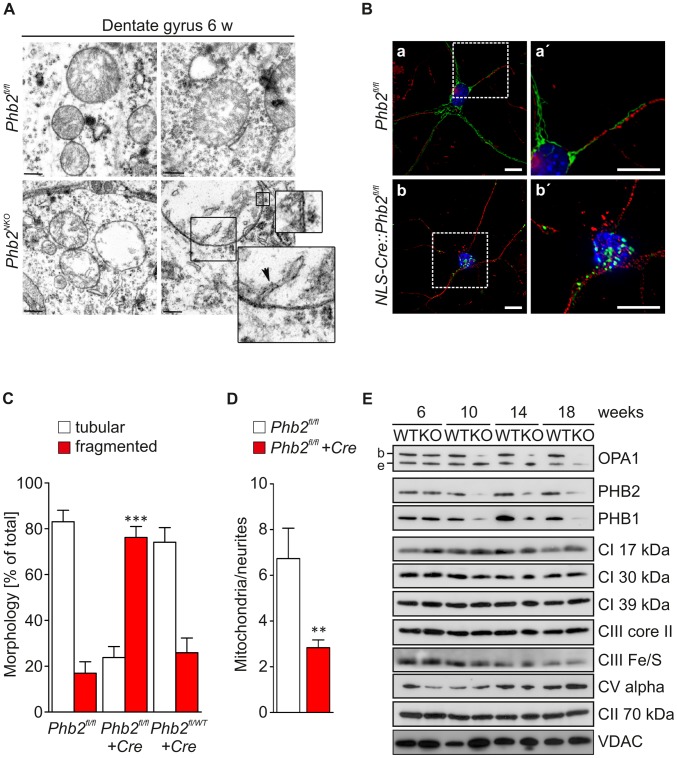
Figure 3 Defective mitochondrial morphogenesis and ultrastructure in Phb2-deficient neurons in vivo. (A) Transmission electron microscopy analysis of the mitochondrial ultrastructure in DG neurons of 6-week-old Phb2NKO and Phb2fl/fl control mice. The enlargements show the double membrane of the mitochondrion and the emergence of one crista. Scale bar: 400 nm. (B) Fragmentation and perinuclear clustering of PHB2-deficient neuronal mitochondria. Primary hippocampal neurons isolated from E18.5 Phb2fl/fl embryos were infected with lentiviruses expressing mitochondrially targeted EGFP and Cre recombinase (NLS-Cre) as indicated. Fixed samples were immunostained with antibodies directed against GFP and neuronal βIII-tubulin followed by DAPI staining. a′, b′ are magnifications of the boxed insets shown in a, b. Scale bars: 10 µm. (C) Quantification of mitochondrial morphology in PHB2-deficient and control primary hippocampal neurons. Cells were infected with lentiviruses expressing Cre recombinase when indicated and processed as described in (B). Cells containing tubular (white bars) or fragmented mitochondria (red bars) were classified. >200 cells were scored in three independent experiments. ***P<0.001. Error bars indicate SEM. (D) Quantification of mitochondria per neurites in PHB2-deficient primary hippocampal neurons. Phb2fl/fl neurons were infected with lentiviruses expressing Cre recombinase when indicated and processed as described in (B). >30 cells were scored in three independent experiments. **P<0.01. Error bars indicate SEM. (E) Immunoblot analysis of hippocampal tissue lysates from Phb2NKO (KO) and Phb2fl/fl (WT) control mice of the indicated age. Lysates were analyzed by SDS-PAGE and immunoblotting using the indicated antibodies. Antibodies directed against VDAC and the 70 kDa subunit of complex II were used to monitor equal gel loading. b/e: long/short OPA1 isoforms.
Figure 3 Defective mitochondrial morphogenesis and ultrastructure in Phb2-deficient neurons in vivo. (A) Transmission electron microscopy analysis of the mitochondrial ultrastructure in DG neurons of 6-week-old Phb2NKO and Phb2fl/fl control mice. The enlargements show the double membrane of the mitochondrion and the emergence of one crista. Scale bar: 400 nm. (B) Fragmentation and perinuclear clustering of PHB2-deficient neuronal mitochondria. Primary hippocampal neurons isolated from E18.5 Phb2fl/fl embryos were infected with lentiviruses expressing mitochondrially targeted EGFP and Cre recombinase (NLS-Cre) as indicated. Fixed samples were immunostained with antibodies directed against GFP and neuronal βIII-tubulin followed by DAPI staining. a′, b′ are magnifications of the boxed insets shown in a, b. Scale bars: 10 µm. (C) Quantification of mitochondrial morphology in PHB2-deficient and control primary hippocampal neurons. Cells were infected with lentiviruses expressing Cre recombinase when indicated and processed as described in (B). Cells containing tubular (white bars) or fragmented mitochondria (red bars) were classified. >200 cells were scored in three independent experiments. ***P<0.001. Error bars indicate SEM. (D) Quantification of mitochondria per neurites in PHB2-deficient primary hippocampal neurons. Phb2fl/fl neurons were infected with lentiviruses expressing Cre recombinase when indicated and processed as described in (B). >30 cells were scored in three independent experiments. **P<0.01. Error bars indicate SEM. (E) Immunoblot analysis of hippocampal tissue lysates from Phb2NKO (KO) and Phb2fl/fl (WT) control mice of the indicated age. Lysates were analyzed by SDS-PAGE and immunoblotting using the indicated antibodies. Antibodies directed against VDAC and the 70 kDa subunit of complex II were used to monitor equal gel loading. b/e: long/short OPA1 isoforms.CC BY · PubMed Central
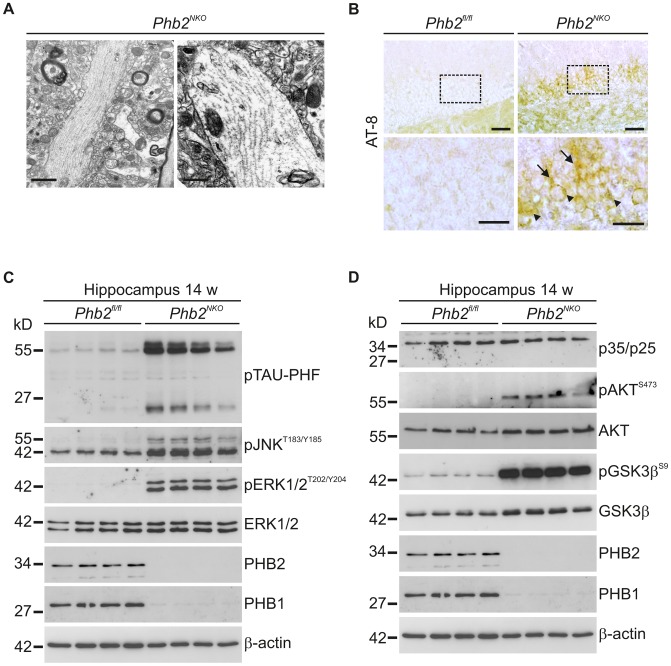
Figure 4 Tau hyperphosphorylation and filaments in Phb2NKO mice. (A) Transmission electron microscopy analysis of hippocampal tissue from 14-week-old Phb2NKO mice revealed the presence of straight filamentous tubules in neuronal unmyelinated processes reminiscent of tau filaments. Scale bars: 1.5 µm (left panel); 1 µm (right panel). (B) Immunohistochemistry using anti-AT8 antibody detecting hyperphosphorylated tau specifically on hippocampal tissue sections from 6-week-old Phb2NKO mice. Hyperphosphorylated tau accumulated both in the cell body (arrow head) and in dendrites (arrow) of DG neurons. The lower panel illustrates magnifications of the boxed insets depicted in the upper panel. Scale bars: 100 µm (upper panel), 50 µm (lower panel). (C) Immunoblot analysis of tau hyperphosphorylation and associated signalling molecules. Hippocampal tissue lysates from individual 14-week-old Phb2NKO and Phb2fl/fl control mice were analyzed by SDS-PAGE and immunoblotting using the indicated antibodies. β-actin was used as loading control. (D) Immunoblot analysis of signalling components that have been linked functionally to tau hyperphosphorylation. Hippocampal lysates were analyzed as in (C) using the indicated antibodies. β-actin was used as loading control.
Figure 4 Tau hyperphosphorylation and filaments in Phb2NKO mice. (A) Transmission electron microscopy analysis of hippocampal tissue from 14-week-old Phb2NKO mice revealed the presence of straight filamentous tubules in neuronal unmyelinated processes reminiscent of tau filaments. Scale bars: 1.5 µm (left panel); 1 µm (right panel). (B) Immunohistochemistry using anti-AT8 antibody detecting hyperphosphorylated tau specifically on hippocampal tissue sections from 6-week-old Phb2NKO mice. Hyperphosphorylated tau accumulated both in the cell body (arrow head) and in dendrites (arrow) of DG neurons. The lower panel illustrates magnifications of the boxed insets depicted in the upper panel. Scale bars: 100 µm (upper panel), 50 µm (lower panel). (C) Immunoblot analysis of tau hyperphosphorylation and associated signalling molecules. Hippocampal tissue lysates from individual 14-week-old Phb2NKO and Phb2fl/fl control mice were analyzed by SDS-PAGE and immunoblotting using the indicated antibodies. β-actin was used as loading control. (D) Immunoblot analysis of signalling components that have been linked functionally to tau hyperphosphorylation. Hippocampal lysates were analyzed as in (C) using the indicated antibodies. β-actin was used as loading control.CC BY · PubMed Central
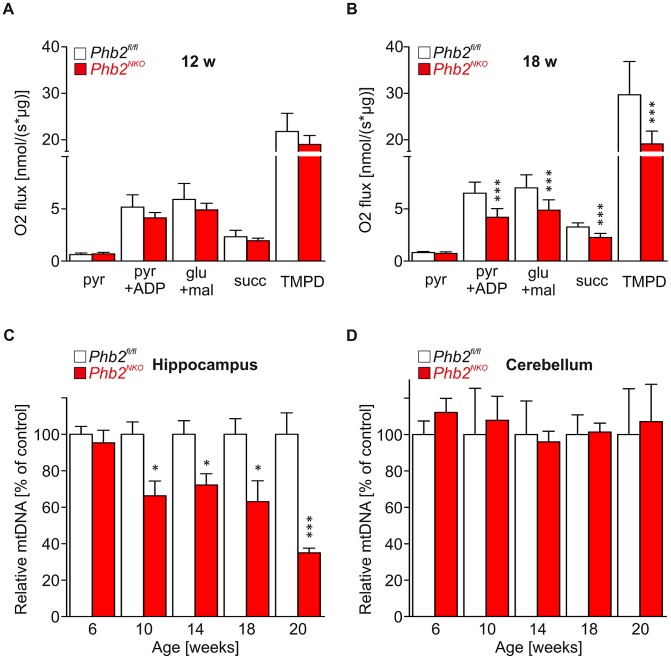
Figure 5 Late-onset mtDNA loss and respiratory dysfunction in Phb2NKO mice. (A) and (B) Oxygen consumption of mitochondria isolated from the hippocampus of (A) 12-week-old or (B) 18-week-old Phb2NKO and Phb2fl/fl control mice in the presence of specific substrates for individual respective respiratory chain complexes. Pyr, pyruvate; ADP, adenosine diphosphate; glu, glutamate; mal, malate; succ, succinate; TMPD, N,N,N′,N′-tetramethyl-1,4-phenylendiamine. n = 5. Error bars represent SEM. ***P<0.001. (C) and (D) Relative levels of mtDNA in the hippocampus (D) and the cerebellum (E) of Phb2NKO and Phb2fl/fl control mice. Total DNA was extracted from brain subregions of mice of the indicated age and genotype and analyzed by quantitative real-time PCR analysis using primers specific for mtDNA and nuclear DNA. Data represent average of at least three independent experiments, each sample assayed in quadruples. mtDNA, mitochondrial DNA. Error bars represent SEM. *P<0.05, ***P<0.001.
Figure 5 Late-onset mtDNA loss and respiratory dysfunction in Phb2NKO mice. (A) and (B) Oxygen consumption of mitochondria isolated from the hippocampus of (A) 12-week-old or (B) 18-week-old Phb2NKO and Phb2fl/fl control mice in the presence of specific substrates for individual respective respiratory chain complexes. Pyr, pyruvate; ADP, adenosine diphosphate; glu, glutamate; mal, malate; succ, succinate; TMPD, N,N,N′,N′-tetramethyl-1,4-phenylendiamine. n = 5. Error bars represent SEM. ***P<0.001. (C) and (D) Relative levels of mtDNA in the hippocampus (D) and the cerebellum (E) of Phb2NKO and Phb2fl/fl control mice. Total DNA was extracted from brain subregions of mice of the indicated age and genotype and analyzed by quantitative real-time PCR analysis using primers specific for mtDNA and nuclear DNA. Data represent average of at least three independent experiments, each sample assayed in quadruples. mtDNA, mitochondrial DNA. Error bars represent SEM. *P<0.05, ***P<0.001.CC BY · PubMed Central

Verification

Claims the paper makes

The claims and statistics of this paper haven’t been checked yet.

Run the check — free, no account needed. It reads the open-access text and checks the sources it cites.

A few free checks a day · papers already verified open instantly · results are public

Claims other papers make about this one

Each is checked against this paper’s own text: does it say what the citing paper says it does?

Self-check

Percentages, sums and reported differences re-computed from the paper’s own numbers.

The self-check needs the paper’s full text.

Citations

Cites

Show all 59 references

Research works printed but not linked: 1

  1. D DiBella, 2008, AFG3L2 mutations cause autosomal dominant ataxia SCA28 and reveal an essential role of the m-AAA AFG3L2 homocomplex in the cerebellum, Annual meeting of the American Society of Human Genetics

Cited by

Sorted by citations

See all 162

Metadata

Authors
Merkwirth, C., Martinelli, P., Korwitz, A., Morbin, M., Brönneke, H. S., Jordan, S. D., Rugarli, E. I., & Langer, T.
Affiliations
  • University of Cologne (DE)
  • Fondazione IRCCS Istituto Neurologico Carlo Besta (IT)
Corresponding author
Langer, Thomas
Venue
PLoS Genetics
Published
2012-11-08
Volume
8
Issue
11
Pages
e1003021
ISSN
  • 1553-7390 (ISSN-L)
  • 1553-7404
OpenAlex
W2005255392
Cited by
162
References
59
Citations by year
2026: 5 · 2025: 5 · 2024: 8 · 2023: 13 · 2022: 20 · 2021: 16 · 2020: 18 · 2019: 15 · 2018: 11 · 2017: 12 · 2016: 12 · 2015: 9 · 2014: 9 · 2013: 8
FWCI
3.34
Type
journal article
Language
en
Open access
Locations
  • PLoS Genetics (publishedVersion, cc-by)
  • Europe PMC (PubMed Central) (publishedVersion, cc-by)
  • PubMed Central (publishedVersion, cc-by)
  • PubMed (publishedVersion)
  • Kölner Universitäts PublikationsServer (Universität zu Köln) (publishedVersion)
  • DOAJ (DOAJ: Directory of Open Access Journals) (submittedVersion, cc-by-sa)
  • Figshare (submittedVersion, cc-by)
Funders
  • Deutsche Forschungsgemeinschaft (SFB635, C4, 233078, SFB 635)
  • FP7 Ideas: European Research Council (233078)
Topics
  • Life Sciences › Biochemistry, Genetics and Molecular Biology › Molecular Biology › Mitochondrial Function and Pathology
  • Life Sciences › Neuroscience › Cellular and Molecular Neuroscience › Alzheimer's disease research and treatments
  • Life Sciences › Biochemistry, Genetics and Molecular Biology › Cell Biology › Autophagy in Disease and Therapy
Keywords
prohibitin, PHB2, prohibitin 1, OPA1, mitochondrial fusion, mitochondrial fission, mitochondrial dynamics, tau hyperphosphorylation, neurodegeneration, hippocampal neurons, mitochondrial ultrastructure, mitochondrial genome stability, respiratory deficiency, neuronal aging, cognitive impairment, autosomal dominant optic atrophy
MeSH terms
Prohibitins, Animals, Membrane Fusion, Mitochondria, Morphogenesis, Neurons, Phosphorylation, Repressor Proteins, tau Proteins, Apoptosis, Neurodegenerative Diseases, Optic Atrophy, Autosomal Dominant, Caenorhabditis elegans Proteins, Mitochondrial Membranes, Mice, Genome, Mitochondrial

About these checks

Registry, retraction, Cites and statistics results are computed, not judged, with one exception: a printed reference that no index lists is read once by a model before it counts as a citation error. Claims are extracted by a model and kept only when their quote appears verbatim in the text; each cited source is then checked, with a model’s help, for whether it says what the claim relies on. Those verdicts can be wrong — read the claim’s quote and the cited source before relying on one.

Statistics and arithmetic are recomputed, not judged.

Confidence bands are shown only for fields calibrated on our annotated test set. None is calibrated yet, so no band is shown.

What counts as a claim ›How we measure confidence ›How we check this ›

Are you an author, or do you see a problem with this page? Request a review