

The DOI matches its Crossref record; 50 of the 50 references it cites were found in a registry or an index.
Fine-Mapping the Genetic Association of the Major Histocompatibility Complex in Multiple Sclerosis: HLA and Non-HLA Effects
Open accessAbstract
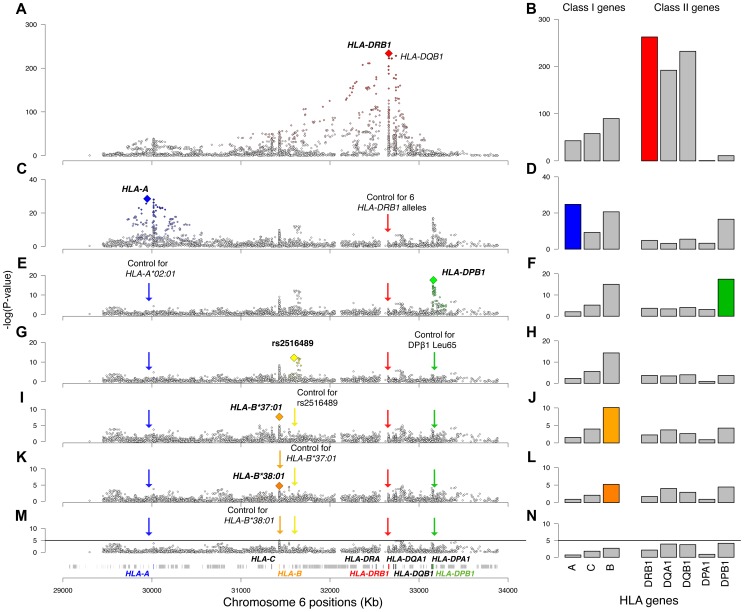
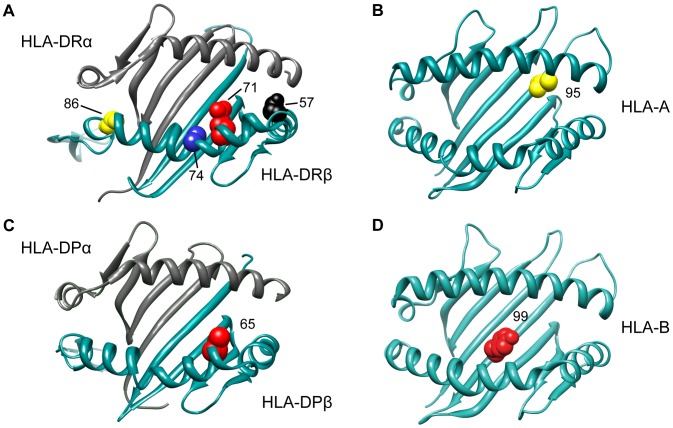
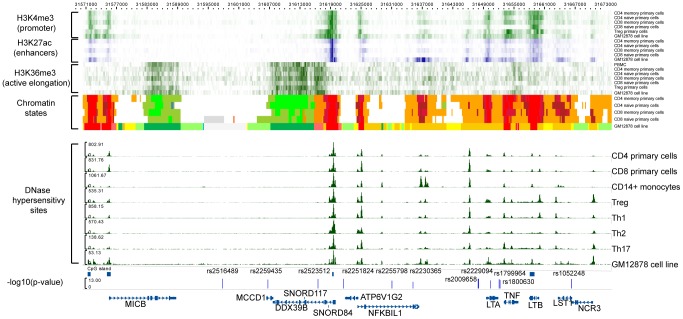
The major histocompatibility complex (MHC) region is strongly associated with multiple sclerosis (MS) susceptibility. HLA-DRB1*15:01 has the strongest effect, and several other alleles have been reported at different levels of validation. Using SNP data from genome-wide studies, we imputed and tested classical alleles and amino acid polymorphisms in 8 classical human leukocyte antigen (HLA) genes in 5,091 cases and 9,595 controls. We identified 11 statistically independent effects overall: 6 HLA-DRB1 and one DPB1 alleles in class II, one HLA-A and two B alleles in class I, and one signal in a region spanning from MICB to LST1. This genomic segment does not contain any HLA class I or II genes and provides robust evidence for the involvement of a non-HLA risk allele within the MHC. Interestingly, this region contains the TNF gene, the cognate ligand of the well-validated TNFRSF1A MS susceptibility gene. The classical HLA effects can be explained to some extent by polymorphic amino acid positions in the peptide-binding grooves. This study dissects the independent effects in the MHC, a critical region for MS susceptibility that harbors multiple risk alleles.
Overview
The claims and statistics of this paper haven’t been checked yet.
Run the check — free, no account needed. It reads the open-access text and checks the sources it cites.
Integrity signals
Registry
Cites
Statistics
Figures
Verification
Claims the paper makes
The claims and statistics of this paper haven’t been checked yet.
Run the check — free, no account needed. It reads the open-access text and checks the sources it cites.
Claims other papers make about this one
Each is checked against this paper’s own text: does it say what the citing paper says it does?
The source backs part of the claim, not all of it — or backs it for a different population, condition or comparison.
In the citing paper
“However, the nature of the interaction may be more complicated than expected, with multiple different amino acid‐level alleles demonstrating consistent interaction with HLA‐DRB1*15:01, in addition to the HLA‐DQA1*01:01 allele.”
From Genome‐wide association studies of multiple sclerosis (2018) · cites this paper as [51]
Experimental — accuracy not yet measuredIn the citing paper
“the DR15 haplotype and its component alleles also associate with protection against diabetes108, a high risk for multiple sclerosis109,110, and risk or protective effects with many other immune-mediated diseases”
From Genetic meta-analysis of diagnosed Alzheimer’s disease identifies new risk loci and implicates Aβ, tau, immunity and lipid processing (2019) · cites this paper as [109]
Self-check
Percentages, sums and reported differences re-computed from the paper’s own numbers.
The self-check needs the paper’s full text.
Citations
Cites
Regression shrinkage and selection via the lasso
Tibshirani, R. (1996) · Journal of the Royal Statistical Society Series B: Statistical Methodology · doi:10.1111/j.2517-6161.1996.tb02080.x · Cited by 51,482
UCSF Chimera—A visualization system for exploratory research and analysis
Pettersen, E. F., Goddard, T. D., Huang, C. C., Couch, G. S., Greenblatt, D. M., Meng, E. C., & Ferrin, T. E. (2004) · Journal of Computational Chemistry · doi:10.1002/jcc.20084 · Cited by 46,047
PLINK: a tool set for whole-genome association and population-based linkage analyses.
Purcell, S., Neale, B., Todd-Brown, K., Thomas, L., Ferreira, M. A. R., Bender, D., Maller, J., Sklar, P., de Bakker, P. I. W., Daly, M. J., et al. (2007) · The American Journal of Human Genetics · doi:10.1086/519795 · Cited by 34,089
Regularization and Variable Selection Via the Elastic Net
Zou, H., & Hastie, T. (2005) · Journal of the Royal Statistical Society Series B: Statistical Methodology · doi:10.1111/j.1467-9868.2005.00503.x · Cited by 20,957
An integrated encyclopedia of DNA elements in the human genome
The ENCODE Project Consortium (2012) · Nature · doi:10.1038/nature11247 · Cited by 18,072
Efron, B., Hastie, T., Johnstone, I., & Tibshirani, R. (2004) · The Annals of Statistics · doi:10.1214/009053604000000067 · Cited by 9,357
A note on a general definition of the coefficient of determination
NAGELKERKE, N. J. D. (1991) · Biometrika · doi:10.1093/biomet/78.3.691 · Cited by 5,927
Regression Shrinkage and Selection via The Lasso: A Retrospective
Tibshirani, R. J. (2011) · Journal of the Royal Statistical Society Series B (Statistical Methodology) · doi:10.1111/j.1467-9868.2011.00771.x · Cited by 3,601
Genetic risk and a primary role for cell-mediated immune mechanisms in multiple sclerosis
The International Multiple Sclerosis Genetics Consortium & The Wellcome Trust Case Control Consortium 2 (2011) · Nature · doi:10.1038/nature10251 · Cited by 2,697
ChromHMM: automating chromatin-state discovery and characterization
Ernst, J., & Kellis, M. (2012) · Nature Methods · doi:10.1038/nmeth.1906 · Cited by 2,482
Cited by
Sorted by citations
Integration of summary data from GWAS and eQTL studies predicts complex trait gene targets
Zhu, Z., Zhang, F., Hu, H., Bakshi, A., Robinson, M. R., Powell, J. E., Montgomery, G. W., Goddard, M. E., Wray, N. R., Visscher, P. M., et al. (2016) · Nature Genetics · doi:10.1038/ng.3538 · Cited by 3,352
Alzheimer Disease Genetics Consortium (ADGC), Kunkle, B. W., The European Alzheimer’s Disease Initiative (EADI), Cohorts for Heart and Aging Research in Genomic Epidemiology Consortium (CHARGE), Genetic and Environmental Risk in AD/Defining Genetic, P. A. E. R. F. A. D. C. (., Grenier-Boley, B., Sims, R., Bis, J. C., Damotte, V., Naj, A. C., et al. (2019) · Nature Genetics · doi:10.1038/s41588-019-0358-2 · Cited by 2,946
Thompson, A. J., Baranzini, S. E., Geurts, J. J. G., Hemmer, B., & Ciccarelli, O. (2018) · The Lancet · doi:10.1016/s0140-6736(18)30481-1 · Cited by 1,979
Multiple sclerosis genomic map implicates peripheral immune cells and microglia in susceptibility
International Multiple Sclerosis Genetics Consortium, Patsopoulos, N. A., Baranzini, S. E., Santaniello, A., Shoostari, P., Cotsapas, C., Wong, G., Beecham, A. H., James, T., Replogle, J., et al. (2019) · Science · doi:10.1126/science.aav7188 · Cited by 1,471
“One-third (9 out of 31) of the identified variants lie within either intergenic regions or in a long-range haplotype that contains several nonclassical HLA and other non-HLA genes (17).”
BackgroundSelf-citationDiagnosis and Treatment of Multiple Sclerosis: A Review
McGinley, M. P., Goldschmidt, C. H., & Rae-Grant, A. D. (2021) · JAMA · doi:10.1001/jama.2020.26858 · Cited by 1,205
Metadata
- Authors
- Patsopoulos, N. A., Barcellos, L. F., Hintzen, R. Q., Schaefer, C., van Duijn, C. M., Noble, J. A., Raj, T., IMSGC, ANZgene, Gourraud, P.-A., Stranger, B. E., Oksenberg, J., Olsson, T., Taylor, B. V., Sawcer, S., Hafler, D. A., Carrington, M., De Jager, P. L., & de Bakker, P. I. W.
- Affiliations
- Broad Institute (US)
- Kaiser Permanente (US)
- Erasmus MC (NL)
- University of California, San Francisco (US)
- University of Chicago (US)
- Karolinska Institutet (SE)
- University of Tasmania (AU)
- University of Cambridge (GB)
- ORCID
- Venue
- PLoS Genetics
- Publisher
- Public Library of Science (PLoS)
- Published
- 2013-11-21
- Volume
- 9
- Issue
- 11
- Pages
- e1003926
- ISSN
- 1553-7390 (ISSN-L)
- 1553-7404
- PMC
- PMC3836799
- OpenAlex
- W2164021954
- Cited by
- 312
- References
- 50
- Citations by year
- 2026: 19 · 2025: 14 · 2024: 23 · 2023: 19 · 2022: 17 · 2021: 32 · 2020: 30 · 2019: 32 · 2018: 26 · 2017: 21 · 2016: 27 · 2015: 28 · 2014: 22 · 2013: 1
- FWCI
- 19.49
- Type
- journal article
- Language
- en
- Open access
- gold
- doi.org
- Licence
- public-domain
- creativecommons.org/publicdomain/zero/1.0/ (vor)
- Locations
- PLoS Genetics (publishedVersion, public-domain)
- Europe PMC (PubMed Central) (publishedVersion, public-domain)
- PubMed Central (publishedVersion, public-domain)
- PubMed (publishedVersion)
- Monash University Research Portal (Monash University) (acceptedVersion, other-oa)
- EUR Research Repository (Erasmus University Rotterdam) (acceptedVersion, other-oa)
- QUT ePrints (Queensland University of Technology) (submittedVersion, cc-by)
- Digital Access to Scholarship at Harvard (DASH) (Harvard University) (submittedVersion, cc-by)
- eCite Digital Repository (University of Tasmania) (submittedVersion, public-domain)
- UWA Profiles and Research Repository (UWA) (submittedVersion)
- Murdoch University Research Portal (submittedVersion)
- Knowledge@UChicago (University of Chicago) (submittedVersion, cc-by-nc-nd)
- EUR Research Repository (Erasmus University Rotterdam) (submittedVersion, other-oa)
- RePub (Erasmus University Rotterdam) (submittedVersion, other-oa)
- DOAJ (DOAJ: Directory of Open Access Journals) (submittedVersion, cc-by-sa)
- DSpace@MIT (Massachusetts Institute of Technology) (submittedVersion, cc-by-nc)
- eScholarship (California Digital Library) (submittedVersion)
- eScholarship (California Digital Library) (submittedVersion, public-domain)
- Figshare (submittedVersion)
- Figshare (submittedVersion, cc-by)
- Työväentutkimus Vuosikirja (submittedVersion)
- Minerva Access (University of Melbourne) (submittedVersion)
- RePub (Erasmus University Rotterdam) (submittedVersion)
- University of Chicago
- Funders
- U.S. Department of Health and Human Services (HHSN261200800001E)
- National Multiple Sclerosis Society (JF2138A1)
- John T. Reid Charitable Trusts
- Frederick National Laboratory for Cancer Research (HHSN261200800001E.)
- National Institute for Health and Care Research (NF-SI-0508-10335)
- Multiple Sclerosis Society
- Multiple Sclerosis Australia
- Forskningsrådet för Arbetsliv och Socialvetenskap
- Nederlandse Organisatie voor Wetenschappelijk Onderzoek (016.126.354)
- Stockholms Läns Landsting (562183)
- Vetenskapsrådet
- Trish Multiple Sclerosis Research Foundation
- National Institutes of Health (Contract No. HHSN261200800001E., #HHSN261200800001E, HHSN261200800001C)
- U.S. Public Health Service (NIH/NIAID R01AI076544)
- Australian Research Council (LP0776744)
- National Cancer Institute (HHSN261200800001E))
- National Institute of Allergy and Infectious Diseases (HHSN261200800001E, R01AI076544)
- National Institute of Neurological Disorders and Stroke (R01 NS0495103, R01NS026799, R01NS049510, NIH/NINDS R01NS049510, R01NS049477)
- Topics
- Health Sciences › Medicine › Clinical Neurology › Multiple Sclerosis Research Studies
- Life Sciences › Biochemistry, Genetics and Molecular Biology › Genetics › Genetic Associations and Epidemiology
- Life Sciences › Immunology and Microbiology › Immunology › Psoriasis: Treatment and Pathogenesis
- Keywords
- multiple sclerosis, major histocompatibility complex, HLA-DRB1*1501, TNF-α, TNFRSF1A, disease susceptibility, fine mapping
- MeSH terms
- Alleles, Chromosome Mapping, Haplotypes, Humans, Major Histocompatibility Complex, Membrane Proteins, Multiple Sclerosis, Histocompatibility Antigens Class I, Linkage Disequilibrium, Genetic Predisposition to Disease, Polymorphism, Single Nucleotide, Receptors, Tumor Necrosis Factor, Type I, Intracellular Signaling Peptides and Proteins, Genome-Wide Association Study, HLA-DRB1 Chains, HLA-DP beta-Chains
About these checks
Registry, retraction, Cites and statistics results are computed, not judged, with one exception: a printed reference that no index lists is read once by a model before it counts as a citation error. Claims are extracted by a model and kept only when their quote appears verbatim in the text; each cited source is then checked, with a model’s help, for whether it says what the claim relies on. Those verdicts can be wrong — read the claim’s quote and the cited source before relying on one.
Statistics and arithmetic are recomputed, not judged.
Confidence bands are shown only for fields calibrated on our annotated test set. None is calibrated yet, so no band is shown.
What counts as a claim ›How we measure confidence ›How we check this ›
Are you an author, or do you see a problem with this page? Request a review
