

The DOI matches its Crossref record; 100 of the 100 references it cites were found in a registry or an index.
Mismatch Repair Genes Mlh1 and Mlh3 Modify CAG Instability in Huntington's Disease Mice: Genome-Wide and Candidate Approaches
Open accessAbstract
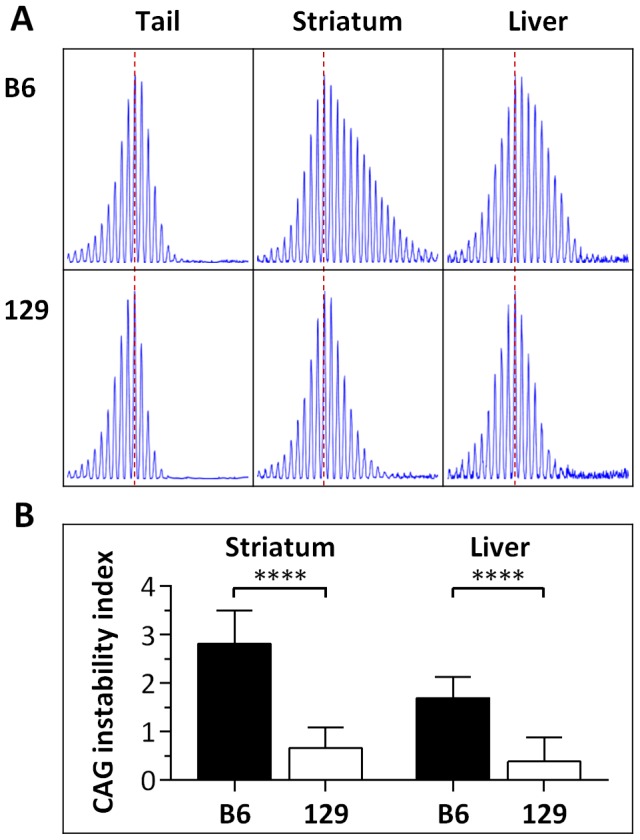
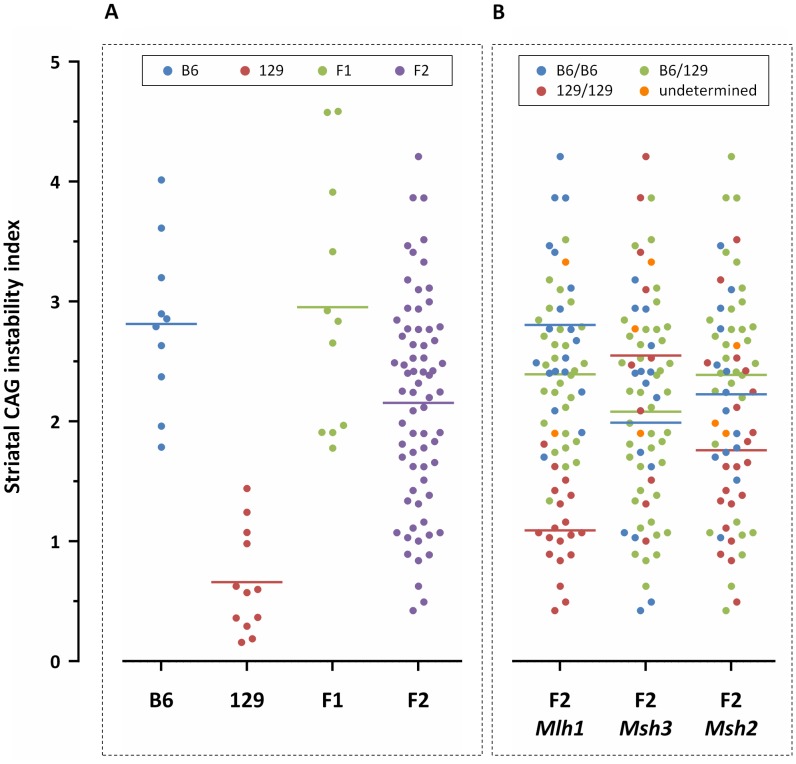
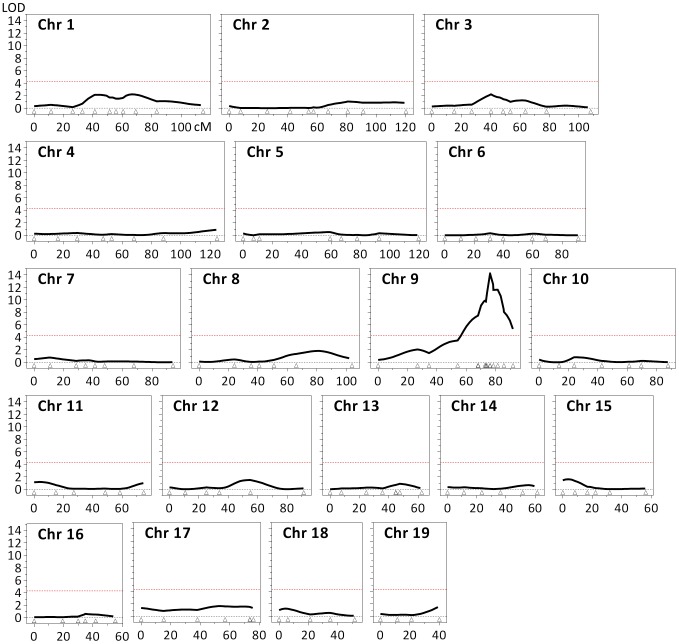
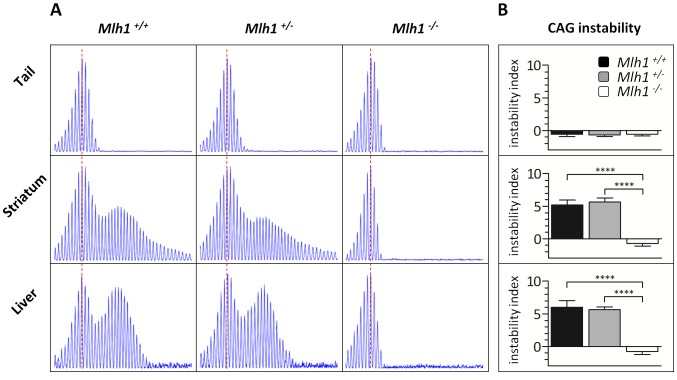
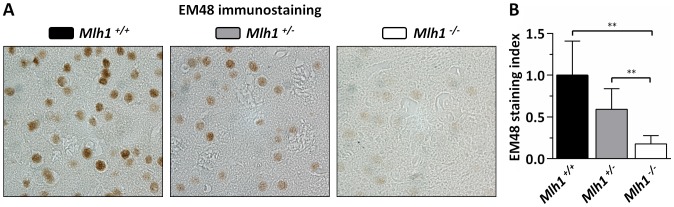
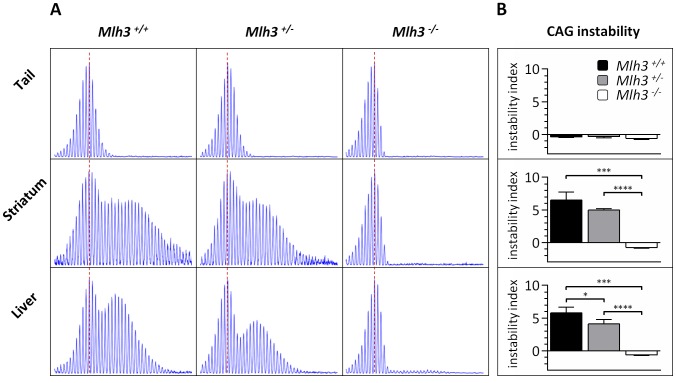
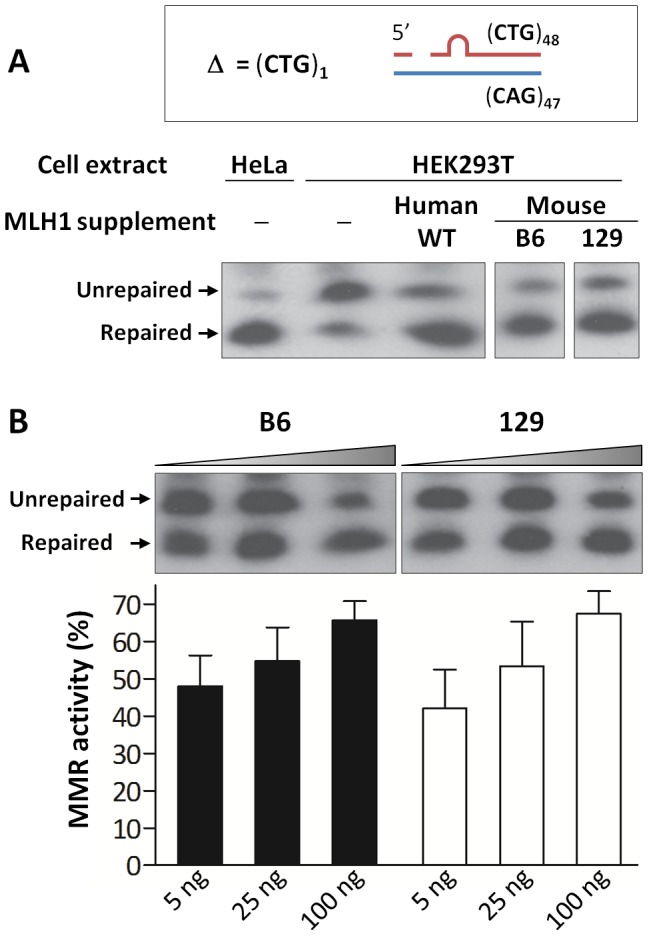
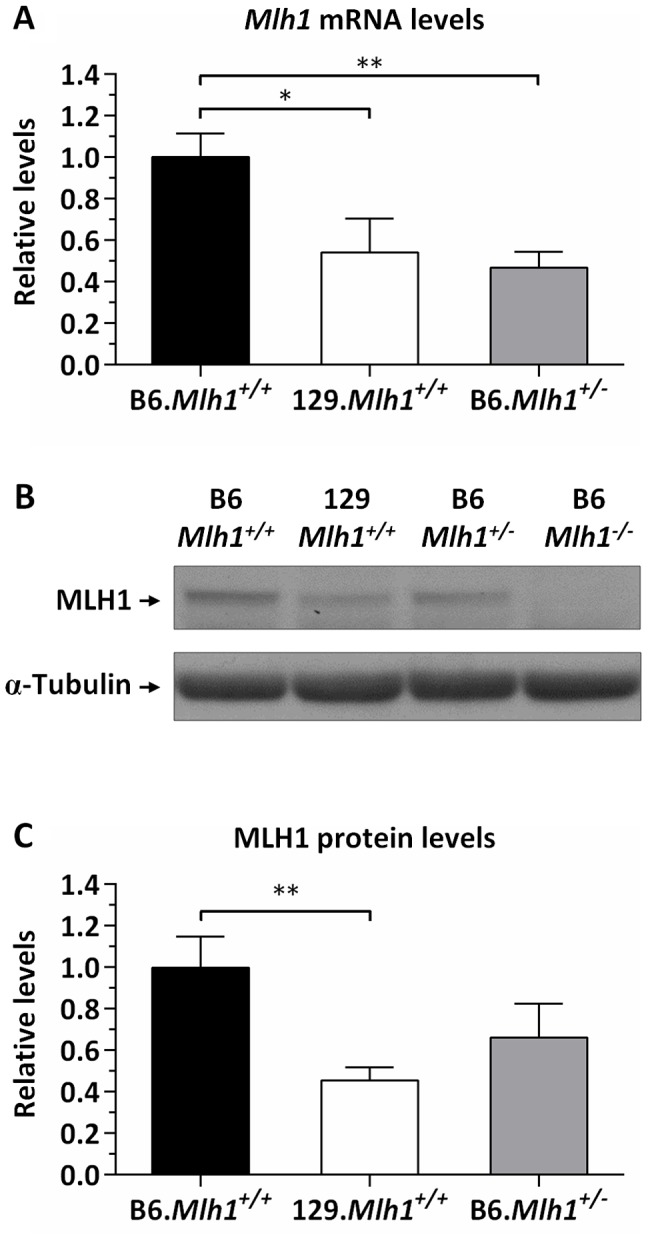
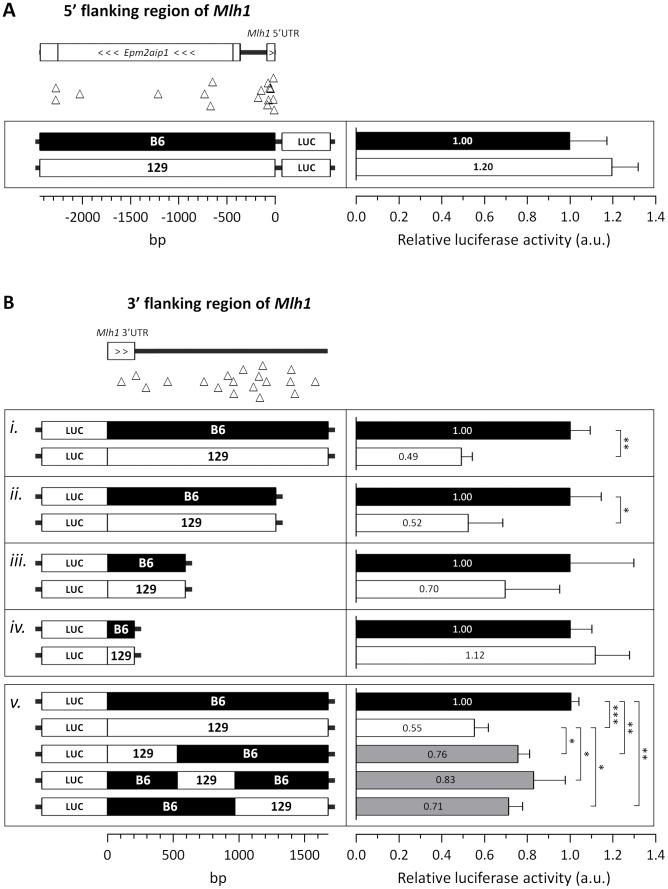
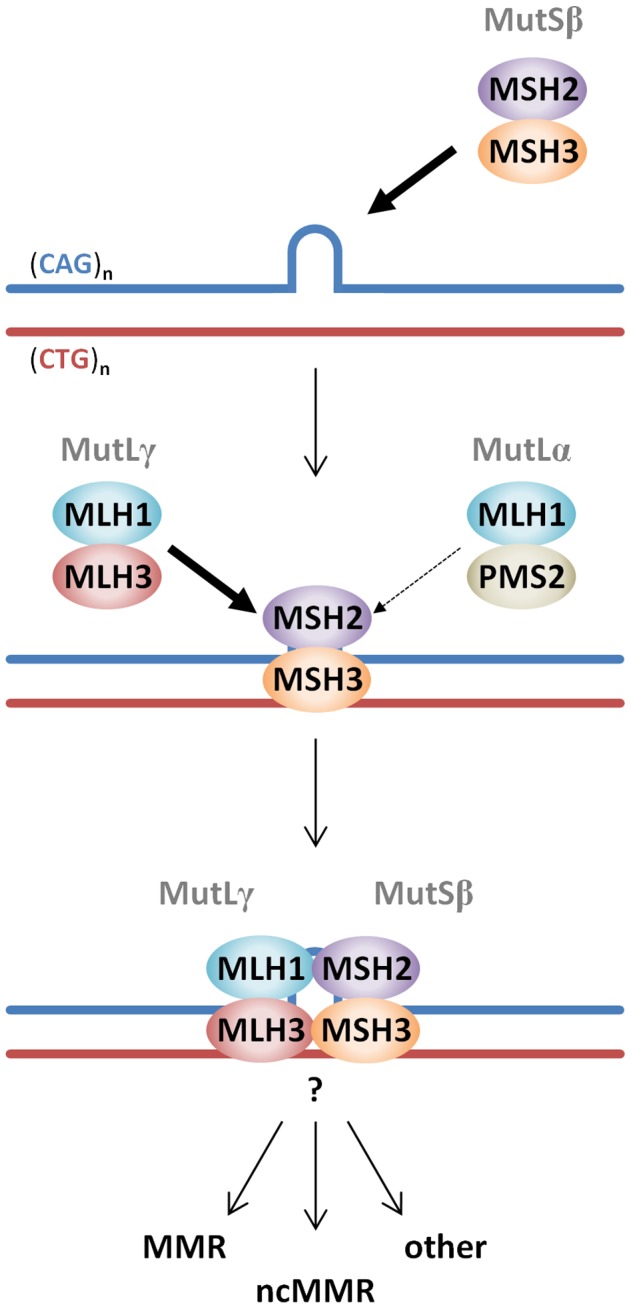
The Huntington's disease gene (HTT) CAG repeat mutation undergoes somatic expansion that correlates with pathogenesis. Modifiers of somatic expansion may therefore provide routes for therapies targeting the underlying mutation, an approach that is likely applicable to other trinucleotide repeat diseases. Huntington's disease Hdh(Q111) mice exhibit higher levels of somatic HTT CAG expansion on a C57BL/6 genetic background (B6.Hdh(Q111) ) than on a 129 background (129.Hdh(Q111) ). Linkage mapping in (B6x129).Hdh(Q111) F2 intercross animals identified a single quantitative trait locus underlying the strain-specific difference in expansion in the striatum, implicating mismatch repair (MMR) gene Mlh1 as the most likely candidate modifier. Crossing B6.Hdh(Q111) mice onto an Mlh1 null background demonstrated that Mlh1 is essential for somatic CAG expansions and that it is an enhancer of nuclear huntingtin accumulation in striatal neurons. Hdh(Q111) somatic expansion was also abolished in mice deficient in the Mlh3 gene, implicating MutLγ (MLH1-MLH3) complex as a key driver of somatic expansion. Strikingly, Mlh1 and Mlh3 genes encoding MMR effector proteins were as critical to somatic expansion as Msh2 and Msh3 genes encoding DNA mismatch recognition complex MutSβ (MSH2-MSH3). The Mlh1 locus is highly polymorphic between B6 and 129 strains. While we were unable to detect any difference in base-base mismatch or short slipped-repeat repair activity between B6 and 129 MLH1 variants, repair efficiency was MLH1 dose-dependent. MLH1 mRNA and protein levels were significantly decreased in 129 mice compared to B6 mice, consistent with a dose-sensitive MLH1-dependent DNA repair mechanism underlying the somatic expansion difference between these strains. Together, these data identify Mlh1 and Mlh3 as novel critical genetic modifiers of HTT CAG instability, point to Mlh1 genetic variation as the likely source of the instability difference in B6 and 129 strains and suggest that MLH1 protein levels play an important role in driving of the efficiency of somatic expansions.
Overview
The claims and statistics of this paper haven’t been checked yet.
Run the check — free, no account needed. It reads the open-access text and checks the sources it cites.
Integrity signals
Registry
Cites
Statistics
Figures
Verification
Claims the paper makes
The claims and statistics of this paper haven’t been checked yet.
Run the check — free, no account needed. It reads the open-access text and checks the sources it cites.
Claims other papers make about this one
Each is checked against this paper’s own text: does it say what the citing paper says it does?
In the citing paper
“Notably, CAG expansion has been found to be dependent upon DNA repair proteins such as OGG1, MLH1, and MSH2, whose detection of oxidized or mismatched bases in these repetitive elements could potentially elicit erroneous repair, leading to CAG expansion (Kovtun et al, 2007; Bettencourt et al, 2016; Pinto et al, 2013; Manley et al, 1999; Lee et al, 2017, 1).”
From Mechanisms of DNA damage-mediated neurotoxicity in neurodegenerative disease (2022) · cites this paper as Pinto et al, 2013
Self-check
Percentages, sums and reported differences re-computed from the paper’s own numbers.
The self-check needs the paper’s full text.
Citations
Cites
A new mathematical model for relative quantification in real-time RT-PCR
Pfaffl, M. W. (2001) · Nucleic Acids Research · doi:10.1093/nar/29.9.e45 · Cited by 34,610 · cited 1×
“Relative mRNA expression levels were determined using the 2 2 DD Cp method [94] by normalization to the housekeeping gene Actb (Mm00607939_s1).”
MethodFast, scalable generation of high-quality protein multiple sequence alignments using Clustal Omega
Sievers, F., Wilm, A., Dineen, D., Gibson, T., Karplus, K., Li, W.-Z., Lopez, R., McWilliam, H., Remmert, M., Söding, J., et al. (2011) · Molecular Systems Biology · doi:10.1038/msb.2011.75 · Cited by 15,576 · cited 1×
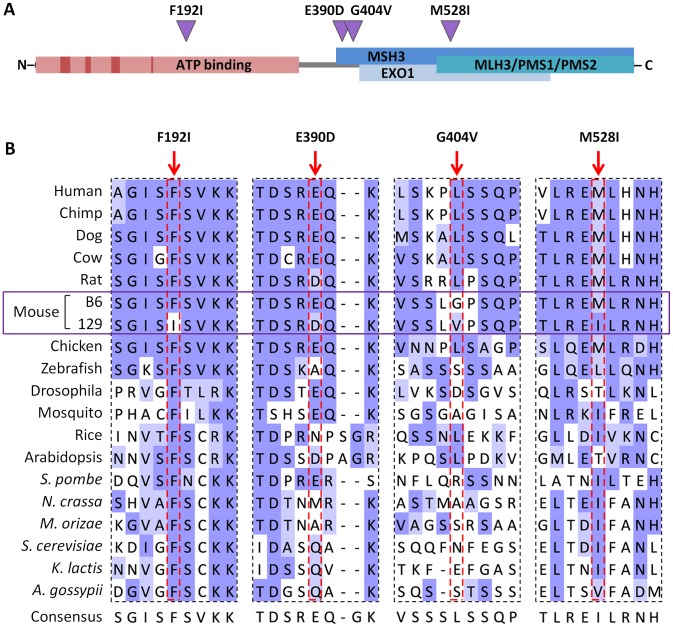
“Protein sequence alignment was performed using Clustal Omega [96] and visualized in Jalview [97] with BLOSUM62 color scheme: white, residue does not match the consensus residue at that position; light blue, residue does not match the consensus residue but the two residues have a positive BLOSUM62 score; dark blue, res…”
MethodA method and server for predicting damaging missense mutations.
Adzhubei, I. A., Schmidt, S., Peshkin, L., Ramensky, V. E., Gerasimova, A., Bork, P., Kondrashov, A. S., & Sunyaev, S. R. (2010) · Nature Methods · doi:10.1038/nmeth0410-248 · Cited by 13,194 · cited 1×
“[48] predicting E390D, G404V and M528I to be ‘‘benign’’, but”
Jalview Version 2—a multiple sequence alignment editor and analysis workbench
Waterhouse, A. M., Procter, J. B., Martin, D. M. A., Clamp, M. E., & Barton, G. J. (2009) · Bioinformatics · doi:10.1093/bioinformatics/btp033 · Cited by 10,349
MACDONALD, M. (1993) · Cell · doi:10.1016/0092-8674(93)90585-e · Cited by 8,366
Lander, E. S., Green, P., Abrahamson, J., Barlow, A., Daly, M. J., Lincoln, S. E., & Newberg, L. A. (1987) · Genomics · doi:10.1016/0888-7543(87)90010-3 · Cited by 6,657 · cited 1×
“Linkage analysis was performed using Mapmaker/QTL [81–84], with striatal HTT CAG instability indices as quantitative traits.”
MethodSelf-citationGenetic dissection of complex traits: guidelines for interpreting and reporting linkage results
Lander, E. S., & Kruglyak, L. (1995) · Nature Genetics · doi:10.1038/ng1195-241 · Cited by 5,236 · cited 3×
“A threshold LOD-score of 4.3 was considered for the identification of significant QTLs [85].”
BackgroundInfluentialMapping mendelian factors underlying quantitative traits using RFLP linkage maps.
Lander, E. S., & Botstein, D. (1989) · Genetics · doi:10.1093/genetics/121.1.185 · Cited by 5,236
Shah, M. A., Datson, N. A., Srinidhi, L., Stanton, V. P., MacDonald, M. E., Allard, M. W., Youngman, S., Am, F., Mott, R., Draths, K., et al. (1993) · Cell · Cited by 3,055
Mouse genomic variation and its effect on phenotypes and gene regulation.
Keane, T. M., Goodstadt, L., Danecek, P., White, M. A., Wong, K., Yalcin, B., Heger, A., Agam, A., Slater, G., Goodson, M., et al. (2011) · Nature · doi:10.1038/nature10413 · Cited by 1,580 · cited 10×
“(B) Distribution of polymorphisms identified between B6, 129, FVB and DBA mouse strains at a 16 kb genomic region containing the Trex1 and Atrip genes (chr9:109,057,932–109,074,124; GRCm38/ mm10) using information from the Mouse Genomes Project [44,45].”
BackgroundMethodInfluential
Research works printed but not linked: 2
- Lincoln SE, Daly MJ, Lander ES (1993) Constructing Genetic Linkage Maps with MAPMAKER/EXP Version 3.0: A Tutorial and Reference Manual. Whitehead Institute for Biomedical Research Technical Report, 3rd edition.
- Lincoln SE, Daly MJ, Lander ES (1993) Mapping Genes Controlling Quantitative Traits Using MAPMAKER/QTL Version 1.1: A Tutorial and Reference Manual. Whitehead Institute for Biomedical Research Technical Report, 2nd edition.
Cited by
Sorted by citations
Items 201–249 of 249
Aretz, J., Jeyasankar, G., Salerno-Kochan, A., Thomsen, M., Thieulin‐Pardo, G., Haque, T. S., Monteagudo, E. S., Felsenfeld, D. P., Finley, M., Vogt, T., et al. (2024) · bioRxiv (Cold Spring Harbor Laboratory) · doi:10.1101/2024.10.09.617442 · Cited by 2
Collingwood, B. W., Witte, S. J., & Manhart, C. M. (2024) · Biomolecules · doi:10.3390/biom14111442 · Cited by 1
Yeasmin, A., & Torrente, M. P. (2025) · Biology · doi:10.3390/biology14111556 · Cited by 1
Pelzel, R. J., Herbst, M., Rozema, N. B., Solem, M. A., & Gómez‐Pastor, R. (2026) · Neurotherapeutics · doi:10.1016/j.neurot.2026.e00859 · Cited by 1
“Several DNA repair proteins, especially those involved in the mismatch repair pathway (MMR) such MSH2, MSH3 and MLH1 are involved in the regulation of CAG repeat instability with many studies investigating the potential therapeutic benefits of manipulating such targets [113 – 116].”
DNA Damage Repair: A Crucial Link to Neurological Disorders
Yang, H., Deng, Y., Chen, W., Zhu, W., & Lu, X. (2026) · The FASEB Journal · doi:10.1096/fj.202504689r · Cited by 1
“DNA repair factors in the MMR machinery, including MSH3, MLH1, PMS1, PMS2, and FAN1, have been identified as determinants influencing the course of HD [147, 148, 152, 158].”
Mechanism of MutLβ-dependent DNA expansions
Kadyrova, L. Y., Kadyrov, F. F., HAYWARD, B., Usdin, K., & Kadyrov, F. A. (2026) · Proceedings of the National Academy of Sciences · doi:10.1073/pnas.2601397123 · Cited by 1
“~ 50 REDs have been identified and the list of REDs is likely to continue to grow because similar DNA repeats that may expand are present in other human genes (2–5).”
InfluentialTargeting DNA mismatch repair in Huntington’s disease
Bunting, E. L., Panhale, A., McColgan, P., Koi, M., Brundin, P., & Carethers, J. M. (2026) · Trends in Neurosciences · doi:10.1016/j.tins.2026.06.004 · Cited by 1
Antonijevic, I. A., Bettencourt, B. R., Bialek, P., Ge, P., Ding, S.-Y., Lai, G., Hedde, J. R., Asp, E., Seth, M., Marnellos, G., et al. (2022) · GEN Biotechnology · doi:10.1089/genbio.2021.0012 · Cited by 1
“44,48”
Deleanu, R. (2025) · International Journal of Molecular Sciences · doi:10.3390/ijms26199755 · Cited by 1
DNA mismatch repair in mammals
Cherkasova, V. (2021) · Elsevier eBooks · doi:10.1016/b978-0-323-85679-9.00018-0 · Cited by 1
Yang, B., Borgeaud, A. C., Aeschbach, L., & Dion, V. (2018) · ORCA Online Research @Cardiff (Cardiff University) · doi:10.1101/368480 · Cited by 1
The importance of being a volunteer.
Hodges, E. N. (1993) · PubMed · Cited by 1
Antagonistic roles of canonical and alternative RPA in tandem CAG repeat diseasesPreprint
Gall-Duncan, T., Luo, J., Jurkovic, C.-M., Fischer, L. A., Fujita, K., Leib, D. E., Li, V., Harding, R., Tran, S., Chen, R., et al. (2022) · bioRxiv (Cold Spring Harbor Laboratory) · doi:10.1101/2022.10.24.513561 · Cited by 1
Self-citationHayward, B. E., Kim, G.-Y., Miller, C. J., McCann, C., Lowery, M. G., Wood, R. D., & Usdin, K. (2024) · bioRxiv (Cold Spring Harbor Laboratory) · doi:10.1101/2024.11.05.621911 · Cited by 1
Kashin, S., Lee, W., McDonald, T. M., Morris, K., Handsaker, R. E., Mello, C. J., Spina, L., Reed, N. M., de Rivera, H., Jana, S. H., et al. (2026) · Cell · doi:10.64898/2025.12.09.688862 · Cited by 2
Somatic CRISPR editing of Msh3 mitigates Huntington’s disease pathology in micePreprint
Oliver, E., Kovalenko, M. V., Louçã, M., Jiang, A., Westerdahl, J., Correia, K., Jones, B. P., Saif, F., Romano, N., Sidhu, A., et al. (2026) · bioRxiv (Cold Spring Harbor Laboratory) · doi:10.64898/2026.06.08.730940 · Cited by 1
“…time points were selected at which there are low (6 weeks), moderate (16 weeks) or high levels (24 weeks) of CAG expansion in the striatum 17 , and analysis time points were selected for which molecular and histological phenotypes had been previously well characterized in this line 15,16,29,30 .”
Self-citationGenetic Modifiers in H untington Disease
Clabough, E. B. D., Thompson, J., Lau, J. H., Savarese, M., Harris, E. C., Manos, S. T., Kyle, C. T., Meinhardt, J. T., Sheffield, J., Boudin, M. D., et al. (2016) · Encyclopedia of Life Sciences · doi:10.1002/9780470015902.a0026547
Dissecting the Genetic Basis of Parkinson Disease, Dystonia and Chorea
Mencacci, N. (2016) · UCL Discovery (University College London)
Trinucleotide Repeat Instability is Modulated by DNA Base Lesions and DNA Base Excision Repair
Beaver, J. M. (2016) · FIU - Digital Commons (Florida International University) · doi:10.25148/etd.fidc001178
“which is involved in all 3 mammalian MutL complexes, and MLH3 were found to be involved in somatic TNR expansions in HD mouse models (195, 196).”
BackgroundMechanisms of Repeat Instability in Fragile X Syndrome
Usdin, K., Gazy, I., & Zhao, X.-N. (2017) · Elsevier eBooks · doi:10.1016/b978-0-12-804461-2.00005-6
The effect of prenatal Vitamin C deficiency on endochondral ossification in guinea pigs
Rakocevic, N. (2017) · Porto Biomedical Journal · doi:10.1016/j.pbj.2017.07.085
Bassi, P. S. (2017) · TSpace (University of Toronto)
Kyriacou, C. P. (2018) · Faculty Opinions – Post-Publication Peer Review of the Biomedical Literature · doi:10.3410/f.734291335.793552569
Lewis, P. A., & Spillane, J. E. (2018) · Elsevier eBooks · doi:10.1016/b978-0-12-811069-0.00006-9
Msh2-Msh3 interferes with DNA metabolism in vivoPreprint
Medina‐Rivera, M., Phelps, S., Sridharan, M., Becker, J. T., Lamb, N. A., Kumar, C., Sutton, M. D., Bielinsky, A., Balakrishnan, L., & Surtees, J. A. (2022) · bioRxiv (Cold Spring Harbor Laboratory) · doi:10.1101/2022.09.06.506750
“Notably, all three Mlh complexes play a role in Msh2-Msh3-mediated TNR expansion (66,123,125-128).”
BackgroundCell type-specific translatome analysis of mouse models of three genetic neurodegenerative diseases
Bauer, S. (2023) · Linköping University medical dissertations · doi:10.3384/9789180751469
DNA Methylation and Epigenetic Aging Biomarkers in Huntington’s Disease
Thomas, E. A. (2023) · Contemporary clinical neuroscience · doi:10.1007/978-3-031-32815-2_15
RNA-mediated pathogenic mechanisms in Huntington's disease
Bates, G. P., Fieńko, S., Landles, C., & Papadopoulou, A. S. (2024) · Elsevier eBooks · doi:10.1016/b978-0-323-95672-7.00005-4
Attenuated huntingtin gene CAG nucleotide repeat size in individuals with Lynch syndrome
Skarping, K. D., Arning, L., Petersén, Å., Nguyen, H. P., & Gebré‐Medhin, S. (2024) · Scientific Reports · doi:10.1038/s41598-024-54277-5
“Experimentally, in mouse models of HD, there is long-standing evidence that reduced expression of the MMR proteins Msh2, Msh3, Mlh1 or Mlh3 counteracts somatic CAG repeat expansion 23,24 and de-escalates the HD experimental pathogenic process 25 .”
BackgroundUsing gene or cell therapies to treat Huntington's disease
Binda, C. S., Lelos, M. J., Rosser, A., & Massey, T. H. (2024) · Handbook of clinical neurology · doi:10.1016/b978-0-323-90120-8.00014-9 · Cited by 2
Kang, B., Murphy, M. A., Ng, C., Leventhal, M. J., Huynh, N. C., Im, E., Danquah, S. A., Housman, D. E., Nehme, R., Farhi, S. L., et al. (2025) · bioRxiv (Cold Spring Harbor Laboratory) · doi:10.1101/2025.02.19.639023
Winquist, R. J., & Church, B. (2025) · Biochemical Pharmacology · doi:10.1016/j.bcp.2025.117438
Casazza, K., Williams, G. M., Johengen, L., Keller, M., Hess, L. D., Phelps, S. E., Lamb, N. A., & Surtees, J. A. (2026) · bioRxiv (Cold Spring Harbor Laboratory) · doi:10.64898/2026.01.20.700715
Lee, E., Kim, W., Beier, D. H., Lee, Y., Kovalenko, M. V., Saif, F., Oliver, E., Srinageshwar, B., Murtha, R., Andrew, M. A., et al. (2026) · Proceedings of the National Academy of Sciences · doi:10.1073/pnas.2518854123
“Genomic DNA from mice at 3, 6, or 10 mo of age was isolated from tissues using the DNeasy DNA blood and tissue kit (Qiagen) and somatic CAG instability analysis was performed using a human - specific PCR assay that amplifies the HTT CAG repeat from the knock - in allele (41).”
Self-citationde Longprez, L. (2018) · theses.fr (ABES) · doi:10.70675/9c720f01z8077z49d5z9df8z8e7cc0c69a1a
Gene editing approaches of microsatellite disorders : shortening expanded repeats
Poggi, L. (2020) · theses.fr (ABES) · doi:10.70675/741f0470z28a0z4c3bz9e75ze578bdc49074 · Cited by 1
The role of the serum response factor in the pathogenesis of Huntington's disease
Awada, A. (2021) · theses.fr (ABES) · doi:10.70675/fabef4b5z9d78z440bz99f2z9be7d0814a03
Belgrad, J., Summers, A., Hildebrand, S. R., Sapp, E., Luu, E., Yamada, N., O’Reilly, D., Vogt, T., Howland, D., Yang, X. W., et al. (2026) · bioRxiv (Cold Spring Harbor Laboratory) · doi:10.64898/2026.05.08.723329
Goold, R., Donaldson, J., Gidney, F., Goff, P., Hamilton, J., Elmasri, M., Coupland, L., Flower, M. D., & Tabrizi, S. J. (2026) · NAR Molecular Medicine · doi:10.1093/narmme/ugag031
“Earlier mouse studies had already pointed to MMR as a driver of both HD phenotypes and repeat expansion [ 13 , 14 ], providing a plausible mechanism for their role in the disease.”
Miller, C. J., Jimenez, D. A., Walker, A., Anupindi, K., Hayward, B. E., Lorenzi, H., Usdin, K., & Zhao, X.-N. (2026) · PNAS Nexus · doi:10.1093/pnasnexus/pgag228
Chen, Y., Hu, H., Shang, X., Fishwick, K. M., Greco, G., Xiao, Q., Zhou, Y., Huang, Q., Jiang, T., Huang, X., et al. (2026) · Nature Communications · doi:10.1038/s41467-026-74991-0
“MLH1 promotes somatic CAG expansion and its protein levels in fl uence the ef fi ciency of this expansion 33,36 .”
Palma-Jiménez, M., Ramírez-Carvajal, L., Olafson, H. R., Wang, E. T., & Morales, F. (2026) · DNA repair · doi:10.1016/j.dnarep.2026.103950
Bergonzoni, G., Pellegrini, M., Savino, A., Lazioli, M., Geurs, S., Graziani, L., Ferrarini, D., Tusi, S. K., Oliver, E., Geurts, J., et al. (2026) · Brain Pathology · doi:10.1111/bpa.70135
Self-citationRedundant mispair excision mechanisms in eukaryotic DNA mismatch repair
Putnam, C. D., & Kolodner, R. D. (2026) · Nucleus · doi:10.1080/19491034.2026.2741514
“…by Msh2 seems to be important in repeat expansion in mice [159], and in mammals the nuclease activity of MLH1-MLH3 is required for expansion, whereas the evidence for the involvement of MLH1-PMS1 ( S. cerevisiae Mlh1-Mlh2) and MLH1-PMS2 ( S. cerevisiae Mlh1-Pms1) depends upon the study [160–164].”
Metadata
- Authors
- Pinto, R. M., Dragileva, E., Kirby, A., Lloret, A., Lopez, E., St. Claire, J., Panigrahi, G. B., Hou, C., Holloway, K., Gillis, T., Guide, J. R., Cohen, P. E., Li, G.-M., Pearson, C. E., Daly, M. J., & Wheeler, V. C.
- Affiliations
- Massachusetts General Hospital (US)
- Broad Institute (US)
- University of Toronto (CA)
- University of Kentucky (US)
- Cornell University (US)
- Corresponding author
- Wheeler, Vanessa C.
- ORCID
- Venue
- PLoS Genetics
- Publisher
- Public Library of Science (PLoS)
- Published
- 2013-10-31
- Volume
- 9
- Issue
- 10
- Pages
- e1003930
- ISSN
- 1553-7390 (ISSN-L)
- 1553-7404
- PMC
- PMC3814320
- OpenAlex
- W2107416433
- Cited by
- 250
- References
- 100
- Citations by year
- 2026: 20 · 2025: 24 · 2024: 32 · 2023: 26 · 2022: 12 · 2021: 30 · 2020: 27 · 2019: 8 · 2018: 19 · 2017: 16 · 2016: 17 · 2015: 11 · 2014: 7
- FWCI
- 5.66
- Type
- journal article
- Language
- en
- Open access
- gold
- doi.org
- Locations
- PLoS Genetics (publishedVersion, cc-by)
- Europe PMC (PubMed Central) (publishedVersion, cc-by)
- PubMed Central (publishedVersion, cc-by)
- PubMed (publishedVersion)
- UKnowledge (University of Kentucky) (submittedVersion, cc-by)
- Digital Access to Scholarship at Harvard (DASH) (Harvard University) (submittedVersion, cc-by)
- DOAJ (DOAJ: Directory of Open Access Journals) (submittedVersion, cc-by-sa)
- Figshare (submittedVersion, cc-by)
- Funders
- National Institutes of Health
- National Institute of General Medical Sciences (R01GM089684, GM089684, R01GM097263)
- National Institute of Neurological Disorders and Stroke (NS049206, R01NS049206)
- Eunice Kennedy Shriver National Institute of Child Health and Human Development (R00HD065870)
- Topics
- Life Sciences › Neuroscience › Cellular and Molecular Neuroscience › Genetic Neurodegenerative Diseases
- Health Sciences › Medicine › Pathology and Forensic Medicine › Genetic factors in colorectal cancer
- Life Sciences › Biochemistry, Genetics and Molecular Biology › Molecular Biology › DNA Repair Mechanisms
- Keywords
- Huntington's disease, CAG repeat instability, somatic repeat expansion, DNA mismatch repair, MLH1, MLH3, MSH2, MSH3, genetic modifiers, strain differences, striatum, DNA repair
- MeSH terms
- MutL Proteins, MutL Protein Homolog 1, Animals, Carrier Proteins, Disease Models, Animal, Humans, Huntington Disease, Nuclear Proteins, RNA, Messenger, Trinucleotide Repeat Expansion, Genomic Instability, Adaptor Proteins, Signal Transducing, Mice, Genome-Wide Association Study, Genetic Association Studies
About these checks
Registry, retraction, Cites and statistics results are computed, not judged, with one exception: a printed reference that no index lists is read once by a model before it counts as a citation error. Claims are extracted by a model and kept only when their quote appears verbatim in the text; each cited source is then checked, with a model’s help, for whether it says what the claim relies on. Those verdicts can be wrong — read the claim’s quote and the cited source before relying on one.
Statistics and arithmetic are recomputed, not judged.
Confidence bands are shown only for fields calibrated on our annotated test set. None is calibrated yet, so no band is shown.
What counts as a claim ›How we measure confidence ›How we check this ›
Are you an author, or do you see a problem with this page? Request a review
