

The DOI matches its Crossref record; 36 of the 36 references it cites were found in a registry or an index.
Shift Towards Pro-inflammatory Intestinal Bacteria Aggravates Acute Murine Colitis via Toll-like Receptors 2 and 4
Open accessAbstract
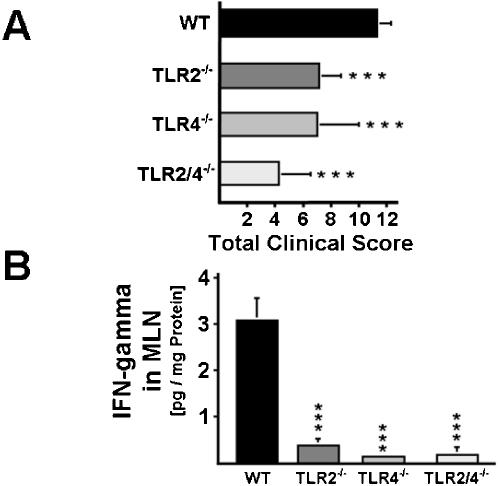
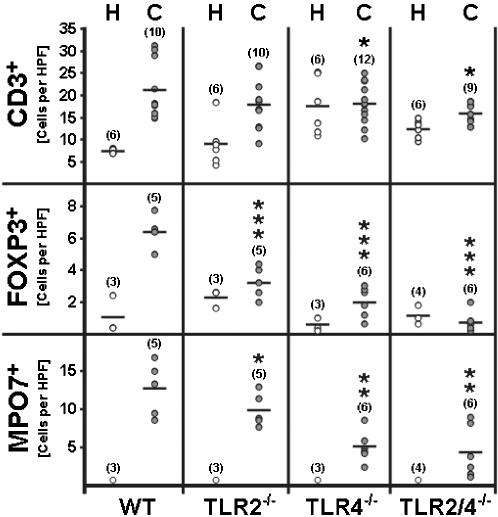
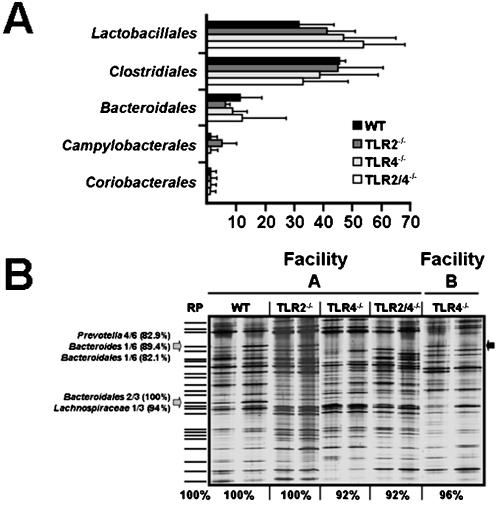
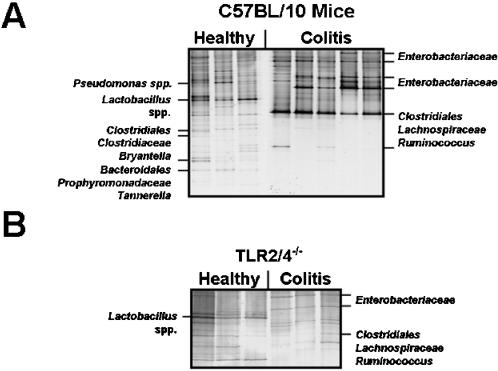
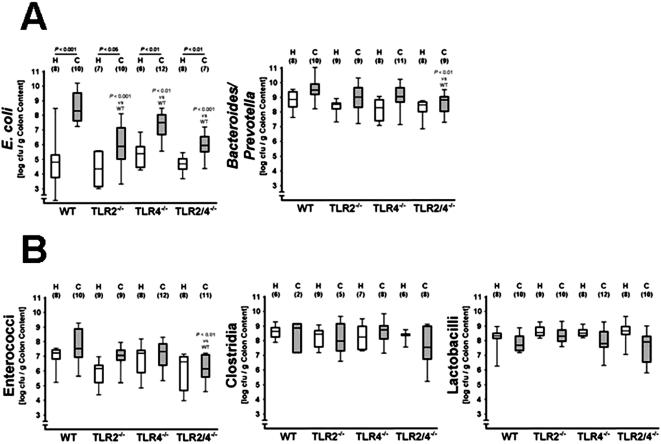
BACKGROUND: Gut bacteria trigger colitis in animal models and are suspected to aggravate inflammatory bowel diseases. We have recently reported that Escherichia coli accumulates in murine ileitis and exacerbates small intestinal inflammation via Toll-like receptor (TLR) signaling. METHODOLOGY AND PRINCIPAL FINDINGS: Because knowledge on shifts in the intestinal microflora during colitis is limited, we performed a global survey of the colon flora of C57BL/10 wild-type (wt), TLR2(-/-), TLR4(-/-), and TLR2/4(-/-) mice treated for seven days with 3.5% dextrane-sulfate-sodium (DSS). As compared to wt animals, TLR2(-/-), TLR4(-/-), and TLR2/4(-/-) mice displayed reduced macroscopic signs of acute colitis and the amelioration of inflammation was associated with reduced IFN-gamma levels in mesenteric lymph nodes, lower amounts of neutrophils, and less FOXP3-positive T-cells in the colon in situ. During acute colitis E. coli increased in wt and TLR-deficient mice (P<0.05), but the final numbers reached were significantly lower in TLR2(-/-), TLR4(-/-) and TLR2/4(-/-) animals, as compared to wt controls (P<0.01). Concentrations of Bacteroides/ Prevotella spp., and enterococci did not increase during colitis, but their numbers were significantly reduced in the colon of DSS-treated TLR2/4(-/-) animals (P<0.01). Numbers of lactobacilli and clostridia remained unaffected by colitis, irrespective of the TLR-genotype of mice. Culture-independent molecular analyses confirmed the microflora shifts towards enterobacteria during colitis and showed that the gut flora composition was similar in both, healthy wt and TLR-deficient animals. CONCLUSIONS AND SIGNIFICANCE: DSS-induced colitis is characterized by a shift in the intestinal microflora towards pro-inflammatory Gram-negative bacteria. Bacterial products exacerbate acute inflammation via TLR2- and TLR4-signaling and direct the recruitment of neutrophils and regulatory T-cells to intestinal sites. E. coli may serve as a biomarker for colitis severity and DSS-induced barrier damage seems to be a valuable model to further identify bacterial factors involved in maintaining intestinal homeostasis and to test therapeutic interventions based upon anti-TLR strategies.
Overview
The claims and statistics of this paper haven’t been checked yet.
Run the check — free, no account needed. It reads the open-access text and checks the sources it cites.
Integrity signals
Registry
Cites
Statistics
Figures
Verification
Claims the paper makes
The claims and statistics of this paper haven’t been checked yet.
Run the check — free, no account needed. It reads the open-access text and checks the sources it cites.
Claims other papers make about this one
Each is checked against this paper’s own text: does it say what the citing paper says it does?
In the citing paper
“Many studies have reported that alterations in the gut microbiota induce both pro- and anti-inflammatory effects in the host.5–7”
From Using Corticosteroids to Reshape the Gut Microbiome: Implications for Inflammatory Bowel Diseases (2015) · cites this paper as [5]
Self-check
Percentages, sums and reported differences re-computed from the paper’s own numbers.
The self-check needs the paper’s full text.
Citations
Cites
Recognition of Commensal Microflora by Toll-Like Receptors Is Required for Intestinal Homeostasis
Rakoff-Nahoum, S., Paglino, J., Eslami-Varzaneh, F., Edberg, S., & Medzhitov, R. (2004) · Cell · doi:10.1016/j.cell.2004.07.002 · Cited by 4,251
Podolsky, D. K. (2002) · New England Journal of Medicine · doi:10.1056/nejmra020831 · Cited by 3,183
Darfeuille-Michaud, A., Boudeau, J., Bulois, P., Neut, C., Glasser, A.-L., Barnich, N., Bringer, M.-A., Swidsinski, A., Beaugerie, L., & Colombel, J.-F. (2004) · Gastroenterology · doi:10.1053/j.gastro.2004.04.061 · Cited by 1,566
Mucosal flora in inflammatory bowel disease
Swidsinski, A. V., Ladhoff, A., Pernthaler, A., Swidsinski, S., Loening-Baucke, V. A., Ortner, M., Weber, J., Hoffmann, U., Schreiber, S., Dietel, M., et al. (2002) · Gastroenterology · doi:10.1053/gast.2002.30294 · Cited by 1,344
The Immunology of Mucosal Models of Inflammation
Strober, W., Fuss, I. J., & Blumberg, R. S. (2002) · Annual Review of Immunology · doi:10.1146/annurev.immunol.20.100301.064816 · Cited by 1,317
Cario, E., & Podolsky, D. K. (2000) · Infection and Immunity · doi:10.1128/iai.68.12.7010-7017.2000 · Cited by 1,245
Swidsinski, A., Weber, J., Loening-Baucke, V., Hale, L. P., & Lochs, H. (2005) · Journal of Clinical Microbiology · doi:10.1128/jcm.43.7.3380-3389.2005 · Cited by 894 · cited 1×
“host-disease after bone marrow transplantation [7], can further potentiate immunopathology by translocation via microlesions and ulcerations [5,8].”
BackgroundBacterial flagellin is a dominant antigen in Crohn disease
Lodes, M. J., Cong, Y., Elson, C. O., Mohamath, R., Landers, C. J., Targan, S. R., Fort, M., & Hershberg, R. M. (2004) · Journal of Clinical Investigation · doi:10.1172/jci200420295 · Cited by 802
Peripheral and Intestinal Regulatory CD4+CD25high T Cells in Inflammatory Bowel Disease
Maul, J., Loddenkemper, C., Mundt, P., Berg, E. G., Giese, T., Stallmach, A., Zeitz, M., & Duchmann, R. (2005) · Gastroenterology · doi:10.1053/j.gastro.2005.03.043 · Cited by 651
Self-citationCharacteristics of Intestinal Dendritic Cells in Inflammatory Bowel Diseases
Hart, A. L., Al-Hassi, H. O., Rigby, R. J., Bell, S., Emmanuel, A. V., Knight, S. C., Kamm, M. A., & Stagg, A. J. (2005) · Gastroenterology · doi:10.1053/j.gastro.2005.05.013 · Cited by 562
Cited by
Sorted by citations
Microbial Influences in Inflammatory Bowel Diseases
Sartor, R. B. (2008) · Gastroenterology · doi:10.1053/j.gastro.2007.11.059 · Cited by 1,927
Host-Derived Nitrate Boosts Growth of E. coli in the Inflamed Gut
Winter, S. E., Winter, M. G., Xavier, M. N., Thiennimitr, P., Poon, V., Keestra, A. M., Laughlin, R. C., Gomez, G., Wu, J., Lawhon, S. D., et al. (2013) · Science · doi:10.1126/science.1232467 · Cited by 1,019
Dextran Sodium Sulphate Colitis Mouse Model: Traps and Tricks
Perše, M., & Cerar, A. (2012) · BioMed Research International · doi:10.1155/2012/718617 · Cited by 886
IL-33 is a crucial amplifier of innate rather than acquired immunity
Oboki, K., Ohno, T., Kajiwara, N., Arae, K., Morita, H., Ishii, A., Nambu, A., Abe, T., Kiyonari, H., Matsumoto, K., et al. (2010) · Proceedings of the National Academy of Sciences · doi:10.1073/pnas.1003059107 · Cited by 670
The role of microbiota in infectious disease
Stecher, B., & Hardt, W. (2008) · Trends in Microbiology · doi:10.1016/j.tim.2007.12.008 · Cited by 547
Metadata
- Authors
- Heimesaat, M. M., Fischer, A., Siegmund, B., Kupz, A., Niebergall, J., Fuchs, D., Jahn, H.-K., Freudenberg, M., Loddenkemper, C., Batra, A., Lehr, H.-A., Liesenfeld, O., Blaut, M., Göbel, U. B., Schumann, R. R., & Bereswill, S.
- Affiliations
- Charité – Universitätsmedizin Berlin (DE)
- Max Planck Society (DE)
- Centre Hospitalier Universitaire Vaudois (CH)
- Corresponding author
- Bereswill, Stefan
- ORCID
- Venue
- PLoS ONE
- Publisher
- Public Library of Science (PLoS)
- Published
- 2007-07-25
- Volume
- 2
- Issue
- 7
- Pages
- e662
- ISSN
- 1932-6203 (ISSN-L)
- PMC
- PMC1914380
- OpenAlex
- W2065205410
- Cited by
- 213
- References
- 36
- Citations by year
- 2026: 3 · 2025: 2 · 2024: 4 · 2023: 10 · 2022: 6 · 2021: 11 · 2020: 7 · 2019: 12 · 2018: 7 · 2017: 11 · 2016: 8 · 2015: 16 · 2014: 16 · 2013: 16 · 2012: 26
- FWCI
- 6.09
- Type
- journal article
- Language
- en
- Open access
- gold
- doi.org
- Locations
- PLoS ONE (publishedVersion, cc-by)
- PubMed Central (publishedVersion, cc-by)
- PubMed (publishedVersion)
- SERVAL (Université de Lausanne) (publishedVersion, other-oa)
- ResearchOnline - JCU (James Cook University) (submittedVersion)
- IRIS (submittedVersion)
- DOAJ (DOAJ: Directory of Open Access Journals) (submittedVersion, cc-by-sa)
- Max Planck Digital Library (submittedVersion)
- MPG.PuRe (Max Planck Society) (submittedVersion)
- Funders
- Sonnenfeld Stiftung
- Deutsche Forschungsgemeinschaft (KFO104, SFB633, Project 6, SPP1110)
- Topics
- Health Sciences › Medicine › Gastroenterology › Inflammatory Bowel Disease
- Life Sciences › Biochemistry, Genetics and Molecular Biology › Molecular Biology › Gut microbiota and health
- Life Sciences › Immunology and Microbiology › Immunology › Immune Response and Inflammation
- Keywords
- acute colitis, gut microbiota, TLR2, TLR4, Escherichia coli, DSS-induced colitis, Gram-negative bacteria, neutrophil recruitment, regulatory T cells, interferon-gamma, Bacteroides-Prevotella, Enterococcus, intestinal barrier injury, inflammatory bowel disease
- MeSH terms
- Acute Disease, Animals, Bacterial Infections, Colitis, Colon, Humans, Inflammation, Mice, Inbred C57BL, Neutrophils, Inflammatory Bowel Diseases, Signal Transduction, Toll-Like Receptor 2, Toll-Like Receptor 4, Mice
About these checks
Registry, retraction, Cites and statistics results are computed, not judged, with one exception: a printed reference that no index lists is read once by a model before it counts as a citation error. Claims are extracted by a model and kept only when their quote appears verbatim in the text; each cited source is then checked, with a model’s help, for whether it says what the claim relies on. Those verdicts can be wrong — read the claim’s quote and the cited source before relying on one.
Statistics and arithmetic are recomputed, not judged.
Confidence bands are shown only for fields calibrated on our annotated test set. None is calibrated yet, so no band is shown.
What counts as a claim ›How we measure confidence ›How we check this ›
Are you an author, or do you see a problem with this page? Request a review
