

The DOI matches its Crossref record; 53 of the 54 references it cites were found in a registry or an index.
Exercise Improves Cognitive Responses to Psychological Stress through Enhancement of Epigenetic Mechanisms and Gene Expression in the Dentate Gyrus
Open accessAbstract
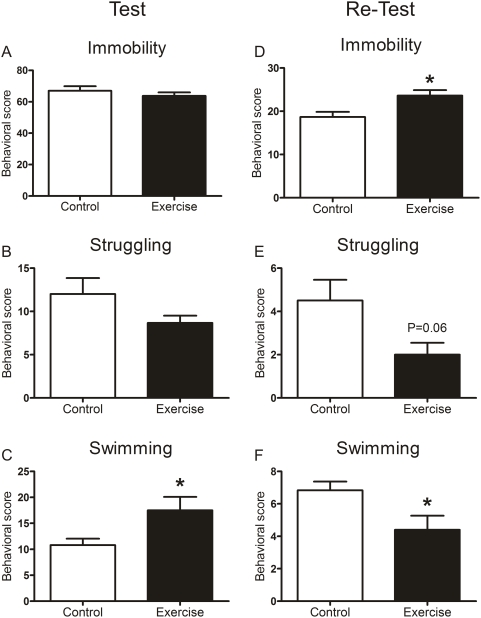
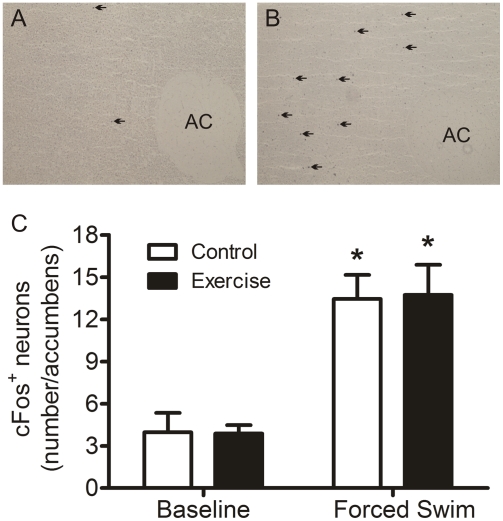
BACKGROUND: We have shown previously that exercise benefits stress resistance and stress coping capabilities. Furthermore, we reported recently that epigenetic changes related to gene transcription are involved in memory formation of stressful events. In view of the enhanced coping capabilities in exercised subjects we investigated epigenetic, gene expression and behavioral changes in 4-weeks voluntarily exercised rats. METHODOLOGY/PRINCIPAL FINDINGS: Exercised and control rats coped differently when exposed to a novel environment. Whereas the control rats explored the new cage for the complete 30-min period, exercised animals only did so during the first 15 min after which they returned to sleeping or resting behavior. Both groups of animals showed similar behavioral responses in the initial forced swim session. When re-tested 24 h later however the exercised rats showed significantly more immobility behavior and less struggling and swimming. If rats were killed at 2 h after novelty or the initial swim test, i.e. at the peak of histone H3 phospho-acetylation and c-Fos induction, then the exercised rats showed a significantly higher number of dentate granule neurons expressing the histone modifications and immediate-early gene induction. CONCLUSIONS/SIGNIFICANCE: Thus, irrespective of the behavioral response in the novel cage or initial forced swim session, the impact of the event at the dentate gyrus level was greater in exercised rats than in control animals. Furthermore, in view of our concept that the neuronal response in the dentate gyrus after forced swimming is involved in memory formation of the stressful event, the observations in exercised rats of enhanced neuronal responses as well as higher immobility responses in the re-test are consistent with the reportedly improved cognitive performance in these animals. Thus, improved stress coping in exercised subjects seems to involve enhanced cognitive capabilities possibly resulting from distinct epigenetic mechanisms in dentate gyrus neurons.
Overview
The claims and statistics of this paper haven’t been checked yet.
Run the check — free, no account needed. It reads the open-access text and checks the sources it cites.
Integrity signals
Registry
Cites
Statistics
Figures
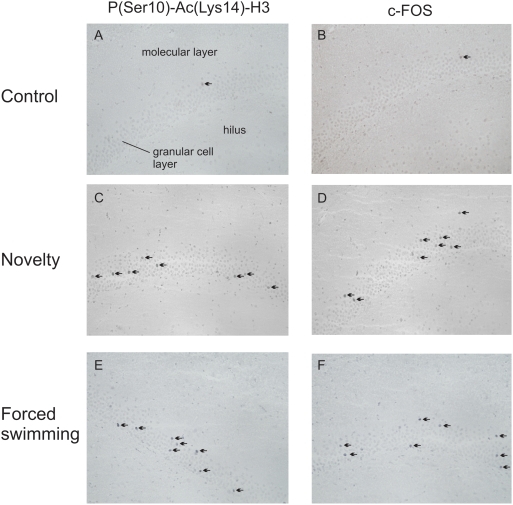
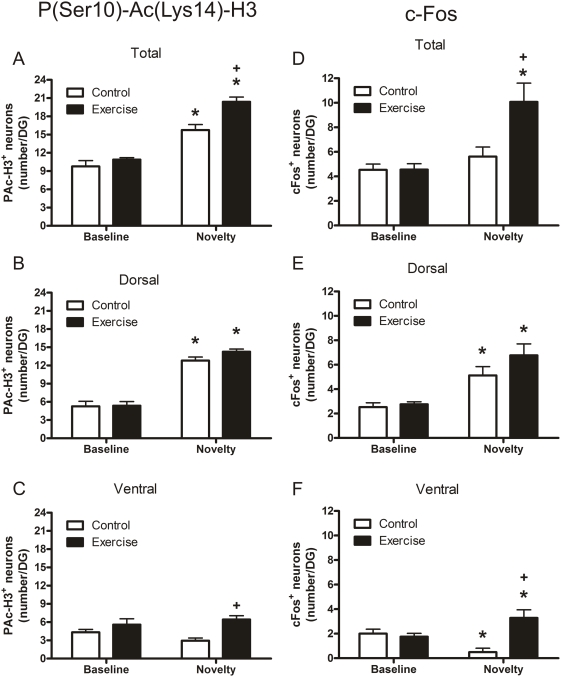
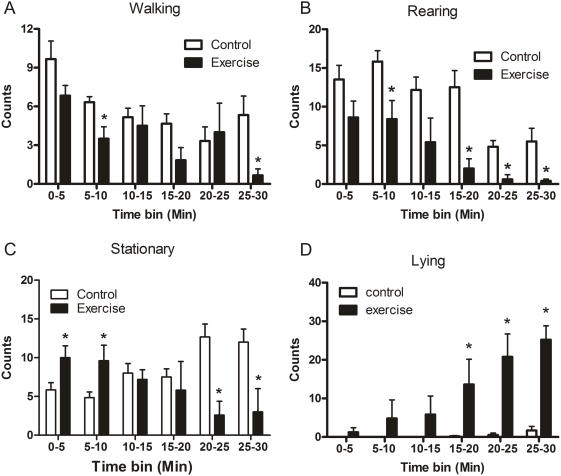
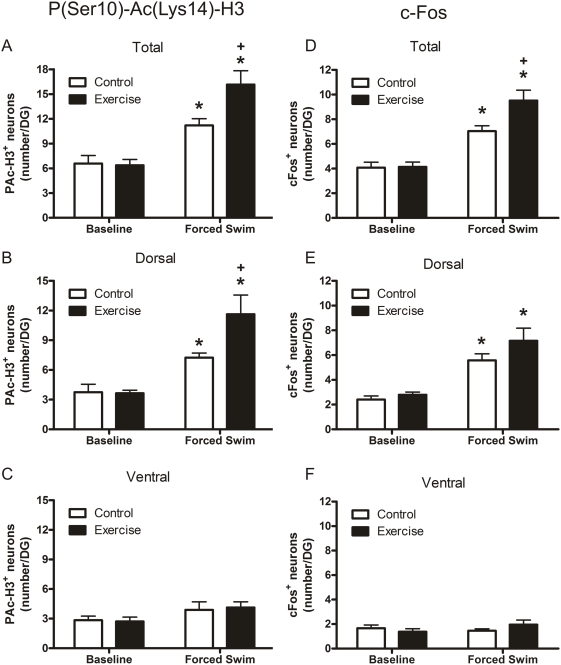
Verification
Claims the paper makes
The claims and statistics of this paper haven’t been checked yet.
Run the check — free, no account needed. It reads the open-access text and checks the sources it cites.
Claims other papers make about this one
Each is checked against this paper’s own text: does it say what the citing paper says it does?
In the citing paper
“Rodents with higher levels of physical activity have been shown to display attenuated effects of psychological stressors on depression-like behaviour and cognition 36, enhanced neuroplasticity 37 and an improved stress response 38.”
From Resilience in mental health: linking psychological and neurobiological perspectives. (2013) · cites this paper as [36]
Self-check
Percentages, sums and reported differences re-computed from the paper’s own numbers.
The self-check needs the paper’s full text.
Citations
Cites
Depression: a new animal model sensitive to antidepressant treatments
PORSOLT, R. D., LE PICHON, M., & JALFRE, M. (1977) · Nature · doi:10.1038/266730a0 · Cited by 4,451
Running enhances neurogenesis, learning, and long-term potentiation in mice
van Praag, H., Christie, B. R., Sejnowski, T. J., & Gage, F. H. (1999) · Proceedings of the National Academy of Sciences · doi:10.1073/pnas.96.23.13427 · Cited by 2,904
Two receptor systems for corticosterone in rat brain: Microdistribution and differential occupation
REUL, J. M. H. M., & KLOET, E. R. D. (1985) · Endocrinology · doi:10.1210/endo-117-6-2505 · Cited by 2,580
Self-citationExercise and the immune system: regulation, integration, and adaptation
Pedersen, B. K., & Hoffman-Goetz, L. (2000) · Physiological Reviews · doi:10.1152/physrev.2000.80.3.1055 · Cited by 1,710
Effects of physical exercise on anxiety, depression, and sensitivity to stress
Salmon, P. (2001) · Clinical Psychology Review · doi:10.1016/s0272-7358(99)00032-x · Cited by 1,363
Farmer, J., Zhao, X., van Praag, H., Wodtke, K., Gage, F. H., & Christie, B. R. (2004) · Neuroscience · doi:10.1016/j.neuroscience.2003.09.029 · Cited by 836
Cheung, P., Tanner, K. G., Cheung, W. L., Sassone‐Corsi, P., Denu, J. M., & Allis, C. D. (2000) · Molecular Cell · doi:10.1016/s1097-2765(00)80256-7 · Cited by 803
Corticosteroids in relation to fear, anxiety and psychopathology
Korte, S. M. (2001) · Neuroscience & Biobehavioral Reviews · doi:10.1016/s0149-7634(01)00002-1 · Cited by 607
Organization of the entorhinal—hippocampal system: A review of current anatomical data
Witter, M. P. (1993) · Hippocampus · doi:10.1002/hipo.1993.4500030707 · Cited by 534
The effect of exercise on depression, anxiety and other mood states: A review
Byrne, A., & Byrne, D. G. (1993) · Journal of Psychosomatic Research · doi:10.1016/0022-3999(93)90050-p · Cited by 497
Antidepressant-Like Effects of κ-Opioid Receptor Antagonists in the Forced Swim Test in Rats
Mague, S. D., Pliakas, A. M., Todtenkopf, M. S., Tomasiewicz, H. C., Zhang, Y., Stevens, W. C., Jones, R. M., Portoghese, P. S., & Carlezon, W. A. (2003) · The Journal of Pharmacology and Experimental Therapeutics · doi:10.1124/jpet.102.046433 · Cited by 485
Phosphoacetylation of histone H3 on c‐fos‐ and c‐jun‐associated nucleosomes upon gene activation
Clayton, A. L., Rose, S., Barratt, M. J., & Mahadevan, L. C. (2000) · The EMBO Journal · doi:10.1093/emboj/19.14.3714 · Cited by 419
A study of subcortical afferents to the hippocampal formation in the rat
Wyss, J. M., Swanson, L. W., & Cowan, W. M. (1979) · Neuroscience · doi:10.1016/0306-4522(79)90124-6 · Cited by 377
Effects of long-term voluntary exercise on the mouse hypothalamic–pituitary–adrenocortical axis
Droste, S. K., Gesing, A., Ulbricht, S., Müller, M. B., Linthorst, A. C. E., & Reul, J. M. H. M. (2003) · Endocrinology · doi:10.1210/en.2003-0097 · Cited by 324
Self-citationBenefits from aerobic exercise in patients with major depression: a pilot study
Dimeo, F., Bauer, M., Varahram, I., Proest, G., & Halter, U. (2001) · British Journal of Sports Medicine · doi:10.1136/bjsm.35.2.114 · Cited by 310
Droste, S. K., de Groote, L., Atkinson, H. C., Lightman, S. L., Reul, J. M. H. M., & Linthorst, A. C. E. (2008) · Endocrinology · doi:10.1210/en.2008-0103 · Cited by 280
Self-citationPhosphorylation of histone H3 correlates with transcriptionally active lociPreprint
Nowak, S. J., & Corces, V. G. (2000) · Genes & Development · doi:10.1101/gad.848800 · Cited by 237
Exercise Training in Coronary Artery Disease and Coronary Vasomotion
Gielen, S., Schuler, G. C., & Hambrecht, R. (2001) · Circulation · doi:10.1161/01.cir.103.1.e1 · Cited by 228
The supramammillary area: its organization, functions and relationship to the hippocampus
Pan, W.-X., & McNaughton, N. (2004) · Progress in Neurobiology · doi:10.1016/j.pneurobio.2004.09.003 · Cited by 223
Gesing, A., Bilang‐Bleuel, A., Droste, S. K., Linthorst, A. C. E., Holsboer, F., & Reul, J. M. H. M. (2001) · Journal of Neuroscience · doi:10.1523/jneurosci.21-13-04822.2001 · Cited by 211
Self-citationSteptoe, A., Edwards, S., Moses, J. L., & Mathews, A. (1989) · Journal of Psychosomatic Research · doi:10.1016/0022-3999(89)90061-5 · Cited by 206
Regular voluntary exercise reduces anxiety-related behaviour and impulsiveness in mice
Binder, E., Droste, S. K., Ohl, F., & Reul, J. M. H. M. (2004) · Behavioural Brain Research · doi:10.1016/j.bbr.2004.04.017 · Cited by 196
Self-citationChandramohan, Y., Droste, S. K., Arthur, J. S. C., & Reul, J. M. H. M. (2008) · European Journal of Neuroscience · doi:10.1111/j.1460-9568.2008.06230.x · Cited by 182
Self-citationLearned immobility explains the behavior of rats in the forced swimming test
Pablo, J. M. D., Parra, A., Segovia, S., & Guillamón, A. (1989) · Physiology & Behavior · doi:10.1016/0031-9384(89)90261-8 · Cited by 169
Glucocorticoids and depression
Steckler, T., Holsboer, F., & Reul, J. M. H. M. (1999) · Best Practice & Research Clinical Endocrinology & Metabolism · doi:10.1053/beem.1999.0046 · Cited by 160
Self-citationDroste, S. K., Chandramohan, Y., Hill, L. E., Linthorst, A. C. E., & Reul, J. M. H. M. (2007) · Neuroendocrinology · doi:10.1159/000104770 · Cited by 157
Self-citationThe Anatomical Organization of Septo‐Hippocampal Projections
Swanson, L. W. (1978) · Novartis Foundation symposium · doi:10.1002/9780470720394.ch4 · Cited by 152
Linthorst, A. C. E., Peñalva, R. G., Flachskamm, C., Holsboer, F., & Reul, J. M. H. M. (2002) · European Journal of Neuroscience · doi:10.1046/j.1460-9568.2002.02400.x · Cited by 142
Self-citationBilang‐Bleuel, A., Rech, J., Carli, S. D., Holsboer, F., & Reul, J. M. H. M. (2002) · European Journal of Neuroscience · doi:10.1046/j.1460-9568.2002.01934.x · Cited by 129
Self-citationBilang‐Bleuel, A., Ulbricht, S., Chandramohan, Y., Carli, S. D., Droste, S. K., & Reul, J. M. H. M. (2005) · European Journal of Neuroscience · doi:10.1111/j.1460-9568.2005.04358.x · Cited by 128
Self-citationChandramohan, Y., Droste, S. K., & Reul, J. M. H. M. (2007) · Journal of Neurochemistry · doi:10.1111/j.1471-4159.2006.04396.x · Cited by 117
Self-citationVasuta, C., Caunt, C., James, R., Samadi, S., Schibuk, E., Kannangara, T., Titterness, A. K., & Christie, B. R. (2007) · Hippocampus · doi:10.1002/hipo.20349 · Cited by 105
Korte, S. M., de Kloet, E. R., Buwalda, B., Bouman, S. D., & Bohus, B. (1996) · European Journal of Pharmacology · doi:10.1016/0014-2999(96)00064-7 · Cited by 97
Epigenetic mechanisms in stress-related memory formation
Reul, J. M. H. M., & Chandramohan, Y. (2007) · Psychoneuroendocrinology · doi:10.1016/j.psyneuen.2007.03.016 · Cited by 94
Self-citationLinthorst, A. C. E., Flachskamm, C., Holsboer, F., & Reul, J. M. H. M. (1995) · European Journal of Neuroscience · doi:10.1111/j.1460-9568.1995.tb01040.x · Cited by 93
Self-citationBrain Neurotransmission during Peripheral Inflammationa
Linthorst, A. C. E., & Reul, J. M. H. M. (1998) · Annals of the New York Academy of Sciences · doi:10.1111/j.1749-6632.1998.tb09558.x · Cited by 88
Self-citationInfluence of voluntary exercise on hypothalamic norepinephrine
Lambert, G. W., & Jónsdóttir, I. H. (1998) · Journal of Applied Physiology · doi:10.1152/jappl.1998.85.3.962 · Cited by 87
Exercise affects glutamate receptors in postsynaptic densities from cortical mice brain
Dietrich, M. O., Mantese, C. E. A., Porciúncula, L. O., Ghisleni, G., Vinadé, L., Souza, D. O., & Portela, L. V. (2005) · Brain Research · doi:10.1016/j.brainres.2005.09.038 · Cited by 84
Stereotypic behaviour affects environmental preference in bank voles, Clethrionomys glareolus
Cooper, J. J., & Nicol, C. J. (1991) · Animal Behaviour · doi:10.1016/s0003-3472(05)80635-9 · Cited by 79
Effect of access to a running wheel on behavior of C57BL/6J mice.
Harri, M. N. E., Lindblom, J., Malinen, H., Hyttinen, M., Lapveteläinen, T., Eskola, S., & Helminen, H. J. (1999) · PubMed · Cited by 74
Dijkstra, I., Tilders, F. J. H., Aguilera, G., Kiss, A., Rabadan‐Diehl, C., Barden, N., Karanth, S., Holsboer, F., & Reul, J. M. H. M. (1998) · Journal of Neuroscience · doi:10.1523/jneurosci.18-10-03909.1998 · Cited by 69
Self-citationDroste, S. K., Schweizer, M., Ulbricht, S., & Reul, J. M. H. M. (2006) · Journal of Neuroendocrinology · doi:10.1111/j.1365-2826.2006.01489.x · Cited by 68
Self-citationHypothalamus, hypertension, and exercise
Kramer, J. M., Plowey, E. D., Beatty, J. A., Little, H. R., & Waldrop, T. G. (2000) · Brain Research Bulletin · doi:10.1016/s0361-9230(00)00311-7 · Cited by 67
Neuropeptides and their interaction with exercise and immune function
Jonsdottir, I. (2000) · Immunology and Cell Biology · doi:10.1111/j.1440-1711.2000.t01-10-.x · Cited by 58
Hill, L., Droste, S., Nutt, D., Linthorst, A., & Reul, J. (2008) · Journal of Psychopharmacology · doi:10.1177/0269881108096983 · Cited by 57
Self-citationInfluence of regular voluntary exercise on spontaneous and social stress‐affected sleep in mice
Lancel, M., Droste, S. K., Sommer, S., & Reul, J. M. H. M. (2003) · European Journal of Neuroscience · doi:10.1046/j.1460-9568.2003.02658.x · Cited by 52
Self-citationGlutamate and cortisol—a critical confluence in PTSD?
Reul, J., & Nutt, D. (2008) · Journal of Psychopharmacology · doi:10.1177/0269881108094617 · Cited by 45
Self-citationAranda, L., Santín, L. J., Begega, A., Aguirre, J. A., & Arias, J. L. (2005) · Behavioural Brain Research · doi:10.1016/j.bbr.2005.09.002 · Cited by 45
Exercise Training Down-RegulatesobGene Expression in the Genetically Obese SHHF/Mcc-facpRat
Friedman, J. E., Ferrara, C. M., Aulak, K. S., Hatzoglou, M., McCune, S. A., Park, S., & Sherman, W. M. (1997) · Hormone and Metabolic Research · doi:10.1055/s-2007-979024 · Cited by 38
Handbook of Stress and the Brain - Part 1: The Neurobiology of Stress
(2005) · Techniques in the behavioral and neural sciences · doi:10.1016/s0921-0709(05)x8001-4 · Cited by 35
Stereotypic Behaviour in Wild Caught and Laboratory Bred Bank Voles (Clethrionymus Glareolus)
Cooper, J. J., & Nicol, C. J. (1996) · Animal Welfare · doi:10.1017/s0962728600018832 · Cited by 33
Reul, J. M. H. M., & Droste, S. K. (2005) · Techniques in the behavioral and neural sciences · doi:10.1016/s0921-0709(05)80009-4 · Cited by 8
Self-citationReul, J. M. H. M., Chandramohan, Y., & Droste, S. K. (2006) · Frontiers in Neuroendocrinology · doi:10.1016/j.yfrne.2006.03.095 · Cited by 1
Self-citation
Cited by
Sorted by citations
Epigenetics as a unifying principle in the aetiology of complex traits and diseases
Petronis, A. (2010) · Nature · doi:10.1038/nature09230 · Cited by 703
Radak, Z. O., Zhao, Z., Koltai, E., Ohno, H., & Atalay, M. (2012) · Antioxidants and Redox Signaling · doi:10.1089/ars.2011.4498 · Cited by 643
The Influence of Exercise on Cognitive Abilities
Gómez‐Pinilla, F., & Hillman, C. H. (2012) · Comprehensive physiology · doi:10.1002/cphy.c110063 · Cited by 756
Stress and anxiety: Structural plasticity and epigenetic regulation as a consequence of stress
McEwen, B. S., Eiland, L., Hunter, R. G., & Miller, M. M. (2012) · Neuropharmacology · doi:10.1016/j.neuropharm.2011.07.014 · Cited by 596
Resilience in mental health: linking psychological and neurobiological perspectives.
Rutten, B. P. F., Hammels, C., Geschwind, N., Menne‐Lothmann, C., Pishva, E., Schruers, K., van den Hove, D., Kenis, G., van Os, J., & Wichers, M. (2013) · Acta Psychiatrica Scandinavica · doi:10.1111/acps.12095 · Cited by 418
Metadata
- Authors
- Collins, A., Hill, L. E., Chandramohan, Y., Whitcomb, D., Droste, S. K., & Reul, J. M. H. M.
- Affiliations
- University of Bristol (GB)
- Corresponding author
- Reul, Johannes M. H. M.
- Venue
- PLoS ONE
- Publisher
- Public Library of Science (PLoS)
- Published
- 2009-01-30
- Volume
- 4
- Issue
- 1
- Pages
- e4330
- ISSN
- 1932-6203 (ISSN-L)
- PMC
- PMC2628725
- OpenAlex
- W2065907989
- Cited by
- 145
- References
- 54
- Citations by year
- 2026: 1 · 2025: 4 · 2024: 5 · 2023: 4 · 2022: 4 · 2021: 5 · 2020: 8 · 2019: 6 · 2018: 6 · 2017: 10 · 2016: 10 · 2015: 12 · 2014: 13 · 2013: 12 · 2012: 15
- FWCI
- 5.71
- Type
- journal article
- Language
- en
- Open access
- gold
- doi.org
- Locations
- PLoS ONE (publishedVersion, cc-by)
- PubMed Central (publishedVersion, cc-by)
- PubMed (publishedVersion)
- Explore Bristol Research (publishedVersion)
- DOAJ (DOAJ: Directory of Open Access Journals) (submittedVersion, cc-by-sa)
- UCL Discovery (University College London) (submittedVersion)
- Bristol Research (University of Bristol) (submittedVersion)
- Funders
- Medical Research Council
- Topics
- Life Sciences › Neuroscience › Behavioral Neuroscience › Stress Responses and Cortisol
- Life Sciences › Neuroscience › Cognitive Neuroscience › Memory and Neural Mechanisms
- Life Sciences › Neuroscience › Developmental Neuroscience › Neurogenesis and neuroplasticity mechanisms
- Keywords
- physical activity, psychological stress, stress coping, epigenetic mechanisms, dentate gyrus, histone H3 phosphorylation, histone acetylation, c-fos, immediate early genes, forced swim test, novelty exploration, stress memory, gene expression, hippocampus
- MeSH terms
- Acetylation, Animals, Behavior, Animal, Gene Expression Regulation, Histones, Male, Memory, Neurons, Physical Conditioning, Animal, Stress, Psychological, Gene Expression, Proto-Oncogene Proteins c-fos, Genes, fos, Rats, Sprague-Dawley, Dentate Gyrus, Epigenesis, Genetic, Rats
About these checks
Registry, retraction, Cites and statistics results are computed, not judged, with one exception: a printed reference that no index lists is read once by a model before it counts as a citation error. Claims are extracted by a model and kept only when their quote appears verbatim in the text; each cited source is then checked, with a model’s help, for whether it says what the claim relies on. Those verdicts can be wrong — read the claim’s quote and the cited source before relying on one.
Statistics and arithmetic are recomputed, not judged.
Confidence bands are shown only for fields calibrated on our annotated test set. None is calibrated yet, so no band is shown.
What counts as a claim ›How we measure confidence ›How we check this ›
Are you an author, or do you see a problem with this page? Request a review
