Cited by 122Developmental Biology and Gene RegulationGrowth Hormone and Insulin-like Growth FactorsZebrafish Biomedical Research Applications

The DOI matches its Crossref record; 65 of the 65 references it cites were found in a registry or an index.

Zebrafish IGF Genes: Gene Duplication, Conservation and Divergence, and Novel Roles in Midline and Notochord Development

Open access
Zou, Shuming, Kamei, Hiroyasu, Modi, Zubin, Duan, Cunming·2009·PLoS ONE

Abstract

Insulin-like growth factors (IGFs) are key regulators of development, growth, and longevity. In most vertebrate species including humans, there is one IGF-1 gene and one IGF-2 gene. Here we report the identification and functional characterization of 4 distinct IGF genes (termed as igf-1a, -1b, -2a, and -2b) in zebrafish. These genes encode 4 structurally distinct and functional IGF peptides. IGF-1a and IGF-2a mRNAs were detected in multiple tissues in adult fish. IGF-1b mRNA was detected only in the gonad and IGF-2b mRNA only in the liver. Functional analysis showed that all 4 IGFs caused similar developmental defects but with different potencies. Many of these embryos had fully or partially duplicated notochords, suggesting that an excess of IGF signaling causes defects in the midline formation and an expansion of the notochord. IGF-2a, the most potent IGF, was analyzed in depth. IGF-2a expression caused defects in the midline formation and expansion of the notochord but it did not alter the anterior neural patterning. These results not only provide new insights into the functional conservation and divergence of the multiple igf genes but also reveal a novel role of IGF signaling in midline formation and notochord development in a vertebrate model.

Overview

The claims and statistics of this paper haven’t been checked yet.

Run the check — free, no account needed. It reads the open-access text and checks the sources it cites.

A few free checks a day · papers already verified open instantly · results are public

Integrity signals

Registry

Crossref · 10.1371/journal.pone.0007026

Cites

65 of 65 references verified0 citation errors · 0 not checkable

Statistics

Figures

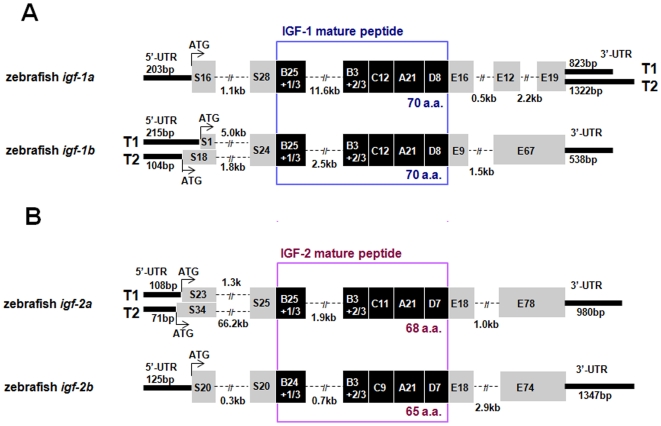
Figure 1 Molecular characterization of four zebrafish igf genes and their multiple transcripts. (A) Structure of the zebrafish igf-1a and -1b genes. Signal peptide and E domain regions are shown in grey boxes and the B–C–A–D domains of the mature peptide are shown in dark boxes with the number of amino acids indicated. 3′ and 5′-UTRs are shown in bold lines with the number of base pairs shown (bp). Introns sequences are shown in dashed lines and are indicated in kb. Two alternative splicing transcripts (T1 and T2) are found in the 3′-UTR of igf-1a. Two alternative splicing transcripts are also found in the 5′-UTR and signal peptide region of igf-1b. (B) Structure of the zebrafish igf-2a and igf-2b. Two alternative splicing transcripts are found in the 5′-UTR and signal peptide region of igf-2a.
Figure 1 Molecular characterization of four zebrafish igf genes and their multiple transcripts. (A) Structure of the zebrafish igf-1a and -1b genes. Signal peptide and E domain regions are shown in grey boxes and the B–C–A–D domains of the mature peptide are shown in dark boxes with the number of amino acids indicated. 3′ and 5′-UTRs are shown in bold lines with the number of base pairs shown (bp). Introns sequences are shown in dashed lines and are indicated in kb. Two alternative splicing transcripts (T1 and T2) are found in the 3′-UTR of igf-1a. Two alternative splicing transcripts are also found in the 5′-UTR and signal peptide region of igf-1b. (B) Structure of the zebrafish igf-2a and igf-2b. Two alternative splicing transcripts are found in the 5′-UTR and signal peptide region of igf-2a.CC BY · PubMed Central
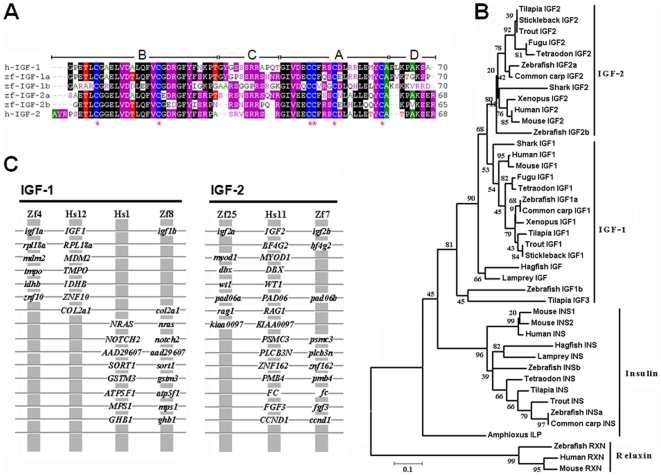
Figure 2 Structural and phylogenic analysis of four zebrafish IGFs. (A) Sequence alignment of mature zebrafish (zf) IGF-1a, IGF-1b, IGF-2a, IGF-2b and mature human (h) IGF-1 and IGF-2. The B–C–A–D domains are labeled. Star indicates conserved cysteine. (B) Phylogenetic analysis of the vertebrate insulin/IGF family members. Amino acid sequences in the B and A domains were analyzed by the neighbor-joining method using the MEGA3 program [64]. Gaps were removed from the alignment. Bootstrap values derived from 1,000 runs are shown. Relaxins are used as an outgroup. Accession numbers for the sequences used are: human (IGF-1, NM_000618; IGF-2, NM_000612; insulin, NM_000207; relaxin, NM_080864), mouse (IGF-1, NM_010512; IGF-2, NM_010514, insulin 1, NM_008386; insulin 2, NM_008387; relaxin, NM_173184), Xenopus (IGF-1, M29857; IGF-2, BC070545), zebrafish (insulin a, NM_131056; insulin b, NM_001039064), common carp (IGF-1, EF536889; IGF-2, AF402958; insulin, X00989), trout (IGF-1, EF432852; IGF-2, EF432854; insulin, M21170), tilapia (IGF-1, AF033796; IGF-2, AF033801; IGF-3, EU272147; insulin, AF038123 ), shark (IGF-1, Z50081; IGF-2, Z50082), hagfish (IGF, M57735; insulin, V00649 ), sea lamprey (IGF, AB081462), Amphioxus insulin-like peptide mRNA (ILP, M55302). Sequence for Tetraodon, fugu and stickleback IGF-1, IGF2 and insulin were obtained by searching the Tetraodon genome (http://www.genoscope.cns.fr/externe/English/Projets/Projet_C/C.html), fugu genome (http://fugu.hgmp.mrc.ac.uk/), and stickleback genome (http://www.ensembl.org/ Gasterosteus_aculeatus/). Sequence of sea lamprey insulin was obtained by searching sea lamprey genome (http://pre.ensembl.org/Petromyzon_marinus/). (C) Conserved synteny between human (Hs) and zebrafish (Zf) IGF loci. Vertical gray lines indicate a group of genes on the same chromosome, with order ignored to facilitate the comparison of orthologs and paralogs. Horizontal gray lines connect presumed orthologs within chromosome groups as well as paralogs between chromosome groups.
Figure 2 Structural and phylogenic analysis of four zebrafish IGFs. (A) Sequence alignment of mature zebrafish (zf) IGF-1a, IGF-1b, IGF-2a, IGF-2b and mature human (h) IGF-1 and IGF-2. The B–C–A–D domains are labeled. Star indicates conserved cysteine. (B) Phylogenetic analysis of the vertebrate insulin/IGF family members. Amino acid sequences in the B and A domains were analyzed by the neighbor-joining method using the MEGA3 program [64]. Gaps were removed from the alignment. Bootstrap values derived from 1,000 runs are shown. Relaxins are used as an outgroup. Accession numbers for the sequences used are: human (IGF-1, NM_000618; IGF-2, NM_000612; insulin, NM_000207; relaxin, NM_080864), mouse (IGF-1, NM_010512; IGF-2, NM_010514, insulin 1, NM_008386; insulin 2, NM_008387; relaxin, NM_173184), Xenopus (IGF-1, M29857; IGF-2, BC070545), zebrafish (insulin a, NM_131056; insulin b, NM_001039064), common carp (IGF-1, EF536889; IGF-2, AF402958; insulin, X00989), trout (IGF-1, EF432852; IGF-2, EF432854; insulin, M21170), tilapia (IGF-1, AF033796; IGF-2, AF033801; IGF-3, EU272147; insulin, AF038123 ), shark (IGF-1, Z50081; IGF-2, Z50082), hagfish (IGF, M57735; insulin, V00649 ), sea lamprey (IGF, AB081462), Amphioxus insulin-like peptide mRNA (ILP, M55302). Sequence for Tetraodon, fugu and stickleback IGF-1, IGF2 and insulin were obtained by searching the Tetraodon genome (http://www.genoscope.cns.fr/externe/English/Projets/Projet_C/C.html), fugu genome (http://fugu.hgmp.mrc.ac.uk/), and stickleback genome (http://www.ensembl.org/ Gasterosteus_aculeatus/). Sequence of sea lamprey insulin was obtained by searching sea lamprey genome (http://pre.ensembl.org/Petromyzon_marinus/). (C) Conserved synteny between human (Hs) and zebrafish (Zf) IGF loci. Vertical gray lines indicate a group of genes on the same chromosome, with order ignored to facilitate the comparison of orthologs and paralogs. Horizontal gray lines connect presumed orthologs within chromosome groups as well as paralogs between chromosome groups.CC BY · PubMed Central
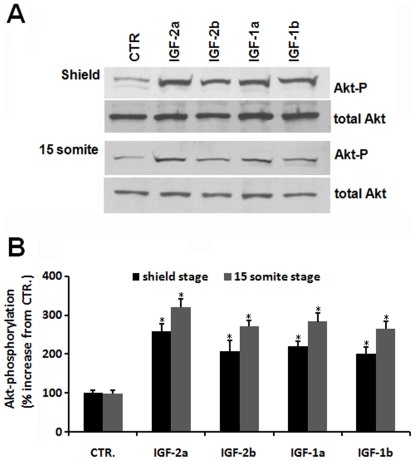
Figure 3 All four zebrafish igf genes are functional. (A) Microinjection of each of the 4 zebrafish IGF mRNA into zebrafish embryo resulted in elevated Akt phospholylation. GFP, IGF-1a, -1b, -2a, and -2b mRNA was injected into zebrafish embryos at 1-2 cell stage. The injected embryos were raised to shield and 15 somite stages. Lysates were prepared and subjected to SDS-PAGE followed by immunoblot analysis using antibodies against total and phosphorylated Akt (Akt-P). (B) Densitometric analysis result of (A). The phosphorylated Akt/total Akt ratio was calculated and expressed as % of the control (GFP mRNA injected) group. Grey bars represent the shield stage groups, and dark bars represent the 15 somite stage groups. Values are means±SE (n = 3). *p<0.01 compared with the control group.
Figure 3 All four zebrafish igf genes are functional. (A) Microinjection of each of the 4 zebrafish IGF mRNA into zebrafish embryo resulted in elevated Akt phospholylation. GFP, IGF-1a, -1b, -2a, and -2b mRNA was injected into zebrafish embryos at 1-2 cell stage. The injected embryos were raised to shield and 15 somite stages. Lysates were prepared and subjected to SDS-PAGE followed by immunoblot analysis using antibodies against total and phosphorylated Akt (Akt-P). (B) Densitometric analysis result of (A). The phosphorylated Akt/total Akt ratio was calculated and expressed as % of the control (GFP mRNA injected) group. Grey bars represent the shield stage groups, and dark bars represent the 15 somite stage groups. Values are means±SE (n = 3). *p<0.01 compared with the control group.CC BY · PubMed Central
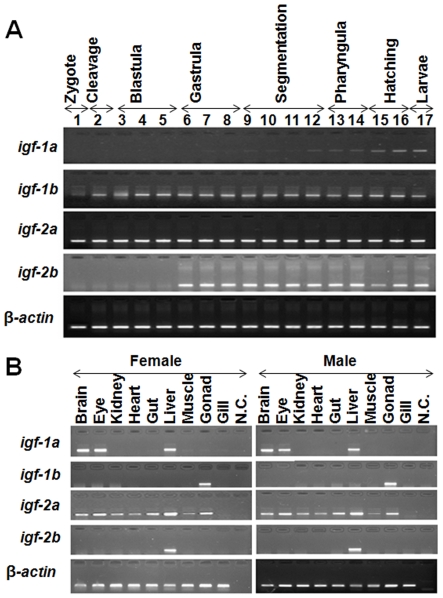
Figure 4 Temporal and spatial expression patterns of the duplicated zebrafish IGF genes. (A) RT-PCR analysis of IGF mRNAs in zebrafish embryos at the indicated stages. Numbers are the different embryo developmental stages (1, 1–2 cell; 2, 32-cell; 3, 512-cell; 4, oblong; 5, 30%-epiboly; 6, 50%-epiboly; 7, 90%-epiboly; 8, tailbud; 9, 2-somite; 10, 12-somite; 11, 18-somite; 12, 24–26 somite; 13, Prim-6; 14, Prim-22; 15, 48hpf; 16, 72hpf; 17, 96hpf). (B) RT-PCR analysis of IGF mRNAs in female and male adult zebrafish tissues.
Figure 4 Temporal and spatial expression patterns of the duplicated zebrafish IGF genes. (A) RT-PCR analysis of IGF mRNAs in zebrafish embryos at the indicated stages. Numbers are the different embryo developmental stages (1, 1–2 cell; 2, 32-cell; 3, 512-cell; 4, oblong; 5, 30%-epiboly; 6, 50%-epiboly; 7, 90%-epiboly; 8, tailbud; 9, 2-somite; 10, 12-somite; 11, 18-somite; 12, 24–26 somite; 13, Prim-6; 14, Prim-22; 15, 48hpf; 16, 72hpf; 17, 96hpf). (B) RT-PCR analysis of IGF mRNAs in female and male adult zebrafish tissues.CC BY · PubMed Central
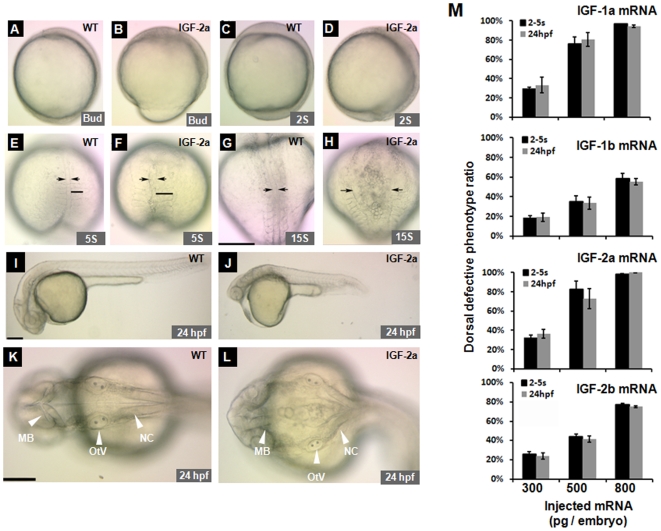
Figure 5 Effect of forced IGF expression in zebrafish embryos. (A, B) Lateral view of a GFP mRNA injected control embryo (A) and an IGF-2a mRNA injected embryo (B) at the bud stage. Note the delayed mesoderm involution associated with an open blastopore (>75%, n = 328) in the IGF-2a mRNA injected embryos (B). (C, D) Lateral views of a control embryo (C) or an IGF-2a mRNA injected embryo (D) at 2-somite stage. Note the shortened A-P axis and more posterior tissues in (D). (E–H) Dorsal view of a control (E, G) or an IGF-2a mRNA injected embryo (F, H) at the 5-somite (E and F) and 15-somite stages (G and H). All embryos are dorsal views with head up. Arrows indicate the width of the notochord. Black bars in panels E and F show the width of the somite. Scale bar = 200 µm. (I–L) Morphology of a GFP mRNA injected control embryo (I and K) and an IGF-2a mRNA injected embryo (J and L) at 24 hpf. I and J are lateral views with head to the left and K and L are dorsal views with head to the left. MB, mid brain; OtV, otic vesicle; NC, notochord. Scale bar = 200 µm. (M) Dose-dependent effects of various IGFs in zebrafish embryos. The results are means of 3–4 independent experiments.
Figure 5 Effect of forced IGF expression in zebrafish embryos. (A, B) Lateral view of a GFP mRNA injected control embryo (A) and an IGF-2a mRNA injected embryo (B) at the bud stage. Note the delayed mesoderm involution associated with an open blastopore (>75%, n = 328) in the IGF-2a mRNA injected embryos (B). (C, D) Lateral views of a control embryo (C) or an IGF-2a mRNA injected embryo (D) at 2-somite stage. Note the shortened A-P axis and more posterior tissues in (D). (E–H) Dorsal view of a control (E, G) or an IGF-2a mRNA injected embryo (F, H) at the 5-somite (E and F) and 15-somite stages (G and H). All embryos are dorsal views with head up. Arrows indicate the width of the notochord. Black bars in panels E and F show the width of the somite. Scale bar = 200 µm. (I–L) Morphology of a GFP mRNA injected control embryo (I and K) and an IGF-2a mRNA injected embryo (J and L) at 24 hpf. I and J are lateral views with head to the left and K and L are dorsal views with head to the left. MB, mid brain; OtV, otic vesicle; NC, notochord. Scale bar = 200 µm. (M) Dose-dependent effects of various IGFs in zebrafish embryos. The results are means of 3–4 independent experiments.CC BY · PubMed Central
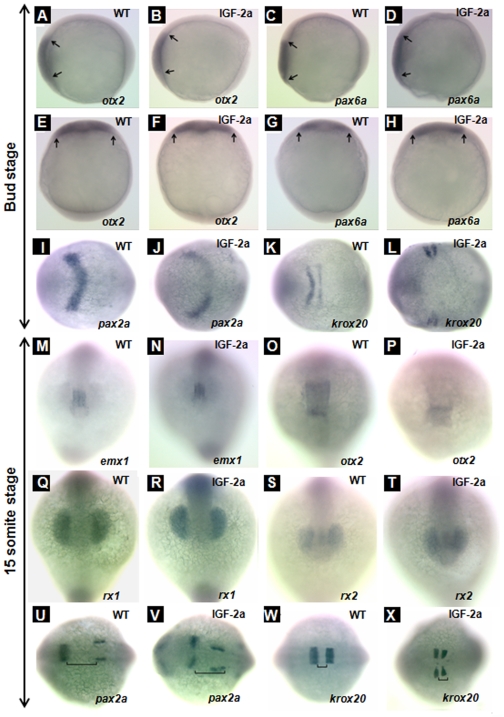
Figure 6 Effect of IGF-2a expression. otx2 expression in the anterior neural plate at the bud stage in a control embryo (panels A and E) and an IGF-2a mRNA injected embryo (panels B and F). pax6a expression in the anterior neural plate at the bud stage in a control embryo (panels C and G) and an IGF-2a mRNA injected embryo (panels D and H). pax2a expression in the midbrain hindbrain boundary at the bud stage in a control embryo (panel I) and an IGF-2a mRNA injected embryo (panel J). krox20 expression in the rhombomere 3 and 5 at the bud stage in a control embryo (panel K) and an IGF-2a mRNA injected embryo (panel L). emx1 expression in the forebrain at the 15-somite stage in a control embryo (panel M) and an IGF-2a mRNA injected embryo (panel N). otx2 expression in the midbrain at the 15-somite stage in a control embryo (panel O) and an IGF-2a mRNA injected embryo (panel P). rx1 expression in the optic vesicle at the 15-somite stage in a control embryo (panel Q) and an IGF-2a mRNA injected embryo (panel R). rx2 expression in the optic vesicle at the 15-somite stage in a control embryo (panel S) and an IGF-2a mRNA injected embryo (panel T). pax2a expression in the midbrain hindbrain boundary at the 15-somite stage in a control embryo (panel U) and an IGF-2a mRNA injected embryo (panel V). krox20 expression in the rhombomere 3 and 5 at the 15-somite stage in a control embryo (panel W) and a 500 pg IGF-2a mRNA injected embryo (panel X). Panels A–D, lateral view, head left; panels E–H, dorsal view, head up; panels I–L and U–X, dorsal view, head left; panels M–T, front view. Black line in panels U, V indicates the gap between the midbrain hindbrain boundary and otic vesicle; black line in panels W, X indicates the gap between rhombomere 3 and 5.
Figure 6 Effect of IGF-2a expression. otx2 expression in the anterior neural plate at the bud stage in a control embryo (panels A and E) and an IGF-2a mRNA injected embryo (panels B and F). pax6a expression in the anterior neural plate at the bud stage in a control embryo (panels C and G) and an IGF-2a mRNA injected embryo (panels D and H). pax2a expression in the midbrain hindbrain boundary at the bud stage in a control embryo (panel I) and an IGF-2a mRNA injected embryo (panel J). krox20 expression in the rhombomere 3 and 5 at the bud stage in a control embryo (panel K) and an IGF-2a mRNA injected embryo (panel L). emx1 expression in the forebrain at the 15-somite stage in a control embryo (panel M) and an IGF-2a mRNA injected embryo (panel N). otx2 expression in the midbrain at the 15-somite stage in a control embryo (panel O) and an IGF-2a mRNA injected embryo (panel P). rx1 expression in the optic vesicle at the 15-somite stage in a control embryo (panel Q) and an IGF-2a mRNA injected embryo (panel R). rx2 expression in the optic vesicle at the 15-somite stage in a control embryo (panel S) and an IGF-2a mRNA injected embryo (panel T). pax2a expression in the midbrain hindbrain boundary at the 15-somite stage in a control embryo (panel U) and an IGF-2a mRNA injected embryo (panel V). krox20 expression in the rhombomere 3 and 5 at the 15-somite stage in a control embryo (panel W) and a 500 pg IGF-2a mRNA injected embryo (panel X). Panels A–D, lateral view, head left; panels E–H, dorsal view, head up; panels I–L and U–X, dorsal view, head left; panels M–T, front view. Black line in panels U, V indicates the gap between the midbrain hindbrain boundary and otic vesicle; black line in panels W, X indicates the gap between rhombomere 3 and 5.CC BY · PubMed Central
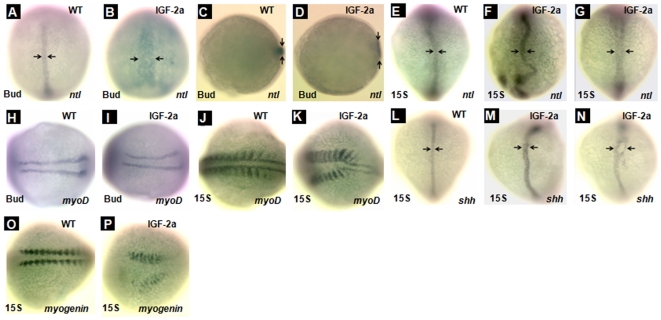
Figure 7 Overexpression of IGF-2a results in abnormal notochord development. ntl expression in the notochord at the bud stage in a control embryo (panels A and C) and an IGF-2a mRNA injected embryo (panels B and D). ntl expression in the notochord at the 15-somite stage in a control embryo (panel E) and IGF-2a mRNA injected embryos (panels F and G). Among the IGF-2a mRNA injected embryos, 65% showed the expression pattern shown in panel F and 35% showed that in panel G (n = 17). myoD expression in the somite at the bud stage in a control embryo (panel H) and an IGF-2a mRNA injected embryo (panel I). myoD expression in the somite at the 15-somite stage in a control embryo (panel J) and an IGF-2a mRNA injected embryo (panel K). shh expression in the notochord at the 15-somite stage in a control embryo (panel L) and IGF-2a mRNA injected embryos (panels M and N). Among the IGF-2a mRNA injected embryos, 71% showed expression pattern shown in panel M and 24% showed that in panel N (n = 21). myogenin expression in the somite at the 15-somite stage in a control embryo (panel O) and an IGF-2a mRNA injected embryo (panel P). Panels A, B, E–G, and L–N are dorsal view with head up; panels C and D are vegetal view with dorsal the the right; panels H–K, O, and P are dorsal views with head to the left.
Figure 7 Overexpression of IGF-2a results in abnormal notochord development. ntl expression in the notochord at the bud stage in a control embryo (panels A and C) and an IGF-2a mRNA injected embryo (panels B and D). ntl expression in the notochord at the 15-somite stage in a control embryo (panel E) and IGF-2a mRNA injected embryos (panels F and G). Among the IGF-2a mRNA injected embryos, 65% showed the expression pattern shown in panel F and 35% showed that in panel G (n = 17). myoD expression in the somite at the bud stage in a control embryo (panel H) and an IGF-2a mRNA injected embryo (panel I). myoD expression in the somite at the 15-somite stage in a control embryo (panel J) and an IGF-2a mRNA injected embryo (panel K). shh expression in the notochord at the 15-somite stage in a control embryo (panel L) and IGF-2a mRNA injected embryos (panels M and N). Among the IGF-2a mRNA injected embryos, 71% showed expression pattern shown in panel M and 24% showed that in panel N (n = 21). myogenin expression in the somite at the 15-somite stage in a control embryo (panel O) and an IGF-2a mRNA injected embryo (panel P). Panels A, B, E–G, and L–N are dorsal view with head up; panels C and D are vegetal view with dorsal the the right; panels H–K, O, and P are dorsal views with head to the left.CC BY · PubMed Central
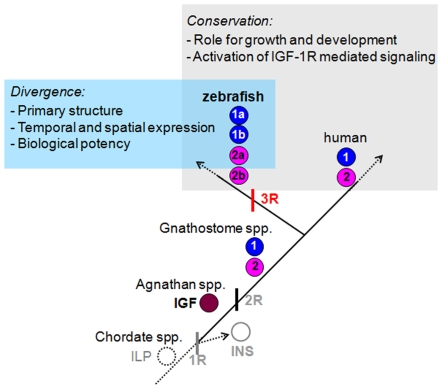
Figure 8 A proposed model for the evolution of multiple IGF genes in zebrafish. It is postulated that an insulin-like gene (ILP) identified in Amphioxus is the likely ancestor of modern vertebrate insulin/IGFs [2]. This ancestral gene subsequently duplicated to form distinct insulin (INS) and IGF, as found in early agnathan vertebrates [3]. The second round (2R) of whole-genome duplication gives rise to distinct IGF-1 and IGF-2 genes found in all gnathosomes [4]. The “fish specific” third round (3R) whole-genome duplication results in four distinct IGF genes, as found in zebrafish in this study. The duplicated IGF genes have evolved overlapping yet distinct functions by attaining differential regulatory mechanisms of gene expression, different peptide structure, and different biological activities.
Figure 8 A proposed model for the evolution of multiple IGF genes in zebrafish. It is postulated that an insulin-like gene (ILP) identified in Amphioxus is the likely ancestor of modern vertebrate insulin/IGFs [2]. This ancestral gene subsequently duplicated to form distinct insulin (INS) and IGF, as found in early agnathan vertebrates [3]. The second round (2R) of whole-genome duplication gives rise to distinct IGF-1 and IGF-2 genes found in all gnathosomes [4]. The “fish specific” third round (3R) whole-genome duplication results in four distinct IGF genes, as found in zebrafish in this study. The duplicated IGF genes have evolved overlapping yet distinct functions by attaining differential regulatory mechanisms of gene expression, different peptide structure, and different biological activities.CC BY · PubMed Central

Verification

Claims the paper makes

The claims and statistics of this paper haven’t been checked yet.

Run the check — free, no account needed. It reads the open-access text and checks the sources it cites.

A few free checks a day · papers already verified open instantly · results are public

Claims other papers make about this one

Each is checked against this paper’s own text: does it say what the citing paper says it does?

Self-check

Percentages, sums and reported differences re-computed from the paper’s own numbers.

The self-check needs the paper’s full text.

Citations

Cites

Show all 64 references

Research works printed but not linked: 1

  1. S Nornes, 1998, Zebrafish contains two pax6 genes involved in eye development., Mech Dev, 77, 185

Cited by

Sorted by citations

See all 122

Metadata

Authors
Zou, S., Kamei, H., Modi, Z., & Duan, C.
Affiliations
University of Michigan (US)
Corresponding author
Duan, Cunming
Venue
PLoS ONE
Published
2009-09-17
Volume
4
Issue
9
Pages
e7026
ISSN
1932-6203 (ISSN-L)
OpenAlex
W1986850329
Cited by
122
References
64
Citations by year
2026: 1 · 2025: 1 · 2024: 7 · 2023: 2 · 2022: 7 · 2021: 8 · 2020: 8 · 2019: 8 · 2018: 6 · 2017: 6 · 2016: 7 · 2015: 10 · 2014: 5 · 2013: 14 · 2012: 9
FWCI
4.30
Type
journal article
Language
en
Open access
Locations
  • PLoS ONE (publishedVersion, cc-by)
  • PubMed Central (publishedVersion, cc-by)
  • PubMed (publishedVersion)
  • DOAJ (DOAJ: Directory of Open Access Journals) (submittedVersion, cc-by-sa)
Funders
  • National Science Foundation (0110864)
  • China Scholarship Council
Topics
  • Life Sciences › Biochemistry, Genetics and Molecular Biology › Molecular Biology › Developmental Biology and Gene Regulation
  • Health Sciences › Medicine › Endocrinology, Diabetes and Metabolism › Growth Hormone and Insulin-like Growth Factors
  • Life Sciences › Biochemistry, Genetics and Molecular Biology › Cell Biology › Zebrafish Biomedical Research Applications
Keywords
insulin-like growth factor, gene duplication, functional divergence, notochord development, IGF signaling, zebrafish, gonads, liver
MeSH terms
Animals, Brain, Cloning, Molecular, Neurons, Notochord, Phylogeny, RNA, Messenger, Somatomedins, Zebrafish, Signal Transduction, Open Reading Frames, In Situ Hybridization, Gene Expression Regulation, Developmental, Body Patterning, Gene Duplication

About these checks

Registry, retraction, Cites and statistics results are computed, not judged, with one exception: a printed reference that no index lists is read once by a model before it counts as a citation error. Claims are extracted by a model and kept only when their quote appears verbatim in the text; each cited source is then checked, with a model’s help, for whether it says what the claim relies on. Those verdicts can be wrong — read the claim’s quote and the cited source before relying on one.

Statistics and arithmetic are recomputed, not judged.

Confidence bands are shown only for fields calibrated on our annotated test set. None is calibrated yet, so no band is shown.

What counts as a claim ›How we measure confidence ›How we check this ›

Are you an author, or do you see a problem with this page? Request a review