

The DOI matches its Crossref record; 42 of the 42 references it cites were found in a registry or an index.
The Warburg Effect Is Genetically Determined in Inherited Pheochromocytomas
Open accessAbstract
The Warburg effect describes how cancer cells down-regulate their aerobic respiration and preferentially use glycolysis to generate energy. To evaluate the link between hypoxia and Warburg effect, we studied mitochondrial electron transport, angiogenesis and glycolysis in pheochromocytomas induced by germ-line mutations in VHL, RET, NF1 and SDH genes. SDH and VHL gene mutations have been shown to lead to the activation of hypoxic response, even in normoxic conditions, a process now referred to as pseudohypoxia. We observed a decrease in electron transport protein expression and activity, associated with increased angiogenesis in SDH- and VHL-related, pseudohypoxic tumors, while stimulation of glycolysis was solely observed in VHL tumors. Moreover, microarray analyses revealed that expression of genes involved in these metabolic pathways is an efficient tool for classification of pheochromocytomas in accordance with the predisposition gene mutated. Our data suggest an unexpected association between pseudohypoxia and loss of p53, which leads to a distinct Warburg effect in VHL-related pheochromocytomas.
Overview
The claims and statistics of this paper haven’t been checked yet.
Run the check — free, no account needed. It reads the open-access text and checks the sources it cites.
Integrity signals
Registry
Cites
Statistics
Figures
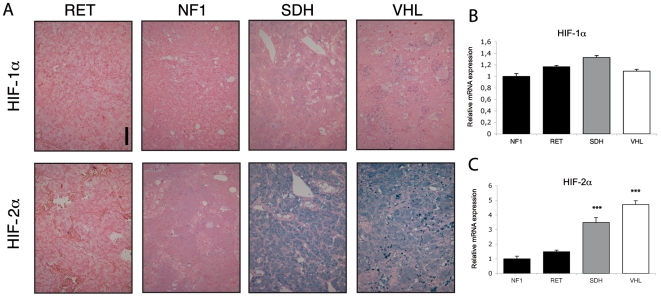
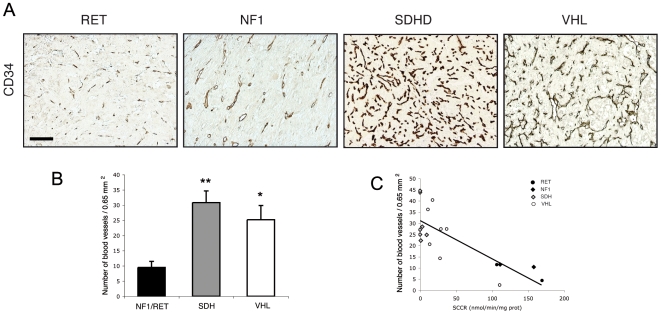
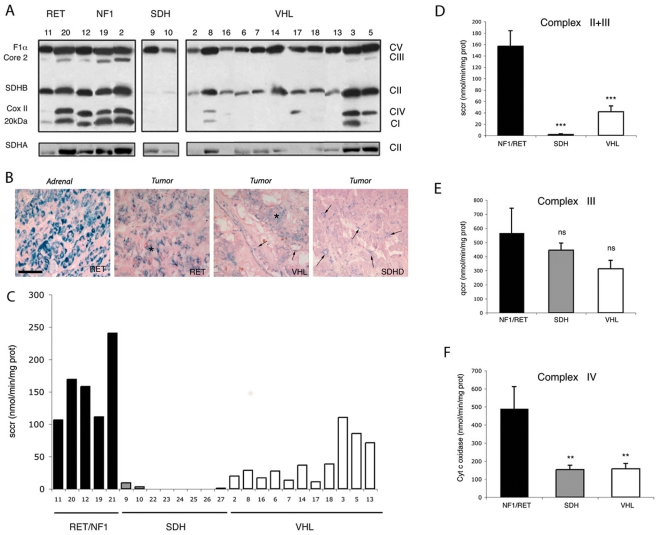
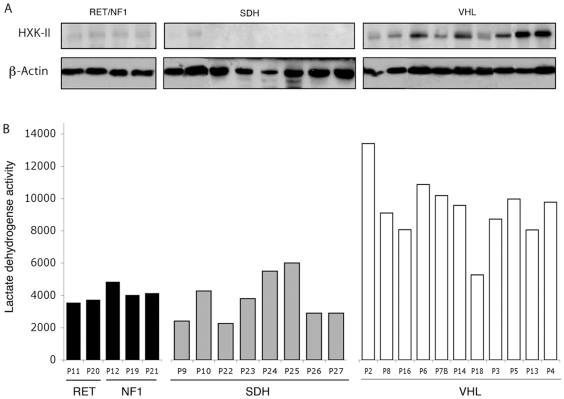
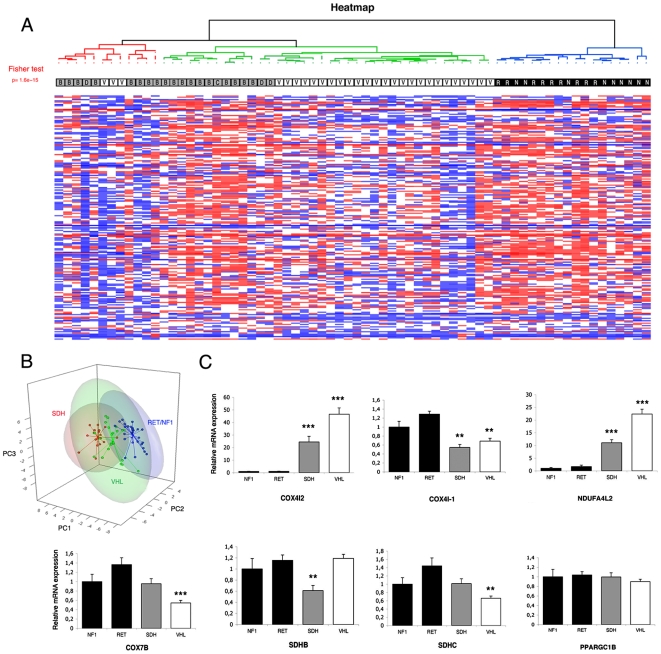
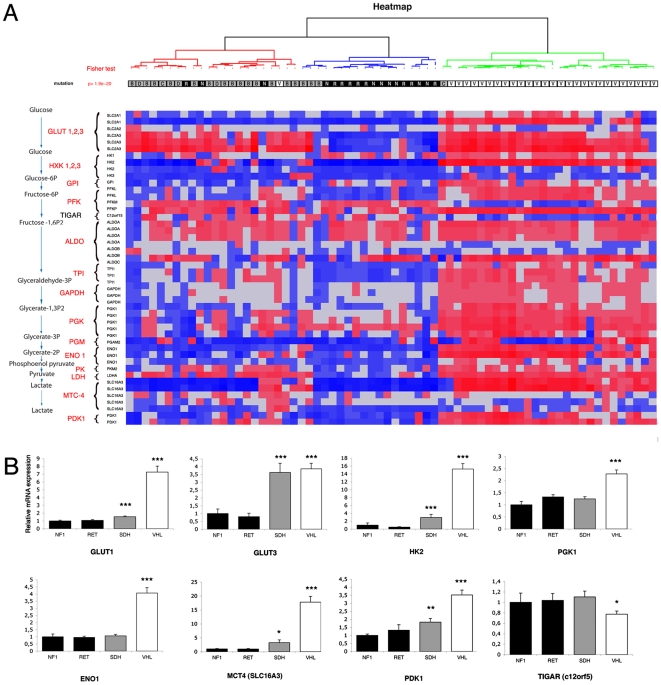
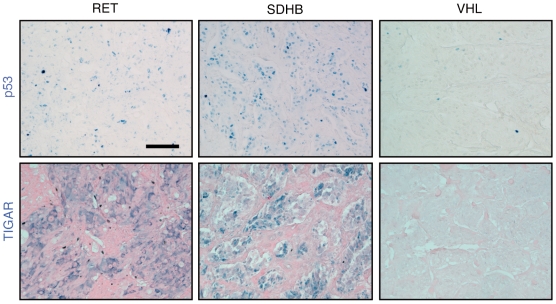
Verification
Claims the paper makes
The claims and statistics of this paper haven’t been checked yet.
Run the check — free, no account needed. It reads the open-access text and checks the sources it cites.
Claims other papers make about this one
Each is checked against this paper’s own text: does it say what the citing paper says it does?
The source backs part of the claim, not all of it — or backs it for a different population, condition or comparison.
In the citing paper
“Interestingly, the tumorigenesis of these closely related tumors seems to involve aberrant HIF-2 signaling, resulting in pseudohypoxic phenotypes linked to disseminated disease (Eisenhofer et al., 2004;Pietras et al., 2008;Favier et al., 2009).”
From Therapeutic targeting of hypoxia and hypoxia-inducible factors in cancer (2016) · cites this paper as Favier et al., 2009
Experimental — accuracy not yet measured
Self-check
Percentages, sums and reported differences re-computed from the paper’s own numbers.
The self-check needs the paper’s full text.
Citations
Cites
Understanding the Warburg Effect: The Metabolic Requirements of Cell Proliferation
Vander Heiden, M. G., Cantley, L. C., & Thompson, C. B. (2009) · Science · doi:10.1126/science.1160809 · Cited by 16,197
Bioconductor: open software development for computational biology and bioinformatics
Gentleman, R. C., Carey, V. J., Bates, D. M., Bolstad, B., Dettling, M., Dudoit, S., Ellis, B., Gautier, L., Ge, Y., Gentry, J., et al. (2004) · Genome biology · doi:10.1186/gb-2004-5-10-r80 · Cited by 12,082
Exploration, normalization, and summaries of high density oligonucleotide array probe level data
Irizarry, R. A. (2003) · Biostatistics · doi:10.1093/biostatistics/4.2.249 · Cited by 10,603
Targeting HIF-1 for cancer therapy
Semenza, G. L. (2003) · Nature Reviews Cancer · doi:10.1038/nrc1187 · Cited by 6,717
On Respiratory Impairment in Cancer Cells
Warburg, O. H. (1956) · Science · doi:10.1126/science.124.3215.269 · Cited by 3,472
Succinate links TCA cycle dysfunction to oncogenesis by inhibiting HIF-α prolyl hydroxylase
Selak, M. A., Armour, S. M., MacKenzie, E. D., Boulahbel, H., Watson, D. G., Mansfield, K. D., Pan, Y., Simon, M. C., Thompson, C. B., & Gottlieb, E. (2005) · Cancer Cell · doi:10.1016/j.ccr.2004.11.022 · Cited by 2,108
TIGAR, a p53-Inducible Regulator of Glycolysis and Apoptosis
Bensaad, K., Tsuruta, A., Selak, M. A., Vidal, M. N. C., Nakano, K., Bartrons, R., Gottlieb, E., & Vousden, K. H. (2006) · Cell · doi:10.1016/j.cell.2006.05.036 · Cited by 2,019
p53 Regulates Mitochondrial Respiration
Matoba, S., Kang, J.-G., Patino, W. D., Wragg, A., Boehm, M., Gavrilova, O., Hurley, P. J., Bunz, F., & Hwang, P. M. (2006) · Science · doi:10.1126/science.1126863 · Cited by 1,650
HIF-1 Regulates Cytochrome Oxidase Subunits to Optimize Efficiency of Respiration in Hypoxic Cells
Fukuda, R., Zhang, H., Kim, J.-W., Shimoda, L., Dang, C. V., & Semenza, G. L. (2007) · Cell · doi:10.1016/j.cell.2007.01.047 · Cited by 1,225
Role of VHL Gene Mutation in Human Cancer
Kim, W. Y., & Kaelin, W. G. (2004) · Journal of Clinical Oncology · doi:10.1200/jco.2004.05.061 · Cited by 955
Cited by
Sorted by citations
SDH mutations establish a hypermethylator phenotype in paraganglioma
Letouzé, E., Martinelli, C., Loriot, C., Burnichon, N., Abermil, N., Ottolenghi, C., Janin, M., Menara, M., Nguyen, A. T., Benit, P., et al. (2013) · Cancer Cell · doi:10.1016/j.ccr.2013.04.018 · Cited by 776
Self-citationTherapeutic targeting of hypoxia and hypoxia-inducible factors in cancer
Wigerup, C., Påhlman, S., & Bexell, D. (2016) · Pharmacology & Therapeutics · doi:10.1016/j.pharmthera.2016.04.009 · Cited by 687
“Interestingly, the tumorigenesis of these closely related tumors seems to involve aberrant HIF-2 signaling, resulting in pseudohypoxic phenotypes linked to disseminated disease (Eisenhofer et al., 2004; Pietras et al., 2008; Favier et al., 2009).”
BackgroundSeyfried, T. N., & Shelton, L. M. (2010) · Nutrition & Metabolism · doi:10.1186/1743-7075-7-7 · Cited by 675
SDHA is a tumor suppressor gene causing paraganglioma
Burnichon, N., Brière, J.-J., Libé, R., Vescovo, L., Rivière, J., Tissier, F., Jouanno, E., Jeunemaı̂tre, X., Bénit, P., Tzagoloff, A., et al. (2010) · Human Molecular Genetics · doi:10.1093/hmg/ddq206 · Cited by 645
Self-citationExome sequencing identifies MAX mutations as a cause of hereditary pheochromocytoma
Comino‐Méndez, I., Gracia-Aznárez, F. J., Schiavi, F., Landa, I., Leandro-Garcia, L. J., Letón, R., Honrado, E., Ramos‐Medina, R., Caronia, D., Pita, G., et al. (2011) · Nature Genetics · doi:10.1038/ng.861 · Cited by 528
Metadata
- Authors
- Favier, J., Brière, J.-J., Burnichon, N., Rivière, J., Vescovo, L., Benit, P., Giscos-Douriez, I., De Reyniès, A., Bertherat, J., Badoual, C., Tissier, F., Amar, L., Libé, R., Plouin, P.-F., Jeunemaitre, X., Rustin, P., & Gimenez-Roqueplo, A.-P.
- Affiliations
- Inserm (FR)
- La Ligue Contre le Cancer (FR)
- Assistance Publique – Hôpitaux de Paris (FR)
- Hôpital Cochin (FR)
- Corresponding author
- Favier, Judith
- ORCID
- Venue
- PLoS ONE
- Publisher
- Public Library of Science (PLoS)
- Published
- 2009-09-18
- Volume
- 4
- Issue
- 9
- Pages
- e7094
- ISSN
- 1932-6203 (ISSN-L)
- PMC
- PMC2738974
- OpenAlex
- W2063687158
- Cited by
- 232
- References
- 42
- Citations by year
- 2026: 7 · 2025: 3 · 2024: 4 · 2023: 4 · 2022: 10 · 2021: 7 · 2020: 12 · 2019: 13 · 2018: 14 · 2017: 11 · 2016: 15 · 2015: 28 · 2014: 27 · 2013: 16 · 2012: 27
- FWCI
- 20.62
- Type
- journal article
- Language
- en
- Open access
- gold
- doi.org
- Locations
- PLoS ONE (publishedVersion, cc-by)
- PubMed Central (publishedVersion, cc-by)
- PubMed (publishedVersion)
- DOAJ (DOAJ: Directory of Open Access Journals) (submittedVersion, cc-by-sa)
- Funders
- Association pour la Recherche sur le Cancer
- Agence Nationale de la Recherche
- GIS-Institut des Maladies Rares
- Topics
- Health Sciences › Medicine › Surgery › Adrenal and Paraganglionic Tumors
- Life Sciences › Biochemistry, Genetics and Molecular Biology › Cancer Research › Cancer, Hypoxia, and Metabolism
- Health Sciences › Medicine › Oncology › Ear and Head Tumors
- Keywords
- Warburg effect, pheochromocytoma, pseudohypoxia, VHL gene, SDH genes, RET proto-oncogene, NF1 gene, mitochondrial electron transport chain, angiogenesis, glycolysis, p53 deficiency, cancer metabolism, germline mutations, gene expression profiling
- MeSH terms
- Adolescent, Adult, Aged, Hypoxia, Child, Electron Transport, Female, Glycolysis, Humans, Male, Middle Aged, Mitochondria, Neovascularization, Pathologic, Oxidative Phosphorylation, Pheochromocytoma, Genes, p53, Germ-Line Mutation, Oligonucleotide Array Sequence Analysis
About these checks
Registry, retraction, Cites and statistics results are computed, not judged, with one exception: a printed reference that no index lists is read once by a model before it counts as a citation error. Claims are extracted by a model and kept only when their quote appears verbatim in the text; each cited source is then checked, with a model’s help, for whether it says what the claim relies on. Those verdicts can be wrong — read the claim’s quote and the cited source before relying on one.
Statistics and arithmetic are recomputed, not judged.
Confidence bands are shown only for fields calibrated on our annotated test set. None is calibrated yet, so no band is shown.
What counts as a claim ›How we measure confidence ›How we check this ›
Are you an author, or do you see a problem with this page? Request a review
