

The DOI matches its Crossref record; 72 of the 73 references it cites were found in a registry or an index.
Evolutionary Innovations and the Organization of Protein Functions in Genotype Space
Open accessAbstract
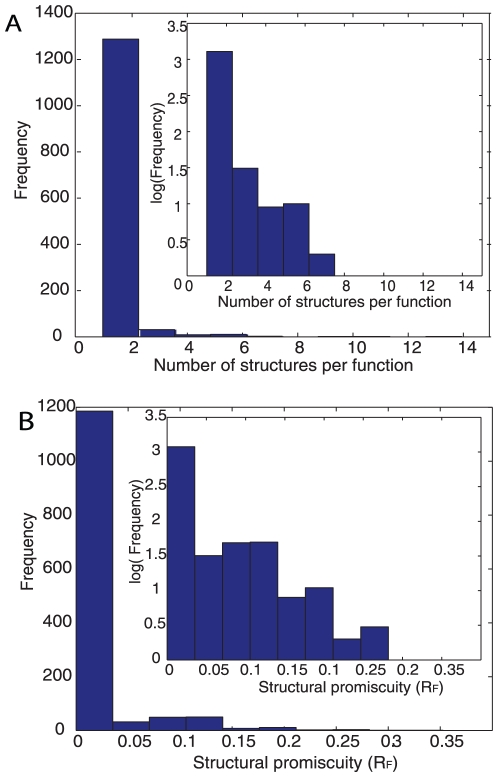
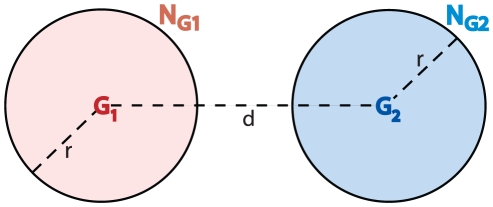
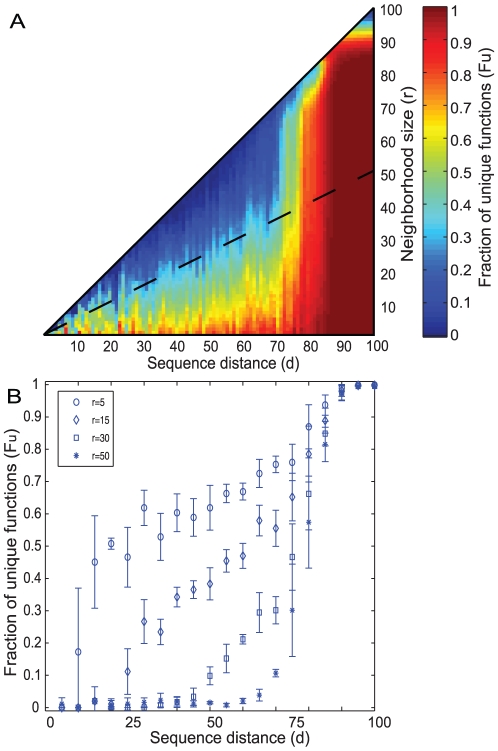
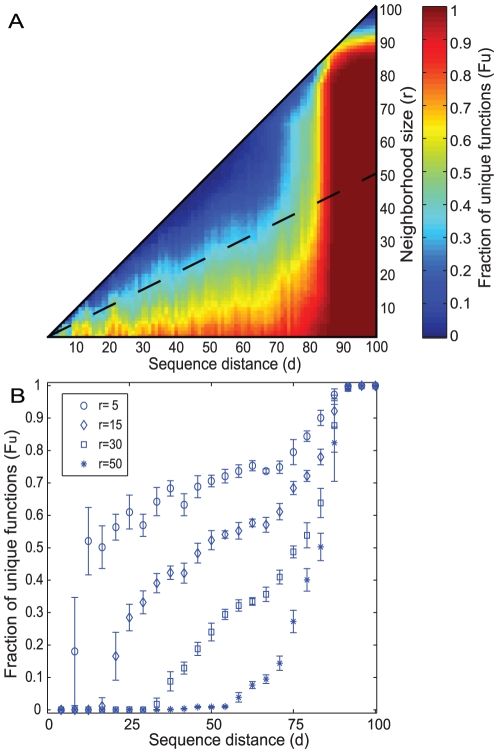
The organization of protein structures in protein genotype space is well studied. The same does not hold for protein functions, whose organization is important to understand how novel protein functions can arise through blind evolutionary searches of sequence space. In systems other than proteins, two organizational features of genotype space facilitate phenotypic innovation. The first is that genotypes with the same phenotype form vast and connected genotype networks. The second is that different neighborhoods in this space contain different novel phenotypes. We here characterize the organization of enzymatic functions in protein genotype space, using a data set of more than 30,000 proteins with known structure and function. We show that different neighborhoods of genotype space contain proteins with very different functions. This property both facilitates evolutionary innovation through exploration of a genotype network, and it constrains the evolution of novel phenotypes. The phenotypic diversity of different neighborhoods is caused by the fact that some functions can be carried out by multiple structures. We show that the space of protein functions is not homogeneous, and different genotype neighborhoods tend to contain a different spectrum of functions, whose diversity increases with increasing distance of these neighborhoods in sequence space. Whether a protein with a given function can evolve specific new functions is thus determined by the protein's location in sequence space.
Overview
The claims and statistics of this paper haven’t been checked yet.
Run the check — free, no account needed. It reads the open-access text and checks the sources it cites.
Integrity signals
Registry
Cites
Statistics
Figures
Verification
Claims the paper makes
The claims and statistics of this paper haven’t been checked yet.
Run the check — free, no account needed. It reads the open-access text and checks the sources it cites.
Claims other papers make about this one
Each is checked against this paper’s own text: does it say what the citing paper says it does?
The source backs part of the claim, not all of it — or backs it for a different population, condition or comparison.
In the citing paper
“The authors estimated a probability of 1 in 10 11 to find an ATP binding protein, suggesting a higher probability than found by Axe.”
From Using statistical methods to model the fine-tuning of molecular machines and systems (2020) · cites this paper as Ferrada and Wagner, 2010
Experimental — accuracy not yet measured
Self-check
Percentages, sums and reported differences re-computed from the paper’s own numbers.
The self-check needs the paper’s full text.
Citations
Cites
Thompson, J. D., Higgins, D. G., & Gibson, T. J. (1994) · Nucleic Acids Research · doi:10.1093/nar/22.22.4673 · Cited by 64,617
Berman, H. M. (2000) · Nucleic Acids Research · doi:10.1093/nar/28.1.235 · Cited by 40,196
T-coffee: a novel method for fast and accurate multiple sequence alignment 1 1Edited by J. Thornton
Notredame, C., Higgins, D. G., & Heringa, J. (2000) · Journal of Molecular Biology · doi:10.1006/jmbi.2000.4042 · Cited by 6,964
Murzin, A. G., Brenner, S. E., Hubbard, T., & Chothia, C. (1995) · Journal of Molecular Biology · doi:10.1016/s0022-2836(05)80134-2 · Cited by 6,435
Eddy, S. R. (1998) · Bioinformatics · doi:10.1093/bioinformatics/14.9.755 · Cited by 5,515
The Universal Protein Resource (UniProt)
Bairoch, A. (2004) · Nucleic Acids Research · doi:10.1093/nar/gki070 · Cited by 3,774
The relation between the divergence of sequence and structure in proteins.
Chothia, C., & Lesk, A. M. (1986) · The EMBO Journal · doi:10.1002/j.1460-2075.1986.tb04288.x · Cited by 2,458
Twilight zone of protein sequence alignments
Rost, B. (1999) · Protein Engineering, Design and Selection · doi:10.1093/protein/12.2.85 · Cited by 1,833
Smith, J. M., Burian, R. M., Kauffman, S. A., Alberch, P., Campbell, J., Goodwin, B. C., Lande, R., Raup, D. M., & Wolpert, L. (1985) · The Quarterly Review of Biology · doi:10.1086/414425 · Cited by 1,442
Bairoch, A. (2000) · Nucleic Acids Res. · doi:10.1093/nar/28.1.304 · Cited by 1,182
Research works printed but not linked: 2
- [20]Buchler NEG Goldstein RA 1999 Effect of alphabet size and foldability requirements on protein structure designability. Proteins Struct Funct Bioinf 34 113 124 10336377
- [30]Todd AE Orengo CA Thornton JM 2001 Evolution of function in protein superfamilies, from a structural perspective. J Mol Biol 307 1113 1143 11286560
Cited by
Sorted by citations
Currin, A., Swainston, N., Day, P. J., & Kell, D. B. (2014) · Chemical Society Reviews · doi:10.1039/c4cs00351a · Cited by 393
The molecular origins of evolutionary innovations
Wagner, A. (2011) · Trends in Genetics · doi:10.1016/j.tig.2011.06.002 · Cited by 127
Self-citationStructural properties of genotype–phenotype maps
Ahnert, S. E. (2017) · Journal of The Royal Society Interface · doi:10.1098/rsif.2017.0275 · Cited by 110
Schaper, S., & Louis, A. A. (2014) · PLoS ONE · doi:10.1371/journal.pone.0086635 · Cited by 90
Manrubia, S., Cuesta, J. A., Aguirre, J., Ahnert, S. E., Altenberg, L., Cano, A. V., Catalán, P., Diaz-Uriarte, R., Elena, S. F., García-Martín, J. A., et al. (2021) · Physics of Life Reviews · doi:10.1016/j.plrev.2021.03.004 · Cited by 88
On the Nature and Evolutionary Impact of Phenotypic Robustness Mechanisms
Siegal, M. L., & Leu, J. (2014) · Annual Review of Ecology Evolution and Systematics · doi:10.1146/annurev-ecolsys-120213-091705 · Cited by 90
Genotype networks shed light on evolutionary constraints
Wagner, A. (2011) · Trends in Ecology & Evolution · doi:10.1016/j.tree.2011.07.001 · Cited by 68
Self-citationThe origins of mutational robustness
Fares, M. A. (2015) · Trends in Genetics · doi:10.1016/j.tig.2015.04.008 · Cited by 64
Yang, D., Deuis, J. R., Dashevsky, D., Dobson, J. S., Jackson, T., Brust, A., Xie, B., Koludarov, I., Debono, J., Hendrikx, I., et al. (2016) · Toxins · doi:10.3390/toxins8100303 · Cited by 61
Evolution of networks of protein domain organization
Aziz, M. F., & Caetano‐Anollés, G. (2021) · Scientific Reports · doi:10.1038/s41598-021-90498-8 · Cited by 55
Robustness, Evolvability, and the Logic of Genetic Regulation
Payne, J. L., Moore, J. H., & Wagner, A. (2013) · Artificial Life · doi:10.1162/artl_a_00099 · Cited by 52
Self-citationEvolution of mammalian sound localization circuits: A developmental perspective
Nothwang, H. G. (2016) · Progress in Neurobiology · doi:10.1016/j.pneurobio.2016.02.003 · Cited by 49
A Comparison of Genotype-Phenotype Maps for RNA and Proteins
Ferrada, E., & Wagner, A. (2012) · Biophysical Journal · doi:10.1016/j.bpj.2012.01.047 · Cited by 46
Self-citationThe Role of Randomness in Darwinian Evolution
Wagner, A. (2012) · Philosophy of Science · doi:10.1086/663239 · Cited by 45
Self-citationGreenbury, S. F., & Ahnert, S. E. (2015) · Journal of The Royal Society Interface · doi:10.1098/rsif.2015.0724 · Cited by 39
A Model of Substitution Trajectories in Sequence Space and Long-Term Protein Evolution
Usmanova, D. R., Luca Ferretti, A., Povolotskaya, I., Vlasov, P. K., & Kondrashov, F. A. (2014) · Molecular Biology and Evolution · doi:10.1093/molbev/msu318 · Cited by 32
The Natural History of Biocatalytic Mechanisms
Nath, N., Mitchell, J. B. O., & Caetano‐Anollés, G. (2014) · PLoS Computational Biology · doi:10.1371/journal.pcbi.1003642 · Cited by 32
Genotype networks, innovation, and robustness in sulfur metabolism
Rodrigues, J. F. M., & Wagner, A. (2011) · BMC Systems Biology · doi:10.1186/1752-0509-5-39 · Cited by 30
Self-citationStrong Emergence in Biological Systems: Is It Open to Mathematical Reasoning?
Hao, Z., Liu, J., Wu, B., Yu, M., & Wegner, L. H. (2021) · Acta Biotheoretica · doi:10.1007/s10441-021-09423-1 · Cited by 26
Tracing protein and proteome history with chronologies and networks: folding recapitulates evolution
Caetano‐Anollés, G., Aziz, M. F., Mughal, F., & Caetano-Anollés, D. (2021) · Expert Review of Proteomics · doi:10.1080/14789450.2021.1992277 · Cited by 21
Human Genome Variation and the Concept of Genotype Networks
Dall’Olio, G. M., Bertranpetit, J., Wagner, A., & Laayouni, H. (2014) · PLoS ONE · doi:10.1371/journal.pone.0099424 · Cited by 21
Self-citationThe low cost of recombination in creating novel phenotypes
Wagner, A. (2011) · BioEssays · doi:10.1002/bies.201100027 · Cited by 19
Self-citationFungal adaptation to plant defences through convergent assembly of metabolic modules
Gluck‐Thaler, E., Vijayakumar, V., & Slot, J. C. (2018) · Molecular Ecology · doi:10.1111/mec.14943 · Cited by 18
Using statistical methods to model the fine-tuning of molecular machines and systems
Thorvaldsen, S., & Hössjer, O. (2020) · Journal of Theoretical Biology · doi:10.1016/j.jtbi.2020.110352 · Cited by 15
A Dynamic Model for the Evolution of Protein Structure
Tal, G., Boca, S. M., Mittenthal, J. E., & Caetano‐Anollés, G. (2016) · Journal of Molecular Evolution · doi:10.1007/s00239-016-9740-1 · Cited by 14
Herrera‐Álvarez, S., Patton, J. E. J., & Thornton, J. W. (2025) · Nature Ecology & Evolution · doi:10.1038/s41559-025-02777-6 · Cited by 11
Testing Empirical Support for Evolutionary Models that Root the Tree of Life
Caetano-Anollés, D., Nasir, A., Kim, K. M., & Caetano‐Anollés, G. (2019) · Journal of Molecular Evolution · doi:10.1007/s00239-019-09891-7 · Cited by 11
Seasonal effects decouple SARS-CoV-2 haplotypes worldwide
Tomaszewski, T., Ali, M. A., Caetano-Anollés, K., & Caetano‐Anollés, G. (2023) · F1000Research · doi:10.12688/f1000research.131522.1 · Cited by 11
Estimating the information content of genetic sequence data
Thorvaldsen, S., & Hössjer, O. (2023) · Journal of the Royal Statistical Society Series C (Applied Statistics) · doi:10.1093/jrsssc/qlad062 · Cited by 6
Evolution and belief: confessions of a religious paleontologist
Asher, R. (2012) · Choice Reviews Online · doi:10.5860/choice.50-0862 · Cited by 6
Co-evolution in the Jungle: From Leafcutter Ant Colonies to Chromosomal Ends
Tomáška, Ľ., & Nosek, J. (2020) · Journal of Molecular Evolution · doi:10.1007/s00239-020-09935-3 · Cited by 4
Miller, B. (2025) · PLoS ONE · doi:10.1371/journal.pone.0339572 · Cited by 3
Entropic boundary conditions towards safe artificial superintelligence
Núñez-Corrales, S., & Jakobsson, E. (2021) · Journal of Experimental & Theoretical Artificial Intelligence · doi:10.1080/0952813x.2021.1952653 · Cited by 3
Descent from a common ancestor restricts exploration of protein sequence space
Isakova, L. H., Streltsova, E., Bochkareva, O., Vlasov, P. K., & Kondrashov, F. A. (2026) · Proceedings of the National Academy of Sciences · doi:10.1073/pnas.2532018123 · Cited by 2
Genotype Networks and Evolutionary Innovations in Biological Systems
Wagner, A. (2012) · Elsevier eBooks · doi:10.1016/b978-0-12-385944-0.00013-7 · Cited by 2
Self-citationStationary distribution of self-organized states and biological information generation
Woo, H. J. (2013) · Scientific Reports · doi:10.1038/srep03329 · Cited by 2
On the Relationship between Design and Evolution
Dilley, S. C., Luskin, C. R., Miller, B., & Reeves, E. (2023) · Religions · doi:10.3390/rel14070850 · Cited by 2
The Use and Abuse of Probability in Evolutionary Biology
Rosenhouse, J. (2023) · Springer eBooks · doi:10.1007/978-3-030-19071-2_107-1 · Cited by 1
Intelligent design and natural theology
Thorvaldsen, S. (2020) · Theofilos · doi:10.48032/theo/12/1/7 · Cited by 1
Nasir, A., Kim, K. M., & Caetano‐Anollés, G. (2016) · bioRxiv (Cold Spring Harbor Laboratory) · doi:10.1101/050179
Robustness and Evolvability in Molecular Evolution
Wagner, A., & Payne, J. L. (2016) · Elsevier eBooks · doi:10.1016/b978-0-12-800049-6.00182-7
Self-citationEvolutionary Computing to Examine Variation in Proteins with Evolution
Ray, S. (2016) · Advances in computational intelligence and robotics book series · doi:10.4018/978-1-5225-0058-2.ch008
Gene Families, Epistasis and the Amino Acid Preferences of Protein Homologs
Ferrada, E. (2019) · Evolutionary Bioinformatics · doi:10.1177/1176934319870485
Self-citationNot by Selection Alone: Evolutionary Explanations and Their Requirements
Kojonen, R. (2021) · Palgrave frontiers in philosophy of religion · doi:10.1007/978-3-030-69683-2_4
Evolutionary Computing to Examine Variation in Proteins with Evolution
Ray, S. (2016) · IGI Global eBooks · doi:10.4018/978-1-5225-0788-8.ch009
The Use and Abuse of Probability in Evolutionary Biology
Rosenhouse, J. (2024) · Springer eBooks · doi:10.1007/978-3-031-40846-5_107
Robustness and Evolvability in Molecular Evolution
Wagner, A. (2025) · Elsevier eBooks · doi:10.1016/b978-0-443-15750-9.00145-2
Self-citationCoverage Geometry and Heuristic Discovery Times in Protein Sequence SpacePreprint
Moinudeen, H. K., & duygu, A. (2026) · bioRxiv (Cold Spring Harbor Laboratory) · doi:10.64898/2026.09.01.748471
Metadata
- Authors
- Ferrada, E., & Wagner, A.
- Affiliations
- SIB Swiss Institute of Bioinformatics (CH)
- Corresponding author
- Ferrada, Evandro
- Venue
- PLoS ONE
- Publisher
- Public Library of Science (PLoS)
- Published
- 2010-11-30
- Volume
- 5
- Issue
- 11
- Pages
- e14172
- ISSN
- 1932-6203 (ISSN-L)
- PMC
- PMC2994758
- OpenAlex
- W2082738116
- Cited by
- 51
- References
- 73
- Citations by year
- 2026: 2 · 2025: 3 · 2024: 2 · 2023: 4 · 2021: 6 · 2020: 4 · 2019: 2 · 2018: 1 · 2017: 1 · 2016: 7 · 2015: 2 · 2014: 6 · 2013: 2 · 2012: 4
- FWCI
- 1.98
- Type
- journal article
- Language
- en
- Open access
- gold
- doi.org
- Locations
- PLoS ONE (publishedVersion, cc-by)
- PubMed Central (publishedVersion, cc-by)
- PubMed (publishedVersion)
- Zurich Open Repository and Archive (University of Zurich) (acceptedVersion, cc-by)
- DOAJ (DOAJ: Directory of Open Access Journals) (submittedVersion, cc-by-sa)
- Figshare (submittedVersion, cc-by)
- Zurich Open Repository and Archive (University of Zurich) (submittedVersion, cc-by)
- Zurich Open Repository and Archive (University of Zurich)
- Funders
- National Science Foundation
- Schweizerischer Nationalfonds zur Förderung der Wissenschaftlichen Forschung (315200, 315230, 119697, 129708, 116814)
- Universität Zürich
- SystemsX.ch
- Topics
- Life Sciences › Biochemistry, Genetics and Molecular Biology › Genetics › Evolution and Genetic Dynamics
- Life Sciences › Biochemistry, Genetics and Molecular Biology › Molecular Biology › Protein Structure and Dynamics
- Life Sciences › Biochemistry, Genetics and Molecular Biology › Molecular Biology › RNA and protein synthesis mechanisms
- Keywords
- protein function evolution, genotype space, sequence spaces, enzyme function, protein structure-function relationship, genotype networks, phenotypic innovation, functional diversity
- MeSH terms
- Algorithms, Binding Sites, Enzymes, Genotype, Proteins, Substrate Specificity, Protein Structure, Tertiary, Evolution, Molecular, Databases, Protein, Biocatalysis
About these checks
Registry, retraction, Cites and statistics results are computed, not judged, with one exception: a printed reference that no index lists is read once by a model before it counts as a citation error. Claims are extracted by a model and kept only when their quote appears verbatim in the text; each cited source is then checked, with a model’s help, for whether it says what the claim relies on. Those verdicts can be wrong — read the claim’s quote and the cited source before relying on one.
Statistics and arithmetic are recomputed, not judged.
Confidence bands are shown only for fields calibrated on our annotated test set. None is calibrated yet, so no band is shown.
What counts as a claim ›How we measure confidence ›How we check this ›
Are you an author, or do you see a problem with this page? Request a review
