

The DOI matches its Crossref record; 45 of the 45 references it cites were found in a registry or an index.
Controlling the Response: Predictive Modeling of a Highly Central, Pathogen-Targeted Core Response Module in Macrophage Activation
Abstract
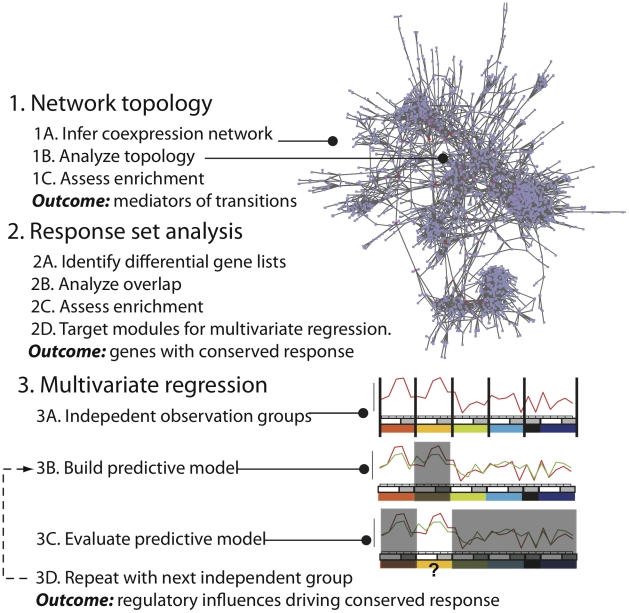
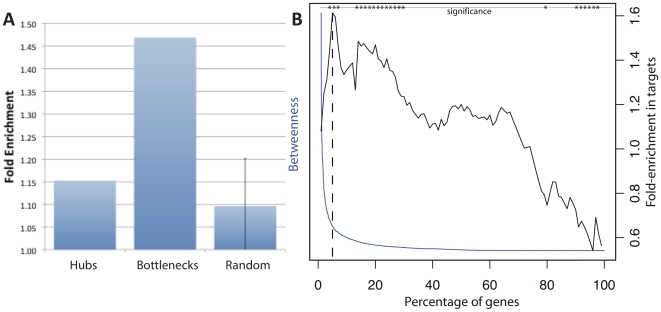
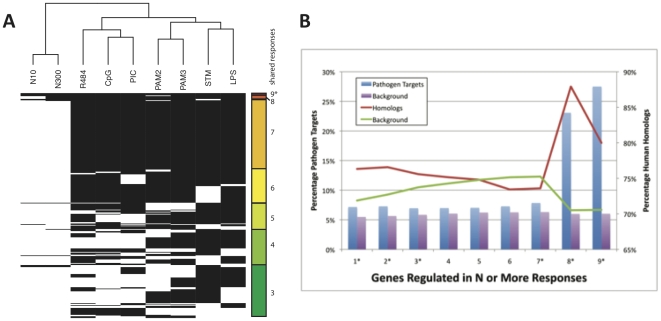
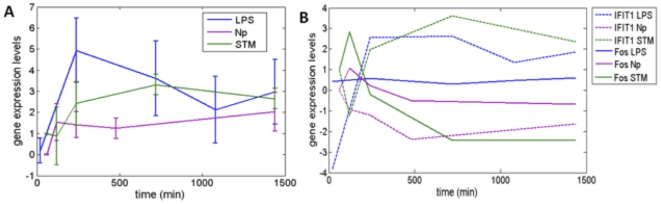
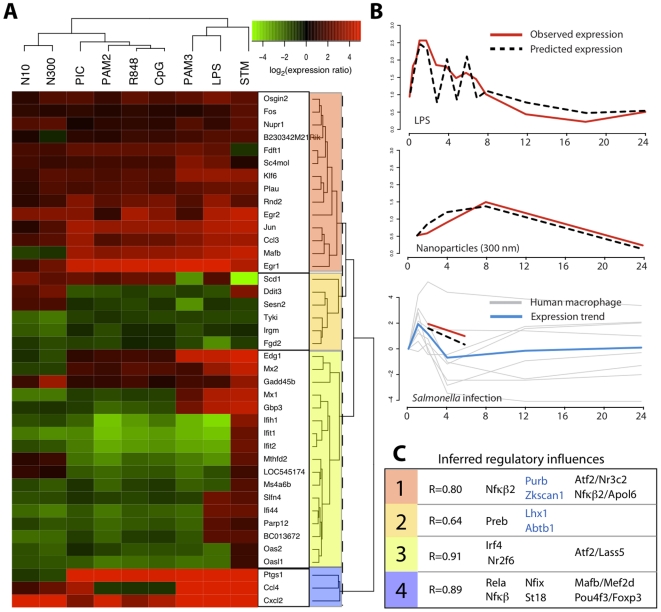
We have investigated macrophage activation using computational analyses of a compendium of transcriptomic data covering responses to agonists of the TLR pathway, Salmonella infection, and manufactured amorphous silica nanoparticle exposure. We inferred regulatory relationship networks using this compendium and discovered that genes with high betweenness centrality, so-called bottlenecks, code for proteins targeted by pathogens. Furthermore, combining a novel set of bioinformatics tools, topological analysis with analysis of differentially expressed genes under the different stimuli, we identified a conserved core response module that is differentially expressed in response to all studied conditions. This module occupies a highly central position in the inferred network and is also enriched in genes preferentially targeted by pathogens. The module includes cytokines, interferon induced genes such as Ifit1 and 2, effectors of inflammation, Cox1 and Oas1 and Oasl2, and transcription factors including AP1, Egr1 and 2 and Mafb. Predictive modeling using a reverse-engineering approach reveals dynamic differences between the responses to each stimulus and predicts the regulatory influences directing this module. We speculate that this module may be an early checkpoint for progression to apoptosis and/or inflammation during macrophage activation.
Overview
The claims and statistics of this paper haven’t been checked yet.
Run the check — free, no account needed. It reads the open-access text and checks the sources it cites.
Integrity signals
Registry
Cites
Statistics
Figures
Verification
Claims the paper makes
The claims and statistics of this paper haven’t been checked yet.
Run the check — free, no account needed. It reads the open-access text and checks the sources it cites.
Claims other papers make about this one
Each is checked against this paper’s own text: does it say what the citing paper says it does?
The cited source doesn’t support the claim as written.
In the citing paper
“Despite a number of genomic studies analyzing macrophage activation in response to bacteria, TLR ligands, and M1 or M2 stimuli, to date there have been no attempts to reconcile these observations by building new and integrative models of macrophage activation”
From Transcriptome-Based Network Analysis Reveals a Spectrum Model of Human Macrophage Activation (2014) · cites this paper as McDermott et al., 2011
Checked by a reasoning model — may be wrong.
Experimental — accuracy not yet measured
Self-check
Percentages, sums and reported differences re-computed from the paper’s own numbers.
The self-check needs the paper’s full text.
Citations
Cites
Controlling the False Discovery Rate: A Practical and Powerful Approach to Multiple Testing
Benjamini, Y., & Hochberg, Y. (1995) · Journal of the Royal Statistical Society Series B: Statistical Methodology · doi:10.1111/j.2517-6161.1995.tb02031.x · Cited by 109,482
Regression shrinkage and selection via the lasso
Tibshirani, R. (1996) · Journal of the Royal Statistical Society Series B: Statistical Methodology · doi:10.1111/j.2517-6161.1996.tb02080.x · Cited by 51,482
Efron, B., Hastie, T., Johnstone, I., & Tibshirani, R. (2004) · The Annals of Statistics · doi:10.1214/009053604000000067 · Cited by 9,357
Bolstad, B. M., Irizarry, R. A., Åstrand, M., & Speed, T. P. (2003) · Bioinformatics · doi:10.1093/bioinformatics/19.2.185 · Cited by 8,359
Recognition of microorganisms and activation of the immune response
Medzhitov, R. (2007) · Nature · doi:10.1038/nature06246 · Cited by 2,862
Margolin, A. A., Nemenman, I., Basso, K., Wiggins, C., Stolovitzky, G., Favera, R. D., & Califano, A. (2006) · BMC Bioinformatics · doi:10.1186/1471-2105-7-s1-s7 · Cited by 2,420
Signaling to NF-κB by Toll-like receptors
Kawai, T., & Akira, S. (2007) · Trends in Molecular Medicine · doi:10.1016/j.molmed.2007.09.002 · Cited by 2,388
Margolin, A. A., Nemenman, I. M., Basso, K., Wiggins, C. H., Stolovitzky, G. A., Favera, R. D., & Califano, A. (2006) · BMC Bioinformatics · doi:10.7916/d8g15zbp · Cited by 2,259
Faith, J. J., Hayete, B., Thaden, J. T., Mogno, I., Wierzbowski, J., Cottarel, G., Kasif, S., Collins, J. J., & Gardner, T. S. (2007) · PLoS Biology · doi:10.1371/journal.pbio.0050008 · Cited by 1,563
mRNA stability in mammalian cells
Ross, J. (1995) · Microbiological Reviews · doi:10.1128/mr.59.3.423-450.1995 · Cited by 1,411
Research works printed but not linked: 1
- JE McDermott, Separating the drivers from the driven: Integrative network and pathway approaches aid identification of disease biomarkers from high-throughput data., Dis Markers, 28, 253, 10.1155/2010/708932 · DOI
Cited by
Transcriptome-Based Network Analysis Reveals a Spectrum Model of Human Macrophage Activation
Xue, J., Schmidt, S. V., Sander, J., Draffehn, A., Krebs, W., Quester, I., De Nardo, D., Gohel, T. D., Emde, M., Schmidleithner, L., et al. (2014) · Immunity · doi:10.1016/j.immuni.2014.01.006 · Cited by 2,210
Metadata
- Authors
- McDermott, J. E., Archuleta, M., Thrall, B. D., Adkins, J. N., & Waters, K. M.
- Venue
- PLoS ONE
- Publisher
- Public Library of Science (PLoS)
- Published
- 2011-02-14
- Volume
- 6
- Issue
- 2
- Pages
- e14673
- ISSN
- 1932-6203
- PMC
- PMC3038849
- Cited by
- 31
- References
- 45
- Language
- en
About these checks
Registry, retraction, Cites and statistics results are computed, not judged, with one exception: a printed reference that no index lists is read once by a model before it counts as a citation error. Claims are extracted by a model and kept only when their quote appears verbatim in the text; each cited source is then checked, with a model’s help, for whether it says what the claim relies on. Those verdicts can be wrong — read the claim’s quote and the cited source before relying on one.
Statistics and arithmetic are recomputed, not judged.
Confidence bands are shown only for fields calibrated on our annotated test set. None is calibrated yet, so no band is shown.
What counts as a claim ›How we measure confidence ›How we check this ›
Are you an author, or do you see a problem with this page? Request a review
Data sources
Bibliographic data: Semantic Scholar, OpenAlex, Crossref.
Contains information from the Semantic Scholar Academic Graph Datasets, made available under the ODC Attribution License (ODC-BY 1.0).
Semantic Scholar’s data is described in: Kinney, R., et al. (2023). The Semantic Scholar Open Data Platform. arXiv:2301.10140.
