

The DOI matches its Crossref record; 57 of the 57 references it cites were found in a registry or an index.
Experience-Dependent Plasticity and Modulation of Growth Regulatory Molecules at Central Synapses
Open accessAbstract
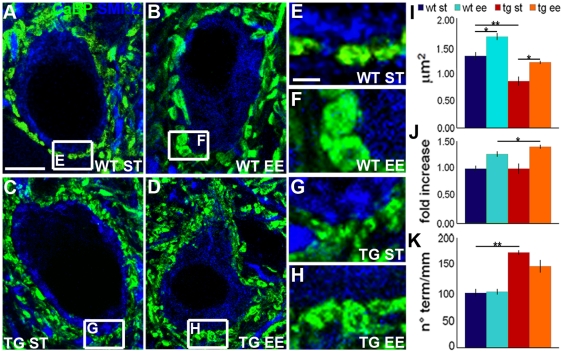
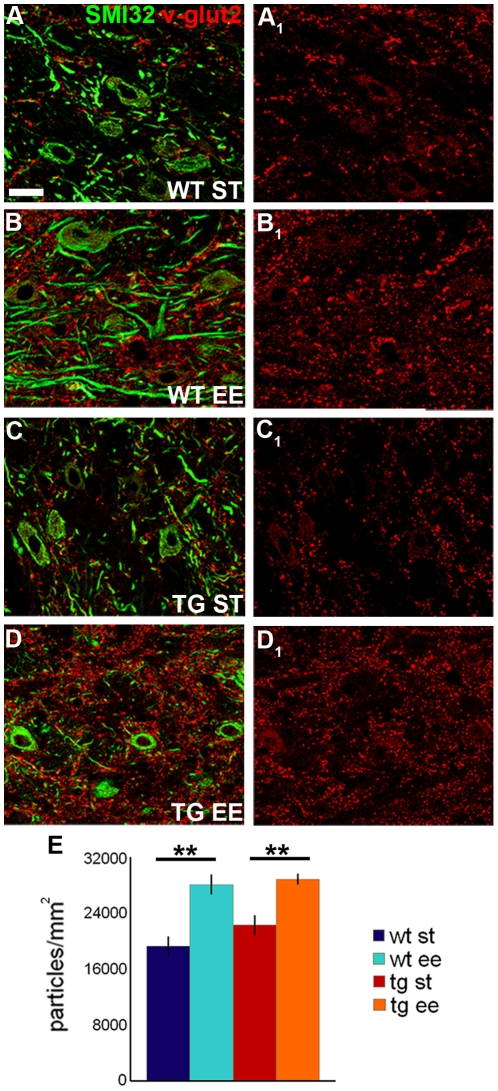
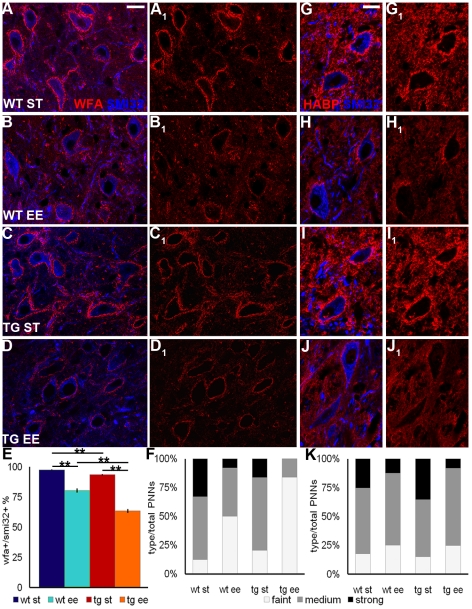
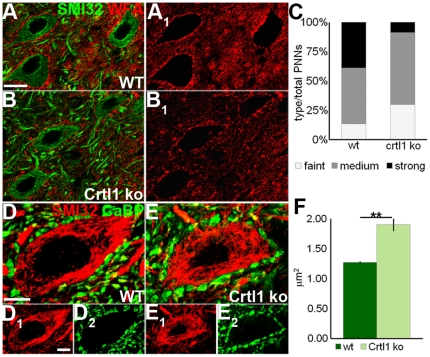
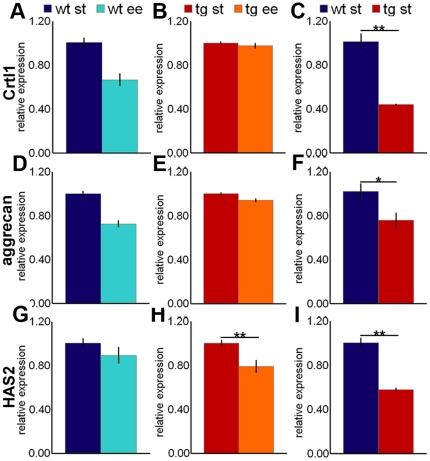
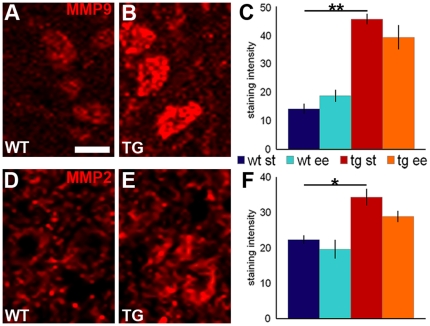
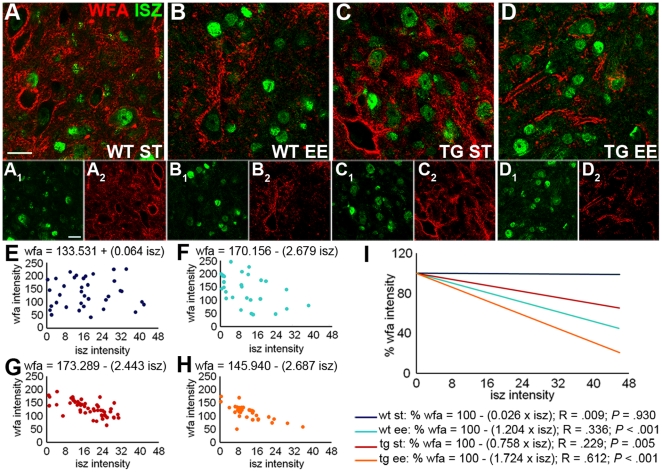
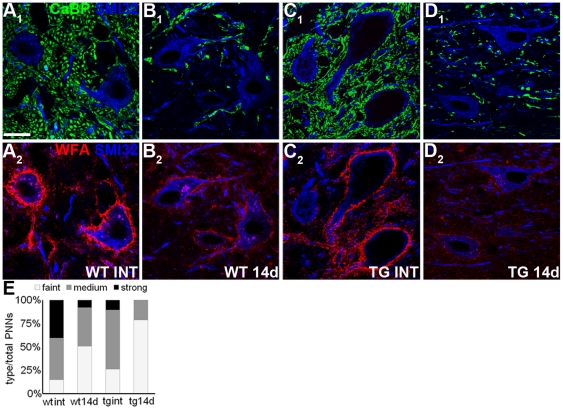
Structural remodeling or repair of neural circuits depends on the balance between intrinsic neuronal properties and regulatory cues present in the surrounding microenvironment. These processes are also influenced by experience, but it is still unclear how external stimuli modulate growth-regulatory mechanisms in the central nervous system. We asked whether environmental stimulation promotes neuronal plasticity by modifying the expression of growth-inhibitory molecules, specifically those of the extracellular matrix. We examined the effects of an enriched environment on neuritic remodeling and modulation of perineuronal nets in the deep cerebellar nuclei of adult mice. Perineuronal nets are meshworks of extracellular matrix that enwrap the neuronal perikaryon and restrict plasticity in the adult CNS. We found that exposure to an enriched environment induces significant morphological changes of Purkinje and precerebellar axon terminals in the cerebellar nuclei, accompanied by a conspicuous reduction of perineuronal nets. In the animals reared in an enriched environment, cerebellar nuclear neurons show decreased expression of mRNAs coding for key matrix components (as shown by real time PCR experiments), and enhanced activity of matrix degrading enzymes (matrix metalloproteinases 2 and 9), which was assessed by in situ zymography. Accordingly, we found that in mutant mice lacking a crucial perineuronal net component, cartilage link protein 1, perineuronal nets around cerebellar neurons are disrupted and plasticity of Purkinje cell terminal is enhanced. Moreover, all the effects of environmental stimulation are amplified if the afferent Purkinje axons are endowed with enhanced intrinsic growth capabilities, induced by overexpression of GAP-43. Our observations show that the maintenance and growth-inhibitory function of perineuronal nets are regulated by a dynamic interplay between pre- and postsynaptic neurons. External stimuli act on this interaction and shift the balance between synthesis and removal of matrix components in order to facilitate neuritic growth by locally dampening the activity of inhibitory cues.
Overview
The claims and statistics of this paper haven’t been checked yet.
Run the check — free, no account needed. It reads the open-access text and checks the sources it cites.
Integrity signals
Registry
Cites
Statistics
Figures
Verification
Claims the paper makes
The claims and statistics of this paper haven’t been checked yet.
Run the check — free, no account needed. It reads the open-access text and checks the sources it cites.
Claims other papers make about this one
Each is checked against this paper’s own text: does it say what the citing paper says it does?
In the citing paper
“In this model, decreased synthesis of Hapln1/Crtl1 and other PNN components is observed, suggesting that external stimuli may have a plasticity-permissive role by affecting the synthesis of link proteins (Foscarin et al., 2011).”
From The hyaluronan and proteoglycan link proteins: Organizers of the brain extracellular matrix and key molecules for neuronal function and plasticity (2015) · cites this paper as Foscarin et al., 2011
In the citing paper
“Indeed, structural changes found after enriched environment, such as an enlargement of Purkinje axon boutons, are also observed in Hapln1/Crtl1 mice (Foscarin et al., 2011).”
From The hyaluronan and proteoglycan link proteins: Organizers of the brain extracellular matrix and key molecules for neuronal function and plasticity (2015) · cites this paper as Foscarin et al., 2011
In the citing paper
“In this model, decreased synthesis of Hapln1/Crtl1 and other PNN components is observed, suggesting that external stimuli may have a plasticity-permissive role by affecting the synthesis of link proteins (Foscarin et al., 2011).”
From The hyaluronan and proteoglycan link proteins: Organizers of the brain extracellular matrix and key molecules for neuronal function and plasticity (2015) · cites this paper as Foscarin et al., 2011
In the citing paper
“Enriched environment also promotes structural plasticity in the cerebellum, which is accompanied by a strong PNN reduction and a putative increase in the excitatory/inhibitory ratio.”
From The hyaluronan and proteoglycan link proteins: Organizers of the brain extracellular matrix and key molecules for neuronal function and plasticity (2015) · cites this paper as Foscarin et al., 2011
In the citing paper
“enriched environment rearing reduces PNNs in the cerebellum (32)”
From Perineuronal nets, inhibitory interneurons and anxiety-related ventral hippocampal neuronal oscillations are altered by early life adversity (2019) · cites this paper as [32]
Self-check
Percentages, sums and reported differences re-computed from the paper’s own numbers.
The self-check needs the paper’s full text.
Citations
Cites
Analysis of Relative Gene Expression Data Using Real-Time Quantitative PCR and the 2−ΔΔCT Method
Livak, K. J., & Schmittgen, T. D. (2001) · Methods · doi:10.1006/meth.2001.1262 · Cited by 180,860
Estimation of nuclear population from microtome sections
Abercrombie, M. (1946) · The Anatomical Record · doi:10.1002/ar.1090940210 · Cited by 4,363
Enriched environments, experience-dependent plasticity and disorders of the nervous system
Nithianantharajah, J., & Hannan, A. J. (2006) · Nature Reviews Neuroscience · doi:10.1038/nrn1970 · Cited by 1,771
Reactivation of Ocular Dominance Plasticity in the Adult Visual Cortex
Pizzorusso, T., Medini, P., Berardi, N., Chierzi, S., Fawcett, J. W., & Maffei, L. (2002) · Science · doi:10.1126/science.1072699 · Cited by 1,679
Recovery of learning and memory is associated with chromatin remodelling
Fischer, A., Sananbenesi, F., Wang, X., Dobbin, M., & Tsai, L.-H. (2007) · Nature · doi:10.1038/nature05772 · Cited by 1,227
E. coli RNA polymerase interacts homologously with two different promoters
Siebenlist, U. K. (1980) · Cell · doi:10.1016/0092-8674(80)90613-3 · Cited by 908
Perineuronal Nets Protect Fear Memories from Erasure
Gogolla, N., Caroni, P., Lüthi, A., & Herry, C. (2009) · Science · doi:10.1126/science.1174146 · Cited by 760
Experience-driven plasticity of visual cortex limited by myelin and nogo receptor
McGee, A. W., Yang, Y., Fischer, Q. S., Daw, N. W., & Strittmatter, S. M. (2005) · Science · doi:10.1126/science.1114362 · Cited by 643
Aigner, L., Arber, S., Kapfhammer, J. P., Laux, T., Schneider, C., Botteri, F. M., Brenner, H.-R., & Caroni, P. (1995) · Cell · doi:10.1016/0092-8674(95)90168-x · Cited by 615
Effects of environmental enrichment on gene expression in the brain
Rampon, C., Jiang, C. H., Dong, H., Tang, Y., Lockhart, D. J., Schultz, P. G., Tsien, J. Z., & Hu, Y. (2000) · Proceedings of the National Academy of Sciences · doi:10.1073/pnas.97.23.12880 · Cited by 614
Cited by
Sorted by citations
The roles of perineuronal nets and the perinodal extracellular matrix in neuronal function
Fawcett, J. W., Oohashi, T., & Pizzorusso, T. (2019) · Nature Reviews Neuroscience · doi:10.1038/s41583-019-0196-3 · Cited by 589
Structural plasticity upon learning: regulation and functions
Caroni, P., Donato, F., & Muller, D. (2012) · Nature Reviews Neuroscience · doi:10.1038/nrn3258 · Cited by 491
Environmental influences on the pace of brain development
Tooley, U. A., Bassett, D. S., & Mackey, A. P. (2021) · Nature reviews. Neuroscience · doi:10.1038/s41583-021-00457-5 · Cited by 488
Extracellular matrix and perineuronal nets in CNS repair
Kwok, J. C. F., Dick, G., Wang, D., & Fawcett, J. W. (2011) · Developmental Neurobiology · doi:10.1002/dneu.20974 · Cited by 395
The perineuronal net and the control of CNS plasticity
Wang, D., & Fawcett, J. (2012) · Cell and Tissue Research · doi:10.1007/s00441-012-1375-y · Cited by 373
Metadata
- Authors
- Foscarin, S., Ponchione, D., Pajaj, E., Leto, K., Gawlak, M., Wilczynski, G. M., Rossi, F., & Carulli, D.
- Affiliations
- Neuroscience Institute Cavalieri Ottolenghi (IT)
- Instytut Biologii Doświadczalnej im. Marcelego Nenckiego (PL)
- Corresponding author
- Rossi, Ferdinando
- Venue
- PLoS ONE
- Publisher
- Public Library of Science (PLoS)
- Published
- 2011-01-31
- Volume
- 6
- Issue
- 1
- Pages
- e16666
- ISSN
- 1932-6203 (ISSN-L)
- PMC
- PMC3031615
- OpenAlex
- W2023333383
- Cited by
- 128
- References
- 56
- Citations by year
- 2026: 3 · 2025: 6 · 2024: 15 · 2023: 5 · 2022: 7 · 2021: 10 · 2020: 8 · 2019: 7 · 2018: 8 · 2017: 9 · 2016: 10 · 2015: 9 · 2014: 10 · 2013: 9 · 2012: 7
- FWCI
- 4.10
- Type
- journal article
- Language
- en
- Open access
- gold
- doi.org
- Locations
- PLoS ONE (publishedVersion, cc-by)
- PubMed Central (publishedVersion, cc-by)
- PubMed (publishedVersion)
- Institutional Research Information System University of Turin (University of Turin) (submittedVersion, other-oa)
- DOAJ (DOAJ: Directory of Open Access Journals) (submittedVersion, cc-by-sa)
- Figshare (submittedVersion, cc-by)
- Funders
- International Foundation for Research in Paraplegia
- Ministero dell’Istruzione, dell’Università e della Ricerca
- Regione Piemonte
- Topics
- Life Sciences › Neuroscience › Cellular and Molecular Neuroscience › Neuroscience and Neuropharmacology Research
- Life Sciences › Neuroscience › Developmental Neuroscience › Neurogenesis and neuroplasticity mechanisms
- Life Sciences › Neuroscience › Cellular and Molecular Neuroscience › Nerve injury and regeneration
- Keywords
- experience-dependent plasticity, perineuronal nets, extracellular matrix, environmental enrichment, deep cerebellar nuclei, Purkinje cells, matrix metalloproteinases, GAP-43, growth inhibition, neural circuit remodeling, postsynaptic modulation
- MeSH terms
- Animals, Central Nervous System, Cerebellar Nuclei, Extracellular Matrix, Nerve Tissue Proteins, Neuronal Plasticity, Purkinje Cells, Synapses, Neurites, GAP-43 Protein, Mice
About these checks
Registry, retraction, Cites and statistics results are computed, not judged, with one exception: a printed reference that no index lists is read once by a model before it counts as a citation error. Claims are extracted by a model and kept only when their quote appears verbatim in the text; each cited source is then checked, with a model’s help, for whether it says what the claim relies on. Those verdicts can be wrong — read the claim’s quote and the cited source before relying on one.
Statistics and arithmetic are recomputed, not judged.
Confidence bands are shown only for fields calibrated on our annotated test set. None is calibrated yet, so no band is shown.
What counts as a claim ›How we measure confidence ›How we check this ›
Are you an author, or do you see a problem with this page? Request a review
