

The DOI matches its Crossref record; 55 of the 55 references it cites were found in a registry or an index; none of the 56 sources its claims cite is checked for support yet.
Y-Chromosome Variation in Altaian Kazakhs Reveals a Common Paternal Gene Pool for Kazakhs and the Influence of Mongolian Expansions
Open accessAbstract
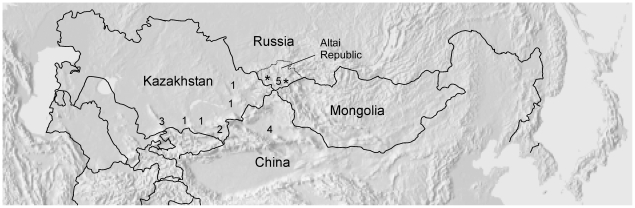
Kazakh populations have traditionally lived as nomadic pastoralists that seasonally migrate across the steppe and surrounding mountain ranges in Kazakhstan and southern Siberia. To clarify their population history from a paternal perspective, we analyzed the non-recombining portion of the Y-chromosome from Kazakh populations living in southern Altai Republic, Russia, using a high-resolution analysis of 60 biallelic markers and 17 STRs. We noted distinct differences in the patterns of genetic variation between maternal and paternal genetic systems in the Altaian Kazakhs. While they possess a variety of East and West Eurasian mtDNA haplogroups, only three East Eurasian paternal haplogroups appear at significant frequencies (C3*, C3c and O3a3c*). In addition, the Y-STR data revealed low genetic diversity within these lineages. Analysis of the combined biallelic and STR data also demonstrated genetic differences among Kazakh populations from across Central Asia. The observed differences between Altaian Kazakhs and indigenous Kazakhs were not the result of admixture between Altaian Kazakhs and indigenous Altaians. Overall, the shared paternal ancestry of Kazakhs differentiates them from other Central Asian populations. In addition, all of them showed evidence of genetic influence by the 13(th) century CE Mongol Empire. Ultimately, the social and cultural traditions of the Kazakhs shaped their current pattern of genetic variation.
Overview
CoChat Summary
Written by AI from the paper’s full text.
TL;DR
High-resolution Y-chromosome analysis of Altaian Kazakhs shows low paternal diversity dominated by three East Eurasian haplogroups, with a shared paternal ancestry among Kazakh populations and evidence of 13th-century CE Mongol influence. The study argues that Kazakh social structure, patrilineal descent, and social selection helped shape this paternal gene pool.
Key findings
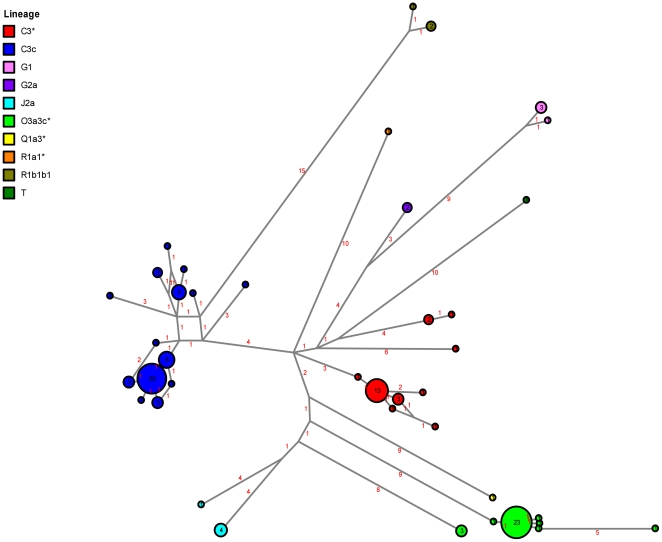
- About 85% of Altaian Kazakh Y-chromosomes belonged to only three haplogroups: C3* (20.2%), C3c (39.5%), and O3a3c* (26.1%).
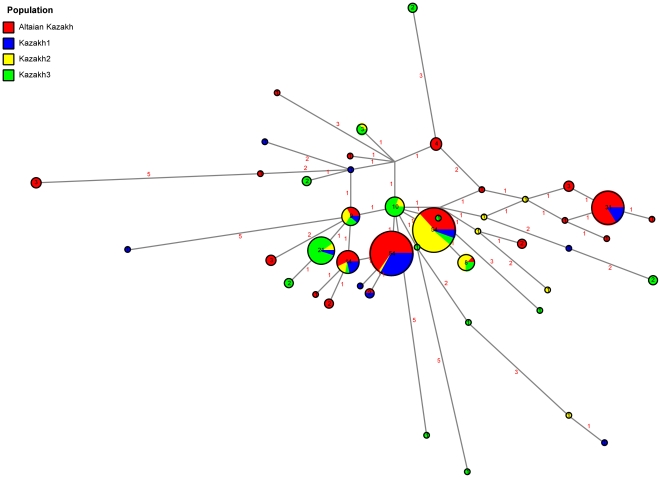
- Among 119 Altaian Kazakh males, 51 Y-STR haplotypes were identified, but only two haplotypes were shared between the SW and SE Altai regions; reduced 5-STR analysis still showed significant differentiation (RST = 0.091; p = 0.005).
- Altaian Kazakhs shared a common paternal ancestry with indigenous Kazakhs, but differed in haplogroup frequencies: C3c was 39.5% in Altaian Kazakhs versus 57.4% in indigenous Kazakh1, while O3a3c* was 26% versus 9%.
- Coalescence estimates using pedigree mutation rates placed C3* and C3c at roughly 800 years ago, consistent with Mongol Empire expansion, while O3a3c* had a more recent TMRCA of approximately 400 years ago; the most frequent shared haplotype fell into the Genghis Khan haplotype cluster.
Methods
- Blood samples from 119 unrelated male Altaian Kazakhs were collected from four locations in two regions of the Altai Republic, Russia, during field expeditions between 1991 and 2002.
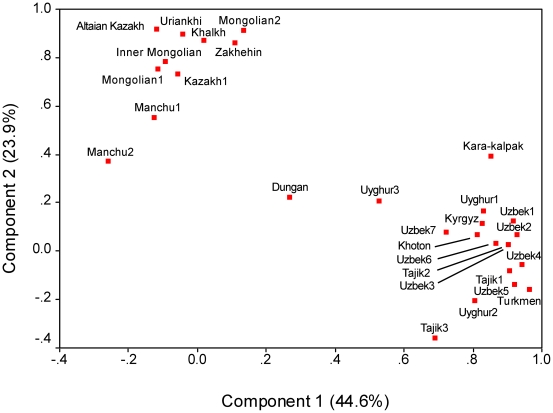
- The non-recombining Y-chromosome was characterized with 60 biallelic markers and 17 STRs, then compared with published Central Asian and Mongolian population data using reduced 14-haplogroup and 5- or 6-STR profiles.
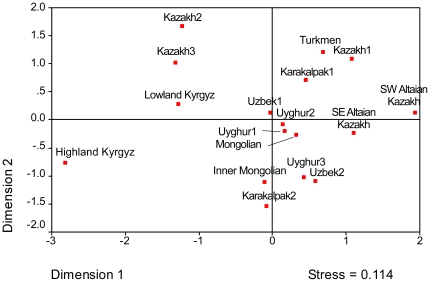
- Analyses included haplotype diversity, RST, PCA, MDS, AMOVA, median-joining networks, rho statistics, and Batwing coalescent dating.
Limitations
- The paper states that the SW Altaian Kazakh sample was relatively small, so interpretations about its higher diversity and possible admixture should be cautious.
- The paper cautions that Y-STR coalescence estimates depend on mutation-rate choice, have broad confidence intervals, and cannot precisely pinpoint lineage origins; it also notes possible sampling effects and calls for comprehensive sampling across Kazakhstan and Xinjiang.
- Evident from the text: comparisons required reducing high-resolution data to 14 haplogroup clusters and 5–6 STR loci, which limits resolution relative to the full 60-marker/17-STR dataset.
Model-written summary. Check it against the paper before relying on it.
Integrity signals
Registry
Cites
Statistics
Figures
Verification
Claims the paper makes
85 Own result · 43 Own interpretation · 15 Not checked yet · 13 No full text of the sources · 8 Check pending · 4 Own method
A result the paper reports from its own data — it cites no other source for it, so there is none to check. The quote shows it is in the paper.
In the paper
“Analysis of the combined biallelic and STR data also demonstrated genetic differences among Kazakh populations from across Central Asia.”
§ Y-Chromosome Variation in Altaian Kazakhs Reveals a Common Paternal Gene Pool for Kazakhs and the Influence of Mongolian Expansions > Abstract
boostedstates an association- Asserted: passes — The authors put it forward as true.
- Checkable: passes — It can be checked against evidence.
- Load-bearing: passes — The paper’s conclusions depend on it.
- Based: passes — The paper gives a reason why it holds.
A result the paper reports from its own data — it cites no other source for it, so there is none to check. The quote shows it is in the paper.
In the paper
“Some 85% of the Altaian Kazakh Y-chromosomes belonged to one of only three haplogroups ( Table 1 ).”
§ Y-Chromosome Variation in Altaian Kazakhs Reveals a Common Paternal Gene Pool for Kazakhs and the Influence of Mongolian Expansions > Results > Kazakh Haplogroup Diversity
plain- Asserted: passes — The authors put it forward as true.
- Checkable: passes — It can be checked against evidence.
- Load-bearing: passes — The paper’s conclusions depend on it.
- Based: passes — The paper gives a reason why it holds.
In the paper
“Comparisons of paternal haplogroup frequencies with Kazakhs sampled from four locations in eastern Kazakhstan (indigenous Kazakh) [10] revealed a pattern consistent with that seen in the Altaian Kazakhs ( Table 2 ).”
§ Y-Chromosome Variation in Altaian Kazakhs Reveals a Common Paternal Gene Pool for Kazakhs and the Influence of Mongolian Expansions > Results > Kazakh Haplogroup Diversity
What the sources say
- Not checked yetcites [10] RS Wells, 2001, The Eurasian heartland: a continental perspective on Y-chromosome diversity., Proc Natl Acad Sci U S A source
plainstates an association- Asserted: passes — The authors put it forward as true.
- Checkable: passes — It can be checked against evidence.
- Load-bearing: passes — The paper’s conclusions depend on it.
- Based: passes — The paper gives a reason why it holds.
A result the paper reports from its own data — it cites no other source for it, so there is none to check. The quote shows it is in the paper.
In the paper
“only three East Eurasian paternal haplogroups appear at significant frequencies (C3*, C3c and O3a3c*).”
§ Y-Chromosome Variation in Altaian Kazakhs Reveals a Common Paternal Gene Pool for Kazakhs and the Influence of Mongolian Expansions > Abstract
hedged- Asserted: passes — The authors put it forward as true.
- Checkable: passes — It can be checked against evidence.
- Load-bearing: passes — The paper’s conclusions depend on it.
- Based: passes — The paper gives a reason why it holds.
A result the paper states — it cites no source for it, so there is none to check. The quote shows it is in the paper.
In the paper
“The observed differences between Altaian Kazakhs and indigenous Kazakhs were not the result of admixture between Altaian Kazakhs and indigenous Altaians.”
§ Y-Chromosome Variation in Altaian Kazakhs Reveals a Common Paternal Gene Pool for Kazakhs and the Influence of Mongolian Expansions > Abstract
plain- Asserted: passes — The authors put it forward as true.
- Checkable: passes — It can be checked against evidence.
- Load-bearing: passes — The paper’s conclusions depend on it.
- Based: passes — The paper gives a reason why it holds.
- It may state two separate claims as one. 47
- Probably not a substantial claim. 23
Create a free account to see these claims.
Create a free account to see these assumptions.
98 more claims
Create a free account to see all 168 claims and to verify the 31 references still open.
Claims other papers make about this one
Each is checked against this paper’s own text: does it say what the citing paper says it does?
In the citing paper
“In contrast, C3* (C2-F1918) and other branches of C2 are found at moderate to high frequencies in all Mongolic-, Turkic-, and Tungusic-speaking populations in Central Eurasia, East Asia, and Siberia (16, 65, 68).”
From Genomes of the Golden Horde elites and their implications for the rulers of the Mongol Empire (2026) · cites this paper as [68]
In the citing paper
“strongly suggest a close association between the Y haplotype R1b-M343 and the past Mongol Empire (Fig 3) [42–44, 49–53].”
From Molecular Genealogy of a Mongol Queen’s Family and Her Possible Kinship with Genghis Khan (2016) · cites this paper as [53]
In the citing paper
“Eastern Russian Tatars, Bashkirs, and Pakistani Hazara were found to carry R1b-M343 at unusually high frequencies of 12.65%, 46.07%, and 32%, respectively, compared to other regions of Eastern Asia, which rarely have this haplotype”
From Molecular Genealogy of a Mongol Queen’s Family and Her Possible Kinship with Genghis Khan (2016) · cites this paper as [53]
In the citing paper
“It has been found recently that Kazakhs do not share a common paternal source (Dulik et al. 2011).”
From The Y-chromosome C3* Star-Cluster Attributed to Genghis Khan's Descendants is Present at High Frequency in the Kerey Clan from Kazakhstan (2012) · cites this paper as Dulik et al. 2011
In the citing paper
“It is possible that differences between sample sets of Kazakhs were mostly maintained by their tribal affiliations, because Kazakh society is characterized by a complex tribal structure (Dulik et al. 2011).”
From The Y-chromosome C3* Star-Cluster Attributed to Genghis Khan's Descendants is Present at High Frequency in the Kerey Clan from Kazakhstan (2012) · cites this paper as Dulik et al. 2011
1 more claim about this paper
Create a free account to see every claim other papers make about this one.
Self-check
Percentages, sums and reported differences re-computed from the paper’s own numbers.
Each contradiction between two passages listed here was confirmed by an independent check.
Rated minor: it would not touch a result — a value no result rests on, a p-value that stays on the same side of the significance level, or a conflict that is clerical, resolved elsewhere in the paper, or outside its own findings.
In the paper
§ Y-Chromosome Variation in Altaian Kazakhs Reveals a Common Paternal Gene Pool for Kazakhs and the Influence of Mongolian Expansions > Results > Central Asian NRY Diversity
“About 12.8% of the variation was explained in the “among population within group” for the language and geography categories, with non-significant values for the “among group” category.”
§ Y-Chromosome Variation in Altaian Kazakhs Reveals a Common Paternal Gene Pool for Kazakhs and the Influence of Mongolian Expansions > Results > Central Asian NRY Diversity
“| Geography | | | | Among group | -0.29 | 0.412±0.002 | | Between population within group | 13.29 | 0 |”
Rated minor: it would not touch a result — a value no result rests on, a p-value that stays on the same side of the significance level, or a conflict that is clerical, resolved elsewhere in the paper, or outside its own findings.
In the paper
§ Y-Chromosome Variation in Altaian Kazakhs Reveals a Common Paternal Gene Pool for Kazakhs and the Influence of Mongolian Expansions > Results > Central Asian NRY Diversity
“This split resulted in an increase to 7.1% “among group” and a decrease to 4.1% for “among population within group.””
§ Y-Chromosome Variation in Altaian Kazakhs Reveals a Common Paternal Gene Pool for Kazakhs and the Influence of Mongolian Expansions > Results > Central Asian NRY Diversity
“| Ethnicity (Modified) | | | | Among group | 7.12 | 0.002±0.0001 | | Between population within group | 3.61 | 0 |”
Rated minor: it would not touch a result — a value no result rests on, a p-value that stays on the same side of the significance level, or a conflict that is clerical, resolved elsewhere in the paper, or outside its own findings.
In the paper
§ Y-Chromosome Variation in Altaian Kazakhs Reveals a Common Paternal Gene Pool for Kazakhs and the Influence of Mongolian Expansions > Results > Kazakh Haplogroup Diversity
“The SW Altaian Kazakhs had several additional haplogroups not found in the larger SE population, with three individuals having R1b1b1, two having G2a and one individual each having Q1a3*, R1a1a* and T.”
§ Y-Chromosome Variation in Altaian Kazakhs Reveals a Common Paternal Gene Pool for Kazakhs and the Influence of Mongolian Expansions > Results > Kazakh Haplogroup Diversity
“| R1a1* (xR1a1a-e) | 1 (0.033) | | 1 (0.008) |”
Rated minor: it would not touch a result — a value no result rests on, a p-value that stays on the same side of the significance level, or a conflict that is clerical, resolved elsewhere in the paper, or outside its own findings.
In the paper
§ Y-Chromosome Variation in Altaian Kazakhs Reveals a Common Paternal Gene Pool for Kazakhs and the Influence of Mongolian Expansions > Results > Kazakh Haplogroup Diversity
“In addition, N1c and I1b were not found in any Kazakh populations.”
§ Y-Chromosome Variation in Altaian Kazakhs Reveals a Common Paternal Gene Pool for Kazakhs and the Influence of Mongolian Expansions > Results > Kazakh Haplogroup Diversity
“| N1c | | 1 (0.02) |”
Rated minor: it would not touch a result — a value no result rests on, a p-value that stays on the same side of the significance level, or a conflict that is clerical, resolved elsewhere in the paper, or outside its own findings.
In the paper
§ Y-Chromosome Variation in Altaian Kazakhs Reveals a Common Paternal Gene Pool for Kazakhs and the Influence of Mongolian Expansions > Materials and Methods
“Similarly, the STR haplotypes were reduced to six loci (DYS19, DYS389I, DYS390, DYS391, DYS392, and DYS393) to permit as broad a comparison as possible.”
§ Y-Chromosome Variation in Altaian Kazakhs Reveals a Common Paternal Gene Pool for Kazakhs and the Influence of Mongolian Expansions > Results > Altaian Kazakh Haplotype Diversity
“We also reduced the 17-STR profile to a 5-STR profile (DYS389I, DYS390, DYS391, DYS392 and DYS393) to compare the Altaian Kazakh data with published data sets ( Figure 3 ).”
1 more finding
Create a free account to see every finding of this check.
Citations
Cites
Arlequin (version 3.0): An integrated software package for population genetics data analysis
Excoffier, L., Laval, G., & Schneider, S. (2005) · Evolutionary Bioinformatics · doi:10.1177/117693430500100003 · Cited by 14,265
Median-joining networks for inferring intraspecific phylogenies
Bandelt, H. J., Forster, P., & Rohl, A. (1999) · Molecular Biology and Evolution · doi:10.1093/oxfordjournals.molbev.a026036 · Cited by 11,742
New binary polymorphisms reshape and increase resolution of the human Y chromosomal haplogroup tree
Karafet, T. M., Mendez, F. L., Meilerman, M. B., Underhill, P. A., Zegura, S. L., & Hammer, M. F. (2008) · Genome Research · doi:10.1101/gr.7172008 · Cited by 710
A nomenclature system for the tree of human Y-chromosomal binary haplogroups
Consortium, T. Y. C. (2002) · Genome Research · doi:10.1101/gr.217602 · Cited by 640
Archaeology and Language: The Puzzle of Indo-European Origins
Gamble, C., & Renfrew, C. (1988) · The South African Archaeological Bulletin · doi:10.2307/3888631 · Cited by 617
The Genetic Legacy of the Mongols
Zerjal, T., Xue, Y., Bertorelle, G., Wells, R. S., Bao, W., Zhu, S., Qamar, R., Ayub, Q., Mohyuddin, A., Fu, S., et al. (2003) · The American Journal of Human Genetics · doi:10.1086/367774 · Cited by 563
Jasanoff, J. H. (1988) · Language · doi:10.2307/414577 · Cited by 532
Fenner, J. N. (2005) · American Journal of Physical Anthropology · doi:10.1002/ajpa.20188 · Cited by 508
Анатольевич, Ж. Л., Underhill, P. A., Cinnioğlu, C., Kayser, M., Morar, B., Kivisild, T., Scozzari, R., Cruciani, F., Destro‐Bisol, G., Spedini, G., et al. (2004) · The American Journal of Human Genetics · doi:10.1086/380911 · Cited by 394
The Eurasian Heartland: A continental perspective on Y-chromosome diversity
Wells, R. S., Yuldasheva, N., Ruzibakiev, R., Underhill, P. A., Evseeva, I., Blue-Smith, J., Jin, L., Su, B., Pitchappan, R., Shanmugalakshmi, S., et al. (2001) · Proceedings of the National Academy of Sciences · doi:10.1073/pnas.171305098 · Cited by 356
Cited by
Ilumäe, A.-M., Reidla, M., Chukhryaeva, M., Järve, M., Post, H., Karmin, M., Saag, L., Agdzhoyan, A., Kushniarevich, A., Litvinov, S., et al. (2016) · The American Journal of Human Genetics · doi:10.1016/j.ajhg.2016.05.025 · Cited by 134
Self-citationDulik, M. C., Zhadanov, S. I., Osipova, L. P., Askapuli, A., Gau, L., Gokcumen, O., Rubinstein, S., & Schurr, T. G. (2012) · The American Journal of Human Genetics · doi:10.1016/j.ajhg.2011.12.014 · Cited by 161
Self-citationGrugni, V., Battaglia, V., Kashani, B. H., Parolo, S., Al-Zahery, N., Achilli, A., Olivieri, A., Gandini, F., Houshmand, M., Sanati, M. H., et al. (2012) · PLoS ONE · doi:10.1371/journal.pone.0041252 · Cited by 116
Afghan Hindu Kush: Where Eurasian Sub-Continent Gene Flows Converge
Di Cristofaro, J., Pennarun, E., Mazières, S., Myres, N. M., Lin, A. A., Temori, S. A., Metspalu, M., Metspalu, E., Witzel, M., King, R. J., et al. (2013) · PLoS ONE · doi:10.1371/journal.pone.0076748 · Cited by 100
Rootsi, S., Myres, N. M., Lin, A. A., Järve, M., King, R. J., Kutuev, I., Cabrera, V. M., Khusnutdinova, E. K., Varendi, K., Sahakyan, H., et al. (2012) · European Journal of Human Genetics · doi:10.1038/ejhg.2012.86 · Cited by 79
Y-chromosome diversity in the Kalmyks at the ethnical and tribal levels
Malyarchuk, B., Derenko, M., Denisova, G., Khoyt, S., Woźniak, M., Grzybowski, T., & Zakharov, I. (2013) · Journal of Human Genetics · doi:10.1038/jhg.2013.108 · Cited by 19
Genomic Analysis of Natural Selection and Phenotypic Variation in High-Altitude Mongolians
Xing, J., Wuren, T., Simonson, T. S., Watkins, W. S., Witherspoon, D. J., Wu, W., Ga, Q., Huff, C. D., Jorde, L. B., & Ge, R.-L. (2013) · PLoS Genetics · doi:10.1371/journal.pgen.1003634 · Cited by 63
Taiwan Y-chromosomal DNA variation and its relationship with Island Southeast Asia
Tréjaut, J., Poloni, E. S., Yen, J.-C., Lai, Y., Loo, J.-H., Lee, C.-L., He, C.-L., & Lin, M. (2014) · BMC Genetics · doi:10.1186/1471-2156-15-77 · Cited by 63
Global agronomy, a new field of research. A review
Makowski, D., Nesme, T., Papy, F., & Doré, T. (2013) · Agronomy for Sustainable Development · doi:10.1007/s13593-013-0179-0 · Cited by 57
Abilev, S., Malyarchuk, B., Derenko, M., Wozniak, M., Grzybowski, T., & Zakharov, I. (2012) · Human Biology · doi:10.3378/027.084.0106 · Cited by 56
Genetic polymorphism of 17 Y chromosomal STRs in Kazakh and Uighur populations from Xinjiang, China
Shan, W., Ablimit, A., Zhou, W., Zhang, F., Ma, Z., & Zheng, X. (2014) · International Journal of Legal Medicine · doi:10.1007/s00414-013-0948-y · Cited by 52
Schurr, T. G., Dulik, M. C., Owings, A. C., Zhadanov, S. I., Gaieski, J. B., Vilar, M. G., Ramos, J., Moss, M. B., & Natkong, F. (2012) · American Journal of Physical Anthropology · doi:10.1002/ajpa.22068 · Cited by 42
Self-citationAnalysis of genetic admixture in Uyghur using the 26 Y-STR loci system
Bian, Y., Zhang, S., Zhou, W. L., Zhao, Q., Siqintuya, Zhu, R., Wang, Z., Gao, Y., Hong, J., Lu, D., et al. (2016) · Scientific Reports · doi:10.1038/srep19998 · Cited by 40
The Connection of the Genetic, Cultural and Geographic Landscapes of Transoxiana
Zhabagin, M., Balanovska, E., Sabitov, Z., Kuznetsova, M., Agdzhoyan, A., Balaganskaya, O., Chukhryaeva, M., Markina, N., Romanov, A., Skhalyakho, R., et al. (2017) · Scientific Reports · doi:10.1038/s41598-017-03176-z · Cited by 39
Sex‐specific genetic diversity is shaped by cultural factors in Inner Asian human populations
Marchi, N., Hegay, T., Mennecier, P., Georges, M., Laurent, R., Whitten, M., Endicott, P., Aldashev, A., Dorzhu, C., Nasyrova, F., et al. (2017) · American Journal of Physical Anthropology · doi:10.1002/ajpa.23151 · Cited by 38
Zhabagin, M., Sarkytbayeva, A., Tazhigulova, I., Yerezhepov, D., Li, S., Akilzhanov, R., Yeralinov, A., Sabitov, Z., & Akilzhanova, A. (2019) · International Journal of Legal Medicine · doi:10.1007/s00414-018-1859-8 · Cited by 28
Mitochondrial and Y-chromosomal profile of the Kazakh population from East Kazakhstan
Tarlykov, P., Zholdybayeva, E. V., Akilzhanova, A. R., Abilova, Z., Sabitov, Z. M., Rakhypbekov, T. K., & Ramanculov, E. M. (2013) · Croatian Medical Journal · doi:10.3325/cmj.2013.54.17 · Cited by 36
Dispersals of the Siberian Y-chromosome haplogroup Q in Eurasia
Huang, Y.-Z., Pamjav, H., Flegontov, P., Stenzl, V., Wen, S.-Q., Tong, X.-Z., Wang, C.-C., Wang, L.-X., Wei, L.-H., Gao, J.-Y., et al. (2018) · Molecular Genetics and Genomics · doi:10.1007/s00438-017-1363-8 · Cited by 34
Adnan, A., Rakha, A., Kasim, K., Noor, A., Nazir, S., Hadi, S. S., & Pang, H. (2018) · International Journal of Legal Medicine · doi:10.1007/s00414-018-1962-x · Cited by 32
Genetic landscape of populations along the Silk Road: admixture and migration patterns
Mezzavilla, M., Vozzi, D., Pirastu, N., Girotto, G., D’Adamo, P., Gasparini, P., & Colonna, V. (2014) · BMC Genetics · doi:10.1186/s12863-014-0131-6 · Cited by 31
Liu, Y.-S., Meng, H., Mei, T., Zhang, L.-P., Chen, J., Zhang, Y.-D., Chen, J., Guo, Y., Dong, Q., Yan, J., et al. (2016) · Gene · doi:10.1016/j.gene.2016.11.018 · Cited by 29
Y-SNP L1034: limited genetic link between Mansi and Hungarian-speaking populations
Fehér, T., Németh, E., Vándor, A., Корниенко, И. В., Csáji, L. K., & Pamjav, H. (2014) · Molecular Genetics and Genomics · doi:10.1007/s00438-014-0925-2 · Cited by 29
Wang, C., Wang, L.-X., Shrestha, R., Wen, S., Zhang, M., Tong, X.-Z., Li, J., & Li, H. (2015) · Journal of genetics and genomics/Journal of Genetics and Genomics · doi:10.1016/j.jgg.2015.03.008 · Cited by 29
Tracing Human Movements from Siberia to the Americas: Insights from Genetic Studies
Schurr, T. G. (2015) · Springer eBooks · doi:10.1007/978-3-319-15138-0_4 · Cited by 28
Self-citationMolecular Genealogy of a Mongol Queen’s Family and Her Possible Kinship with Genghis Khan
Lkhagvasuren, G., Shin, H., Lee, S. E., Tumen, D., Kim, J.-H., Kim, K.-Y., Kim, K., Park, A. J., Lee, H. W., Kim, M. J., et al. (2016) · PLOS ONE · doi:10.1371/journal.pone.0161622 · Cited by 19
Liu, B., Ma, P., Wang, C., Yan, S. L., Yao, H., Li, Y., Xie, Y., Meng, S., Sun, J., Cai, Y., et al. (2020) · American Journal of Human Biology · doi:10.1002/ajhb.23462 · Cited by 18
Zhabagin, M., Wei, L.-H., Sabitov, Z., Ma, P.-C., Sun, J., Dyussenova, Z., Balanovska, E., Li, H., & Ramankulov, Y. (2022) · Genes · doi:10.3390/genes13101776 · Cited by 17
Wu, R., Li, R., Wang, N., Peng, D., Li, H., Zhang, Y., Zheng, C., & Sun, H. (2019) · Forensic Science International Genetics · doi:10.1016/j.fsigen.2019.07.017 · Cited by 17
Medieval Super-Grandfather founder of Western Kazakh Clans from Haplogroup C2a1a2-M48
Zhabagin, M., Sabitov, Z., Tazhigulova, I., Alborova, I., Agdzhoyan, A., Wei, L.-H., Urasin, V., Koshel, S., Mustafin, K., Akilzhanova, A., et al. (2021) · Journal of Human Genetics · doi:10.1038/s10038-021-00901-5 · Cited by 16
Refined phylogenetic structure of an abundant East Asian Y-chromosomal haplogroup O*-M134
Ning, C., Yan, S. L., Hu, K., Cui, Y., & Li, J. (2015) · European Journal of Human Genetics · doi:10.1038/ejhg.2015.183 · Cited by 16
Decoding a highly mixed Kazakh genome
Seidualy, M., Blažytė, A., Jeon, S., Bhak, Y., Jeon, Y., Kim, J., Eriksson, A., Bolser, D. M., Yoon, C., Manica, A., et al. (2020) · Human Genetics · doi:10.1007/s00439-020-02132-8 · Cited by 15
Development and validation of a novel 29-plex Y-STR typing system for forensic application
Li, M., Zhou, W. L., Zhang, Y., Huang, L., Wang, X., Wu, J., Meng, M., Wang, H., Li, C., & Bian, Y. (2019) · Forensic Science International Genetics · doi:10.1016/j.fsigen.2019.102169 · Cited by 15
Khussainova, E., Kisselev, I., Iksan, O., Bekmanov, B., Skvortsova, L., Garshin, A., Kuzovleva, E., Zhaniyazov, Z., Zhunussova, G., Musralina, L., et al. (2022) · Frontiers in Genetics · doi:10.3389/fgene.2021.801295 · Cited by 12
Polymorphisms of HLA-DRB1, -DQA1 and -DQB1 in Inhabitants of Astana, the Capital City of Kazakhstan
Kuranov, A. B., Николаевич, В. М., Abildinova, G. Z., Akilzhanova, A. R., Iskakova, A. N., Zholdybayeva, E. V., Boldyreva, M. N., Müller, C. A., & Темиргалиевич, М. К. (2014) · PLoS ONE · doi:10.1371/journal.pone.0115265 · Cited by 13
Lee, J., & Kuang, S. (2017) · Inner Asia · doi:10.1163/22105018-12340089 · Cited by 13
Y-chromosome evidence confirmed the Kerei-Abakh origin of Aksay Kazakhs
Wen, S.-Q., Sun, C., Song, D.-L., Huang, Y.-Z., Tong, X.-Z., Meng, H.-L., Yao, H.-B., Du, P.-X., Wei, L.-H., Wang, L.-X., et al. (2020) · Journal of Human Genetics · doi:10.1038/s10038-020-0759-1 · Cited by 12
Cilli, E., Sarno, S., Gnecchi‐Ruscone, G. A., Serventi, P., Fanti, S. D., Delaini, P., Ognibene, P., Basello, G. P., Ravegnini, G., Angelini, S., et al. (2019) · American Journal of Physical Anthropology · doi:10.1002/ajpa.23789 · Cited by 12
Malyarchuk, B. A., Derenko, M., Denisova, G., Woźniak, M., Rogalla, U., Dambueva, I., & Grzybowski, T. (2016) · Journal of Human Genetics · doi:10.1038/jhg.2016.14 · Cited by 11
Boman, B., & Mussakhanova, A. (2024) · Globalisation Societies and Education · doi:10.1080/14767724.2024.2355203 · Cited by 11
Mei, T., Zhang, L., Liu, Y.-S., Chen, J., Meng, H., Yan, J., & Zhu, B. (2016) · International Journal of Legal Medicine · doi:10.1007/s00414-016-1331-6 · Cited by 10
North Asian population relationships in a global context
Kídd, K. K., Evsanaa, B., Togtokh, A., Brissenden, J. E., Roscoe, J., Dogan, M., Neophytou, P. I., Gürkan, C., Bülbül, Ö., Cherni, L., et al. (2022) · Scientific Reports · doi:10.1038/s41598-022-10706-x · Cited by 10
Brandenburg, J., Austerlitz, F., & Toupance, B. (2012) · Genetics Research · doi:10.1017/s0016672312000298 · Cited by 10
MultiWaverX: modeling latent sex-biased admixture history
Zhang, R., Ni, X., Yuan, K., Pan, Y., & Xu, S. (2022) · Briefings in Bioinformatics · doi:10.1093/bib/bbac179 · Cited by 9
Kortum, R. D. (2014) · Time and Mind · doi:10.1080/1751696x.2014.969506 · Cited by 9
Lee, J.-Y. (2016) · Études mongoles sibériennes centrasiatiques et tibétaines · doi:10.4000/emscat.2820 · Cited by 8
Petit, F., Minnai, F., Chiaroni, J., Underhill, P. A., Bailly, P., Mazières, S., & Costedoat, C. (2018) · European Journal of Human Genetics · doi:10.1038/s41431-018-0245-9 · Cited by 8
Yardumian, A., Shengelia, R., Chitanava, D., Laliashvili, S., Bitadze, L., Laliashvili, I., Villanea, F. A., Sanders, A., Azzam, A., Groner, V., et al. (2017) · American Journal of Physical Anthropology · doi:10.1002/ajpa.23324 · Cited by 7
Self-citationTariq, M. D., Ahmad, H., Hemphill, B. E., Farooq, U., & Schurr, T. G. (2022) · Scientific Reports · doi:10.1038/s41598-022-05076-3 · Cited by 6
Self-citationOn the Y-chromosome haplogroup C3c classification
Malyarchuk, B. А., Derenko, M. V., & Denisova, G. A. (2012) · Journal of Human Genetics · doi:10.1038/jhg.2012.93 · Cited by 6
Maternal and Paternal Diversity in Xinjiang Kazakh Population from China
Shan, W., Ren, Z., Wu, W., Hao, H., Abulimiti, A., Chen, K., Zhang, F., Ma, Z., & Zheng, X. (2014) · Генетика · doi:10.7868/s0016675814110149 · Cited by 6
Genomes of the Golden Horde elites and their implications for the rulers of the Mongol Empire
Askapuli, A., Kanzawa-Kiriyama, H., Kakuda, T., Kassenali, A., Yessen, S., Schamiloglu, U., Schrodi, S. J., Hawks, J., & Saitou, N. (2026) · Proceedings of the National Academy of Sciences · doi:10.1073/pnas.2531003123 · Cited by 5
Schurr, T. G., Torres, J. B., Vilar, M. G., Gaieski, J. B., & Melendez, C. (2016) · Wiley eBooks · doi:10.1002/9781118962954.ch19 · Cited by 4
Self-citationSome remarks on the Turkicisation of the Mongols in post-Mongol Central Asia and the Qipchaq Steppe
Lee, J. (2018) · Acta Orientalia · doi:10.1556/062.2018.71.2.1 · Cited by 3
Present Y Chromosomes Refute the Roma/Gypsy Origin of the Xuejiawan People in Northwest China
Wen, S., Xu, D., Yao, H., & Li, H. (2017) · Springer eBooks · doi:10.1007/978-981-10-4169-3_7 · Cited by 3
Hou, X., Zhang, X., Li, X., Huang, T., Li, W., Zhang, H., Huang, H., & Wen, Y. (2022) · Frontiers in Genetics · doi:10.3389/fgene.2022.947758 · Cited by 3
de Baca, T. C., Figueredo, A. J., Fernandes, H. B. F., & Smith‐Castro, V. (2020) · Politics and the Life Sciences · doi:10.1017/pls.2020.4 · Cited by 3
Maternal and paternal diversity in Xinjiang Kazakh population from China
Shan, W., Ren, Z., Wu, W.-J., Hao, H., Abulimiti, A., Chen, K., Zhang, F., Ma, Z., & Zheng, X. (2014) · Russian Journal of Genetics · doi:10.1134/s1022795414110143 · Cited by 2
Tao, Y., Zhou, J., Liang, L., Allen, E., Zou, Y., Huang, Z., & Li, H. (2023) · Nature anthropology · doi:10.35534/natanthropol.2023.10004 · Cited by 2
Johnson, K. M. (2023) · Oxford University Press eBooks · doi:10.1093/oxfordhb/9780198854265.013.18 · Cited by 2
Migration and Archaeological Network Research
Mills, B. J., & Peeples, M. A. (2023) · Oxford University Press eBooks · doi:10.1093/oxfordhb/9780198854265.013.36 · Cited by 2
Influence of the Silk Road Trade on the Craniofacial Morphology of Populations in Central Asia
Hinedi, A. Y. (2018) · CUNY Academic Works (City University of New York) · Cited by 2
Adamov, D., Ponomarev, G., Igor, E., Zhabagin, M. K., Maxim, B., Антоненко, А. Н., Ruslan, B., & Balanovska, E. V. (2025) · Nature anthropology · doi:10.70322/natanthropol.2025.10017 · Cited by 1
3 Human Genetic Diversity in a Global Context
Schurr, T. G. (2015) · University of Pennsylvania Museum of Archaeology and Anthropology eBooks · doi:10.9783/9781934536797.71 · Cited by 1
Self-citationKarachanak-Yankova, S., Nesheva, D. V., Galabov, A. S., & Toncheva, D. I. (2015) · Advances in Anthropology · doi:10.4236/aa.2015.54019 · Cited by 1
MtDNA CONTROL REGIONS ANALYSIS AT ETHNIC KAZAKHS
Djansugurova, L., Almaty, leylad@mail.ru, Gulnur, Z., Nurzhibek, Saltanat, A., Almira, A., Bakhytzhan, B., & Elmira, K. (2018) · SERIES OF BIOLOGICAL AND MEDICAL · doi:10.32014/2018.2518-1629.4 · Cited by 1
Secularization and the Resurgence of Religions
Boman, B. (2023) · SpringerBriefs in psychology · doi:10.1007/978-3-031-51636-8_4 · Cited by 1
AnnoTool : crowdsourcing for natural language corpus creation
Hayden, K. (2013)
Schurr, T. G. (2018) · Wiley eBooks · doi:10.1002/9781118584538.ieba0230
Self-citationThe East Asian cognitive skills advantage: myth or reality?
Boman, B. (2025) · SN Social Sciences · doi:10.1007/s43545-025-01270-y
Zheng, X., Wei, W., Wang, Y., Xu, C., Wang, S., Peng, J., Xiang, C.-J., Fan, Y., & Zhong, S. (2025) · Medicine Science and the Law · doi:10.1177/00258024251399257
Crowdsourcing for natural language corpus creation
Hayden, K. (. M. (2013) · DSpace@MIT (Massachusetts Institute of Technology)
Ivanovsky, I. D., Polyakov, S. A., Filippova, M. A., & Fesenko, D. O. (2026) · Molecular Biology · doi:10.1134/s0026893325700682
Schurr, T. G. (2026) · American Journal of Human Biology · doi:10.1002/ajhb.70360
Self-citation
Metadata
- Authors
- Dulik, M. C., Osipova, L. P., & Schurr, T. G.
- Affiliations
- University of Pennsylvania (US)
- Institute of Cytology and Genetics (RU)
- Corresponding author
- Schurr, Theodore G.
- Venue
- PLoS ONE
- Publisher
- Public Library of Science (PLoS)
- Published
- 2011-03-11
- Volume
- 6
- Issue
- 3
- Pages
- e17548
- ISSN
- 1932-6203 (ISSN-L)
- PMC
- PMC3055870
- OpenAlex
- W1990735851
- Semantic Scholar
- 2831a67b24323cff2963d1be66ed13b1076b15a0
- Cited by
- 76
- References
- 55
- Citations by year
- 2026: 3 · 2025: 3 · 2024: 1 · 2023: 4 · 2022: 6 · 2021: 1 · 2020: 4 · 2019: 3 · 2018: 8 · 2017: 7 · 2016: 8 · 2015: 5 · 2014: 8 · 2013: 7 · 2012: 7
- FWCI
- 3.61
- Type
- journal article
- Language
- en
- Open access
- gold
- doi.org
- Locations
- PLoS ONE (publishedVersion, cc-by)
- PubMed (publishedVersion)
- PubMed Central (publishedVersion, cc-by)
- ScholarlyCommons (University of Pennsylvania) (submittedVersion, other-oa)
- ScholarlyCommons (University of Pennsylvania) (submittedVersion, cc-by)
- DOAJ (DOAJ: Directory of Open Access Journals) (submittedVersion, cc-by-sa)
- Figshare (submittedVersion, cc-by)
- Funders
- National Science Foundation (0726623)
- National Geographic Society
- University of Pennsylvania
- Social Sciences and Humanities Research Council of Canada (412-2005-1004, MCRI 412-2005-1004)
- Topics
- Life Sciences › Biochemistry, Genetics and Molecular Biology › Genetics › Forensic and Genetic Research
- Life Sciences › Biochemistry, Genetics and Molecular Biology › Genetics › Genetic diversity and population structure
- Social Sciences › Arts and Humanities › History › Eurasian Exchange Networks
- Keywords
- Y-chromosome variation, Y-chromosome short tandem repeats, biallelic markers, C3c, genetic diversity, nomadic pastoralists, Altai
- MeSH terms
- Emigration and Immigration, Ethnicity, Fathers, Gene Pool, Genetics, Population, Geography, Haplotypes, Humans, Kazakhstan, Male, Mongolia, Phylogeny, Recombination, Genetic, Genetic Variation, Microsatellite Repeats, Principal Component Analysis, Chromosomes, Human, Y
About these checks
Registry, retraction, Cites and statistics results are computed, not judged, with one exception: a printed reference that no index lists is read once by a model before it counts as a citation error. Claims are extracted by a model and kept only when their quote appears verbatim in the text; each cited source is then checked, with a model’s help, for whether it says what the claim relies on. Those verdicts can be wrong — read the claim’s quote and the cited source before relying on one.
A language model drew the claims from the paper on 2026-11-12, under version 3 of the claim definition (model deepseek-v4.1-flash, prompt extract-v3).
A second model labelled each claim on 2026-11-12 (model jev-1.13-20260917, definition revision gold-guideline-v0.2).
Statistics and arithmetic are recomputed, not judged.
Confidence bands are shown only for fields calibrated on our annotated test set. None is calibrated yet, so no band is shown.
What counts as a claim ›How we measure confidence ›How we check this ›
Are you an author, or do you see a problem with this page? Request a review
