

The DOI matches its Crossref record; 65 of the 65 references it cites were found in a registry or an index.
P301S Mutant Human Tau Transgenic Mice Manifest Early Symptoms of Human Tauopathies with Dementia and Altered Sensorimotor Gating
Open accessAbstract
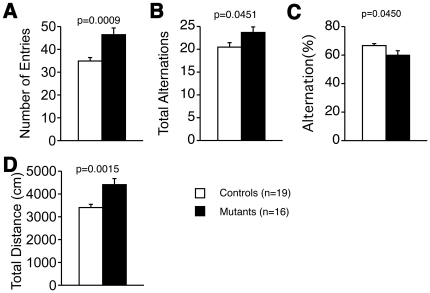
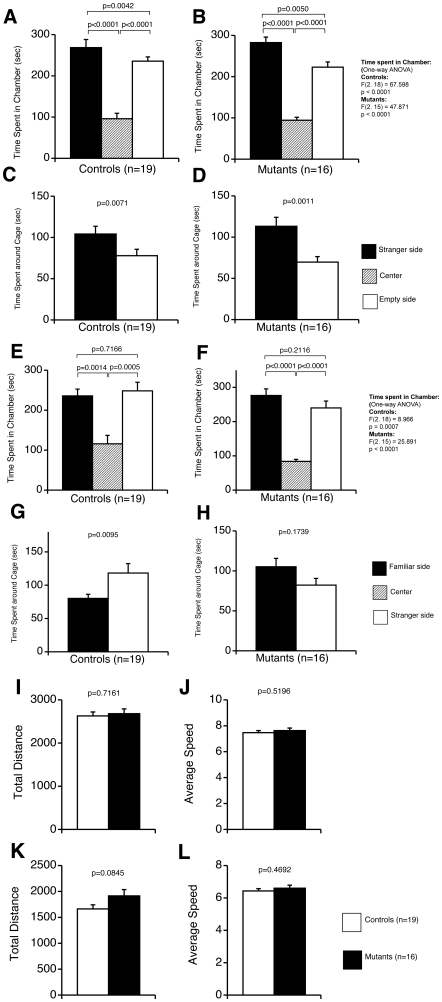
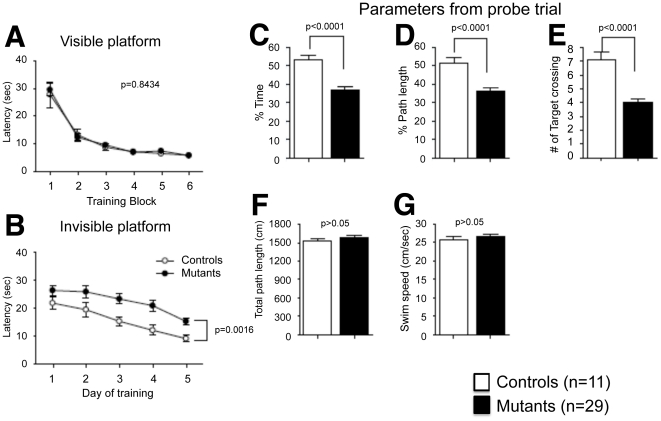
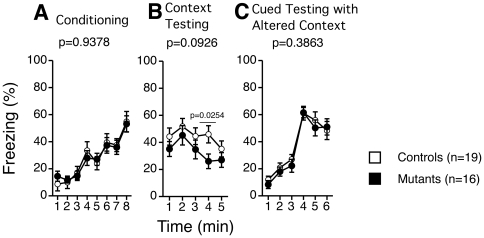
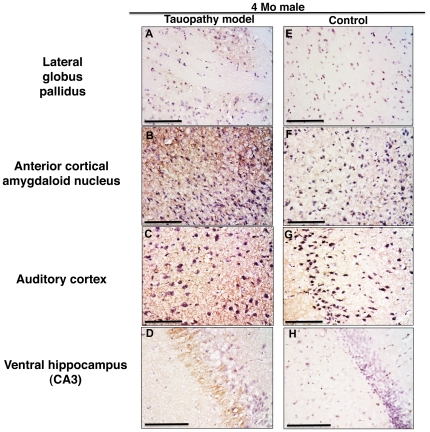
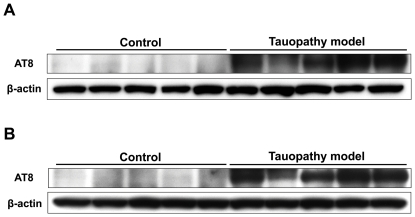
Tauopathies are neurodegenerative disorders characterized by the accumulation of abnormal tau protein leading to cognitive and/or motor dysfunction. To understand the relationship between tau pathology and behavioral impairments, we comprehensively assessed behavioral abnormalities in a mouse tauopathy model expressing the human P301S mutant tau protein in the early stage of disease to detect its initial neurological manifestations. Behavioral abnormalities, shown by open field test, elevated plus-maze test, hot plate test, Y-maze test, Barnes maze test, Morris water maze test, and/or contextual fear conditioning test, recapitulated the neurological deficits of human tauopathies with dementia. Furthermore, we discovered that prepulse inhibition (PPI), a marker of sensorimotor gating, was enhanced in these animals concomitantly with initial neuropathological changes in associated brain regions. This finding provides evidence that our tauopathy mouse model displays neurofunctional abnormalities in prodromal stages of disease, since enhancement of PPI is characteristic of amnestic mild cognitive impairment, a transitional stage between normal aging and dementia such as Alzheimer's disease (AD), in contrast with attenuated PPI in AD patients. Therefore, assessment of sensorimotor gating could be used to detect the earliest manifestations of tauopathies exemplified by prodromal AD, in which abnormal tau protein may play critical roles in the onset of neuronal dysfunctions.
Overview
The claims and statistics of this paper haven’t been checked yet.
Run the check — free, no account needed. It reads the open-access text and checks the sources it cites.
Integrity signals
Registry
Cites
Statistics
Figures
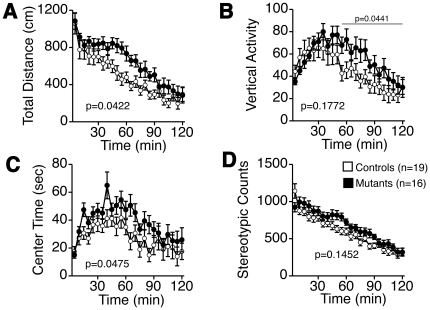
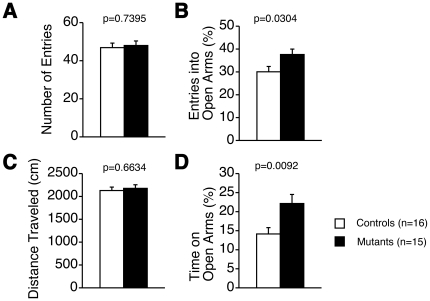
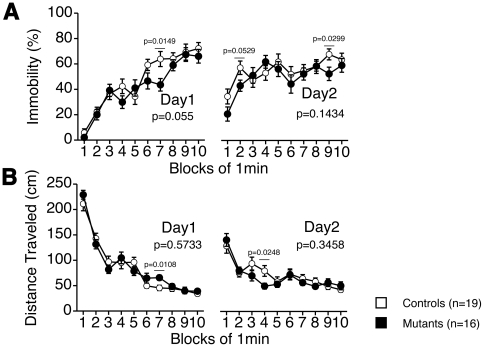
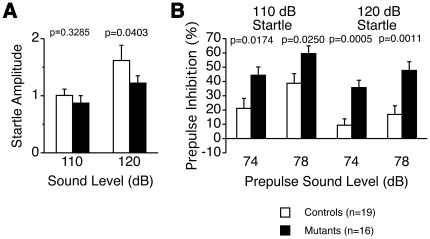
Verification
Claims the paper makes
The claims and statistics of this paper haven’t been checked yet.
Run the check — free, no account needed. It reads the open-access text and checks the sources it cites.
Claims other papers make about this one
Each is checked against this paper’s own text: does it say what the citing paper says it does?
The source backs part of the claim, not all of it — or backs it for a different population, condition or comparison.
In the citing paper
“The presence of spatial memory deficits in the PS19 line is controversial, with some studies pointing towards the development of deficits in the MWM test from a relatively young age of 5 [28] or 6.5 months [41], while others report initial deficits in spatial memory at 10 [42] or even 12 months of age [29], respectively.”
From Characterization of a Mouse Model of Alzheimer’s Disease Expressing Aβ4-42 and Human Mutant Tau (2021) · cites this paper as [28]
Experimental — accuracy not yet measuredThe source backs part of the claim, not all of it — or backs it for a different population, condition or comparison.
In the citing paper
“This is consistent with a hyperactivity phenotype in 6-month-old PS19 mice, presenting with better, albeit not statistically significant, performance on the rotarod compared to WT control animals [28].”
From Characterization of a Mouse Model of Alzheimer’s Disease Expressing Aβ4-42 and Human Mutant Tau (2021) · cites this paper as [28]
Experimental — accuracy not yet measuredThe source backs part of the claim, not all of it — or backs it for a different population, condition or comparison.
In the citing paper
“Both models rely on transgene overexpression and familial mutations (such as ADAD mutations in 5xFAD mice and frontotemporal dementia mutations in PS19 mice) and are not well suited for studying the causative events that lead to the development of pathology in sporadic AD [44–47].”
From APOE Christchurch enhances a disease-associated microglial response to plaque but suppresses response to tau pathology (2025) · cites this paper as [46]
Experimental — accuracy not yet measuredThe source backs part of the claim, not all of it — or backs it for a different population, condition or comparison.
In the citing paper
“Although behavioral and electrophysiological deficits have been reported in the PS19 line at the ages assessed in our study (Yoshiyama et al., 2007, Takeuchi et al., 2011, Briggs et al., 2017, Chalermpalanupap et al., 2018), we did not observe robust differences in spine density when PS19 mice were compared to NTG littermates.”
From Dendritic Spine Remodeling and Synaptic Tau Levels in PS19 Tauopathy Mice (2021) · cites this paper as Takeuchi et al., 2011
Experimental — accuracy not yet measured
Self-check
Percentages, sums and reported differences re-computed from the paper’s own numbers.
The self-check needs the paper’s full text.
Citations
Cites
The tail suspension test: A new method for screening antidepressants in mice
Steru, L., Chermat, R., Thierry, B., & Simon, P. (1985) · Psychopharmacology · doi:10.1007/bf00428203 · Cited by 3,534
Are the Dorsal and Ventral Hippocampus Functionally Distinct Structures?
Fanselow, M. S., & Dong, H.-W. (2010) · Neuron · doi:10.1016/j.neuron.2009.11.031 · Cited by 3,358
Synapse Loss and Microglial Activation Precede Tangles in a P301S Tauopathy Mouse Model
Yoshiyama, Y., Higuchi, M., Zhang, B., Huang, S.-M., Iwata, N., Saido, T. C., Maeda, J., Suhara, T., Trojanowski, J. Q., & Lee, V. M.-Y. (2007) · Neuron · doi:10.1016/j.neuron.2007.01.010 · Cited by 2,208
Self-citationTau-mediated neurodegeneration in Alzheimer’s disease and related disorders
Ballatore, C., Lee, V. M.-Y., & Trojanowski, J. Q. (2007) · Nature Reviews Neuroscience · doi:10.1038/nrn2194 · Cited by 2,174
Self-citationTransmission and spreading of tauopathy in transgenic mouse brain
Clavaguera, F., Bolmont, T., Crowther, R. A., Abramowski, D., Frank, S., Probst, A., Fraser, G., Stalder, A. K., Beibel, M., Staufenbiel, M., et al. (2009) · Nature Cell Biology · doi:10.1038/ncb1901 · Cited by 1,803
Moy, S. S., Nadler, J. J., Perez, A., Barbaro, R. P., Johns, J. M., Magnuson, T. R., Piven, J., & Crawley, J. N. (2004) · Genes, Brain and Behavior · doi:10.1111/j.1601-1848.2004.00076.x · Cited by 1,522 · cited 1×
“Crawley's three-chamber social approach test consists of a sociability test and a social novelty preference test. These tests assess social interaction that is relatively independent of locomotor activity compared to other social interaction tests, because the preference of the mice can be quantified based on the time…”
BackgroundMemory and Executive Function in Aging and AD
Buckner, R. L. (2004) · Neuron · doi:10.1016/j.neuron.2004.09.006 · Cited by 1,508
Neuronal signalling of fear memory
Maren, S., & Quirk, G. J. (2004) · Nature Reviews Neuroscience · doi:10.1038/nrn1535 · Cited by 1,428
Sensorimotor Gating and Schizophrenia
Braff, D. L. (1990) · Archives of General Psychiatry · doi:10.1001/archpsyc.1990.01810140081011 · Cited by 1,312
Clusters of Hyperactive Neurons Near Amyloid Plaques in a Mouse Model of Alzheimer’s Disease
Busche, M. A., Eichhoff, G., Adelsberger, H., Abramowski, D., Wiederhold, K.-H., Haass, C., Staufenbiel, M., Konnerth, A., & Garaschuk, O. (2008) · Science · doi:10.1126/science.1162844 · Cited by 1,125
Cited by
Sorted by citations
Proteopathic tau seeding predicts tauopathy in vivo
Holmes, B. B., Furman, J. L., Mahan, T. E., Yamasaki, T. R., Mirbaha, H., Eades, W. C., Belaygorod, L., Cairns, N. J., Holtzman, D. M., & Diamond, M. I. (2014) · Proceedings of the National Academy of Sciences · doi:10.1073/pnas.1411649111 · Cited by 696
DeVos, S. L., Miller, R. L., Schoch, K. M., Holmes, B. B., Kebodeaux, C. S., Wegener, A. J., Chen, G., Shen, T., Tran, H., Nichols, B., et al. (2017) · Science Translational Medicine · doi:10.1126/scitranslmed.aag0481 · Cited by 516
Critical role of acetylation in tau-mediated neurodegeneration and cognitive deficits
Min, S.-W., Chen, X., Tracy, T. E., Li, Y., Zhou, Y., Wang, C., Shirakawa, K., Minami, S. S., Defensor, E., Mok, S. A., et al. (2015) · Nature Medicine · doi:10.1038/nm.3951 · Cited by 516
Practical considerations for choosing a mouse model of Alzheimer’s disease
Jankowsky, J. L., & Zheng, H. (2017) · Molecular Neurodegeneration · doi:10.1186/s13024-017-0231-7 · Cited by 449
Chaperone-mediated autophagy prevents collapse of the neuronal metastable proteome
Bourdenx, M., Martín-Segura, A., Scrivo, A., Rodriguez-Navarro, J. A., Kaushik, S., Tasset, I., Diaz, A., Storm, N. J., Xin, Q., Juste, Y. R., et al. (2021) · Cell · doi:10.1016/j.cell.2021.03.048 · Cited by 337
Metadata
- Authors
- Takeuchi, H., Iba, M., Inoue, H., Higuchi, M., Takao, K., Tsukita, K., Karatsu, Y., Iwamoto, Y., Miyakawa, T., Suhara, T., Trojanowski, J. Q., Lee, V. M. Y., & Takahashi, R.
- Affiliations
- Kyoto University (JP)
- Hospital of the University of Pennsylvania (US)
- National Institute of Radiological Sciences (JP)
- National Institute for Physiological Sciences (JP)
- Fujita Health University (JP)
- Corresponding author
- Inoue, Haruhisa
- ORCID
- Venue
- PLoS ONE
- Publisher
- Public Library of Science (PLoS)
- Published
- 2011-06-15
- Volume
- 6
- Issue
- 6
- Pages
- e21050
- ISSN
- 1932-6203 (ISSN-L)
- PMC
- PMC3115982
- OpenAlex
- W2158765009
- Cited by
- 247
- References
- 65
- Citations by year
- 2026: 27 · 2025: 36 · 2024: 24 · 2023: 18 · 2022: 24 · 2021: 24 · 2020: 21 · 2019: 13 · 2018: 7 · 2017: 11 · 2016: 9 · 2015: 11 · 2014: 13 · 2013: 5 · 2012: 3
- FWCI
- 4.80
- Type
- journal article
- Language
- en
- Open access
- gold
- doi.org
- Locations
- PLoS ONE (publishedVersion, cc-by)
- PubMed Central (publishedVersion, cc-by)
- PubMed (publishedVersion)
- Institutional Repositories DataBase (IRDB) (submittedVersion, other-oa)
- DOAJ (DOAJ: Directory of Open Access Journals) (submittedVersion, cc-by-sa)
- Figshare (submittedVersion, cc-by)
- Institutional Repositories DataBase (IRDB) (submittedVersion, cc-by-nc-nd)
- QST-Repository (National Institutes for Quantum and Radiological Science and Technology) (submittedVersion)
- Kyoto University Research Information Repository (Kyoto University) (submittedVersion, cc-by)
- Funders
- National Institutes of Health (AG 10 124)
- Japan Society for the Promotion of Science (22700338, 23390235, 21300121)
- Japan Science and Technology Agency
- RIKEN
- National Institute on Aging (P30AG010124, P01AG017586, AG17586, AG-10124)
- RIKEN Brain Science Institute
- Topics
- Life Sciences › Neuroscience › Cellular and Molecular Neuroscience › Alzheimer's disease research and treatments
- Health Sciences › Medicine › Psychiatry and Mental health › Dementia and Cognitive Impairment Research
- Life Sciences › Neuroscience › Neurology › Neurological Disease Mechanisms and Treatments
- Keywords
- tauopathy, transgenic mouse model, dementia, sensorimotor gating, prepulse inhibition, prodromal Alzheimer's disease, amnestic mild cognitive impairment, behavioral abnormalities, early disease detection, cognitive impairment
- MeSH terms
- Animals, Dementia, Disease Models, Animal, Humans, Mice, Transgenic, tau Proteins, Maze Learning, Mice, Sensory Gating
About these checks
Registry, retraction, Cites and statistics results are computed, not judged, with one exception: a printed reference that no index lists is read once by a model before it counts as a citation error. Claims are extracted by a model and kept only when their quote appears verbatim in the text; each cited source is then checked, with a model’s help, for whether it says what the claim relies on. Those verdicts can be wrong — read the claim’s quote and the cited source before relying on one.
Statistics and arithmetic are recomputed, not judged.
Confidence bands are shown only for fields calibrated on our annotated test set. None is calibrated yet, so no band is shown.
What counts as a claim ›How we measure confidence ›How we check this ›
Are you an author, or do you see a problem with this page? Request a review
