

The DOI matches its Crossref record; 36 of the 36 references it cites were found in a registry or an index.
Oxidation of Hepatic Carnitine Palmitoyl Transferase-I (CPT-I) Impairs Fatty Acid Beta-Oxidation in Rats Fed a Methionine-Choline Deficient Diet
Open accessAbstract
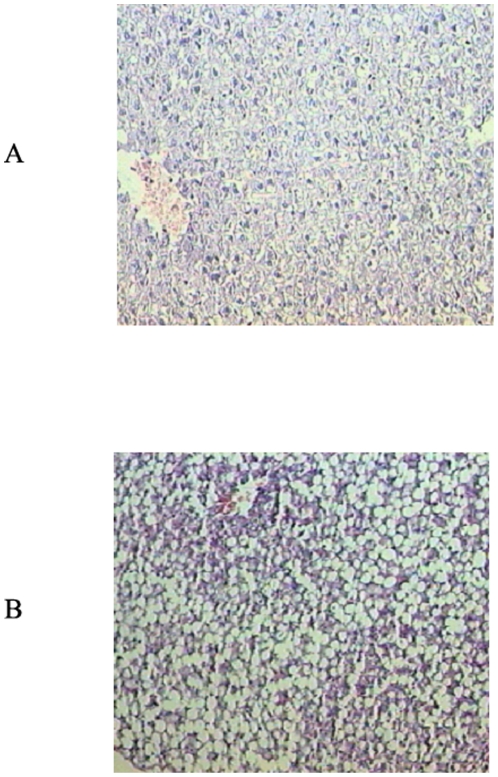
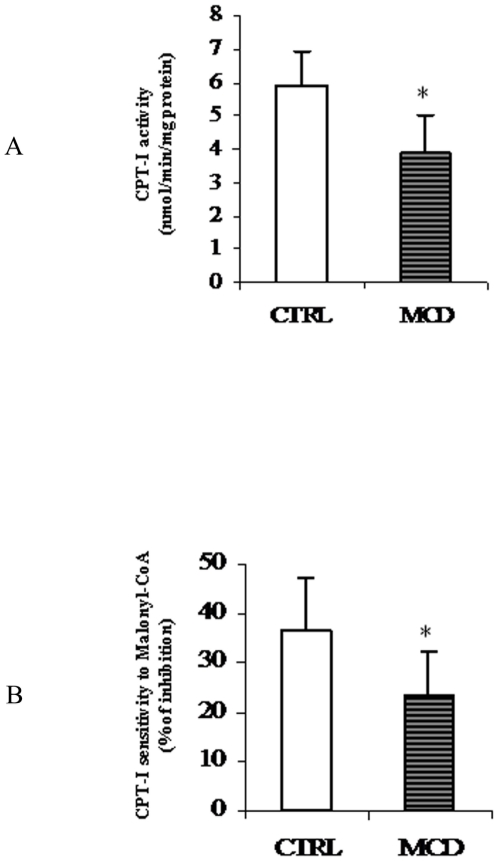
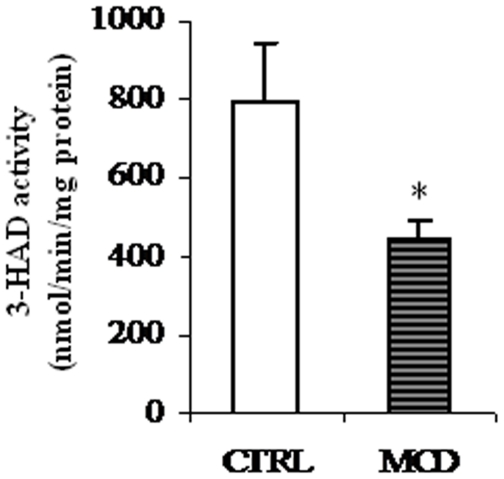
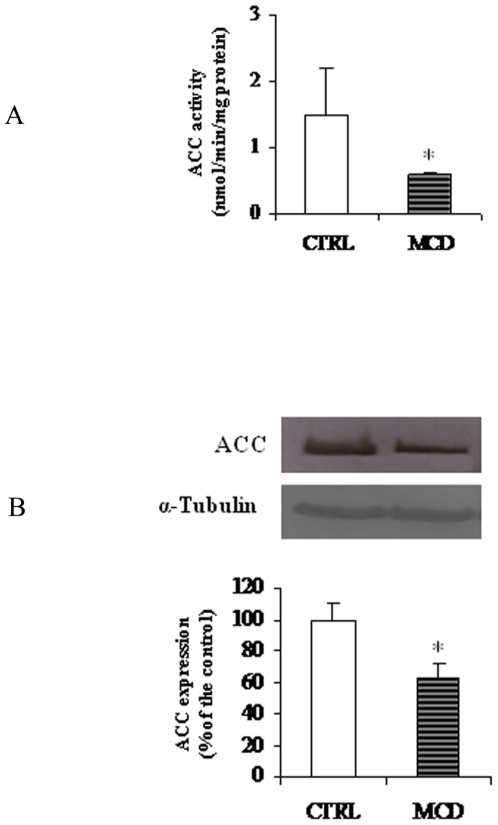
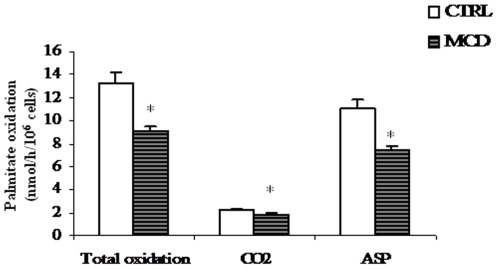
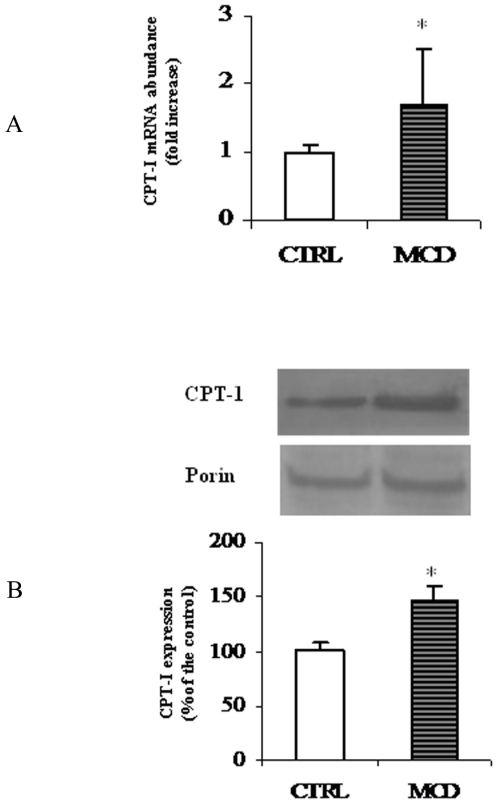
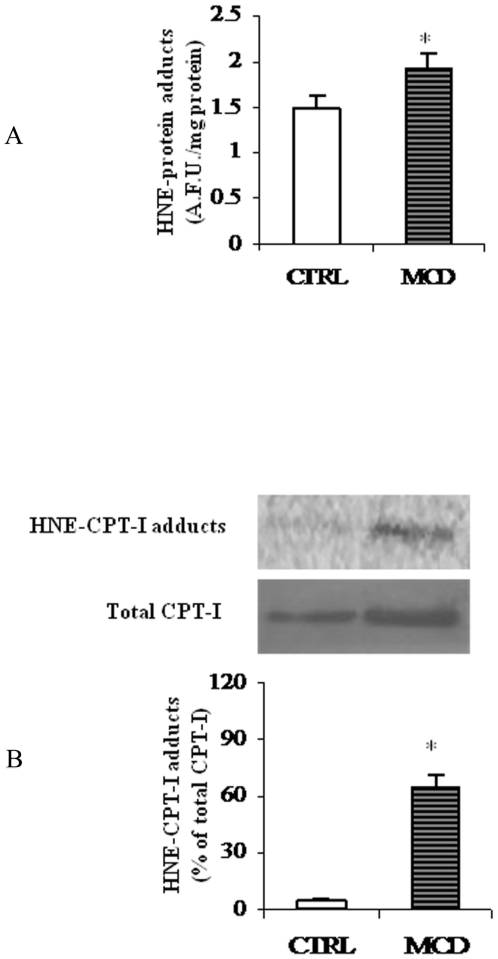
There is growing evidence that mitochondrial dysfunction, and more specifically fatty acid β-oxidation impairment, is involved in the pathophysiology of non-alcoholic steatohepatitis (NASH). The goal of the present study was to achieve more understanding on the modification/s of carnitinepalmitoyltransferase-I (CPT-I), the rate-limiting enzyme of the mitochondrial fatty acid β-oxidation, during steatohepatitis. A high fat/methionine-choline deficient (MCD) diet, administered for 4 weeks, was used to induce NASH in rats.We demonstrated that CPT-I activity decreased, to the same extent, both in isolated liver mitochondria and in digitonin-permeabilized hepatocytes from MCD-diet fed rats.At the same time, the rate of total fatty acid oxidation to CO(2) and ketone bodies, measured in isolated hepatocytes, was significantly lowered in treated animals when compared to controls. Finally, an increase in CPT-I mRNA abundance and protein content, together with a high level of CPT-I protein oxidation was observed in treated rats. A posttranslational modification of rat CPT-I during steatohepatitis has been here discussed.
Overview
The claims and statistics of this paper haven’t been checked yet.
Run the check — free, no account needed. It reads the open-access text and checks the sources it cites.
Integrity signals
Registry
Cites
Statistics
Figures
Verification
Claims the paper makes
The claims and statistics of this paper haven’t been checked yet.
Run the check — free, no account needed. It reads the open-access text and checks the sources it cites.
Claims other papers make about this one
Each is checked against this paper’s own text: does it say what the citing paper says it does?
In the citing paper
“In this study, a NASH rat model fed a methionine-choline-deficient diet had a notable reduction in CPT1A activity and mitochondrial FAO despite increased CPT1A mRNA expression.”
From Mitochondrial fatty acid oxidation in obesity (2013) · cites this paper as [150]
In the citing paper
“The formation of a 4-hydroxynonenal-CPT1 adduct caused by lipid peroxidation as a consequence of ROS overproduction is the main cause of impaired FAO and lipid removal from hepatocytes.”
From Mitochondrial fatty acid oxidation in obesity (2013) · cites this paper as [150]
Self-check
Percentages, sums and reported differences re-computed from the paper’s own numbers.
The self-check needs the paper’s full text.
Citations
Cites
Nonalcoholic Fatty Liver Disease
Angulo, P. (2002) · New England Journal of Medicine · doi:10.1056/nejmra011775 · Cited by 5,228
Ludwig, J., Viggiano, T. R., McGill, D. B., & Ott, B. J. (1980) · Mayo Clinic Proceedings · doi:10.1016/s0025-6196(24)00530-5 · Cited by 2,903
Free Radical Mechanisms in Tissue Injury
Slater, T. F. (1988) · Springer eBooks · doi:10.1007/978-1-4613-0813-3_18 · Cited by 1,555
Free-radical mechanisms in tissue injury
Slater, T. F. (1984) · Biochemical Journal · doi:10.1042/bj2220001 · Cited by 1,542
Mitochondrial dysfunction in Nash: causes, consequences and possible means to prevent it
Begriche, K., Igoudjil, A., Pessayre, D., & Fromenty, B. (2006) · Mitochondrion · doi:10.1016/j.mito.2005.10.004 · Cited by 753
Defective hepatic mitochondrial respiratory chain in patients with nonalcoholic steatohepatitis.
Pérez-Carreras, M., Del Hoyo, P., Martín, M. A., Rubio, J. C., Martín, A., Castellano, G., Colina, F., Arenas, J., & Solis-Herruzo, J. A. (2003) · Hepatology · doi:10.1002/hep.1840380426 · Cited by 734
Re-evaluation of fatty acid metabolism-related gene expression in nonalcoholic fatty liver disease
Kohjima, M., Enjoji, M., Higuchi, N., Kato, M., Kotoh, K., Yoshimoto, T., Fujino, T., Yada, M., Yada, R., Harada, N., et al. (2007) · International Journal of Molecular Medicine · doi:10.3892/ijmm.20.3.351 · Cited by 551
Mitochondrial abnormalities in non-alcoholic steatohepatitis
Caldwell, S. H., Swerdlow, R. H., Khan, E. M., Iezzoni, J. C., Hespenheide, E. E., Parks, J. K., & Parker, W. D. (1999) · Journal of Hepatology · doi:10.1016/s0168-8278(99)80033-6 · Cited by 495
Modification of histidine residues in proteins by reaction with 4-hydroxynonenal.
Uchida, K., & Stadtman, E. R. (1992) · Proceedings of the National Academy of Sciences · doi:10.1073/pnas.89.10.4544 · Cited by 492
Alterations in Liver ATP Homeostasis in Human Nonalcoholic Steatohepatitis
Cortez‐Pinto, H., Chatham, J. C., Chacko, V. P., Arnold, C., Rashid, A., & Diehl, A. M. (1999) · JAMA · doi:10.1001/jama.282.17.1659 · Cited by 487
Research works printed but not linked: 1
- M Nakamuta, 2005, Evaluation of fatty acid metabolism-related gene expression in nonalcoholic fatty liver disease., Int J Mol Med, 16, 631
Cited by
Sorted by citations
Role of oxidative stress in the pathogenesis of nonalcoholic fatty liver disease
Chen, Z., Tian, R., She, Z., Cai, J., & Li, H. (2020) · Free Radical Biology and Medicine · doi:10.1016/j.freeradbiomed.2020.02.025 · Cited by 1,340
Choline metabolism provides novel insights into nonalcoholic fatty liver disease and its progression
Corbin, K. D., & Zeisel, S. H. (2011) · Current Opinion in Gastroenterology · doi:10.1097/mog.0b013e32834e7b4b · Cited by 518
Mitochondrial alterations in fatty liver diseases
Fromenty, B., & Roden, M. (2022) · Journal of Hepatology · doi:10.1016/j.jhep.2022.09.020 · Cited by 448
Free radical biology for medicine: learning from nonalcoholic fatty liver disease
Serviddio, G., Bellanti, F., & Vendemiale, G. (2013) · Free Radical Biology and Medicine · doi:10.1016/j.freeradbiomed.2013.08.174 · Cited by 272
Self-citationMitochondrial fatty acid oxidation in obesity
Serra, D., Mera, P., Malandrino, M. I., Mir, J. F., & Herrero, L. (2013) · Antioxidants & Redox Signaling · doi:10.1089/ars.2012.4875 · Cited by 246
Browning of white adipose tissue: lessons from experimental models
Bargut, T. C. L., Souza‐Mello, V., Águila, M. B., & Mandarim‐de‐Lacerda, C. A. (2017) · Hormone Molecular Biology and Clinical Investigation · doi:10.1515/hmbci-2016-0051 · Cited by 212
Mitochondrial Oxidative Stress and Antioxidants Balance in Fatty Liver Disease
García‐Ruiz, C., & Fernández-Checa, J. C. (2018) · Hepatology Communications · doi:10.1002/hep4.1271 · Cited by 202
Peroxisome proliferator-activated receptors as targets to treat non-alcoholic fatty liver disease
Souza-Mello, V. (2015) · World Journal of Hepatology · doi:10.4254/wjh.v7.i8.1012 · Cited by 182
Aberrant Metabolism in Hepatocellular Carcinoma Provides Diagnostic and Therapeutic Opportunities
Matteis, S. D., Ragusa, A., Marisi, G., Domenico, S. D., Gardini, A. C., Bonafè, M., & Giudetti, A. M. (2018) · Oxidative Medicine and Cellular Longevity · doi:10.1155/2018/7512159 · Cited by 160
Self-citationPark, H.-S., Jang, J. E., Ko, M. S., Woo, S. H., Kim, B. J., Kim, H. S., Park, H. S., Park, I.-S., Koh, E. H., & Lee, K. (2016) · Diabetes & Metabolism Journal · doi:10.4093/dmj.2016.40.5.376 · Cited by 161
Sun, F., Cao, Y., Cai, C., Li, S., Yu, C., & Yao, J. (2016) · PLoS ONE · doi:10.1371/journal.pone.0160659 · Cited by 159
Carpi, R. Z., Barbalho, S. M., Sloan, K. P., Laurindo, L. F., Gonzaga, H. F., Grippa, P. C., Zutin, T. L. M., Gírio, R. J. S., Repetti, C. S. F., Detregiachi, C. R. P., et al. (2022) · International Journal of Molecular Sciences · doi:10.3390/ijms23158805 · Cited by 147
Epigenetics in non-alcoholic fatty liver disease
Lee, J.-H., Kim, Y., Friso, S., & Choi, S. (2016) · Molecular Aspects of Medicine · doi:10.1016/j.mam.2016.11.008 · Cited by 139
Lipid oxidation products in the pathogenesis of non-alcoholic steatohepatitis
Bellanti, F., Villani, R., Facciorusso, A., Vendemiale, G., & Serviddio, G. (2017) · Free Radical Biology and Medicine · doi:10.1016/j.freeradbiomed.2017.01.023 · Cited by 136
Self-citationNonalcoholic Fatty Liver Disease (NAFLD). Mitochondria as Players and Targets of Therapies?
Ciaula, A. D., Passarella, S., Shanmugam, H., Noviello, M., Bonfrate, L., Wang, D. Q. ‐., & Portincasa, P. (2021) · International Journal of Molecular Sciences · doi:10.3390/ijms22105375 · Cited by 142
Zhang, Z., Shang, J., Yang, Q., Dai, Z., Liang, Y., Lai, C., Feng, T., Zhong, D., Zou, H., Ji, G., et al. (2023) · Journal of Nanobiotechnology · doi:10.1186/s12951-023-01788-4 · Cited by 131
García‐Ruiz, C., Baulies, A., Marí, M., García-Rovés, P. M., & Fernández-Checa, J. C. (2013) · Free Radical Research · doi:10.3109/10715762.2013.830717 · Cited by 119
Carnitine in Human Muscle Bioenergetics: Can Carnitine Supplementation Improve Physical Exercise?
Gnoni, A., Longo, S., Gnoni, G. V., & Giudetti, A. M. (2020) · Molecules · doi:10.3390/molecules25010182 · Cited by 118
Self-citationMetabolic reprogramming in hepatocellular carcinoma: mechanisms and therapeutic implications
Park, S., & Hall, M. N. (2025) · Experimental & Molecular Medicine · doi:10.1038/s12276-025-01415-2 · Cited by 108
Magliano, D. C., Bargut, T. C. L., de Carvalho, S. N., Águila, M. B., Mandarim‐de‐Lacerda, C. A., & Souza‐Mello, V. (2013) · PLoS ONE · doi:10.1371/journal.pone.0064258 · Cited by 89
Ornellas, F., Souza‐Mello, V., Mandarim‐de‐Lacerda, C. A., & Águila, M. B. (2015) · PLoS ONE · doi:10.1371/journal.pone.0124737 · Cited by 76
Peroxisome Proliferator-Activated Receptors and Their Agonists in Nonalcoholic Fatty Liver Disease
Choudhary, N. S., Kumar, N., & Duseja, A. K. (2019) · Journal of Clinical and Experimental Hepatology · doi:10.1016/j.jceh.2019.06.004 · Cited by 75
Dallio, M., Sangineto, M., Romeo, M., Villani, R., Romano, A. D., Loguercio, C., Serviddio, G., & Federico, A. (2021) · International Journal of Molecular Sciences · doi:10.3390/ijms22010436 · Cited by 77
Self-citationZhu, J., Wu, Y., Tang, Q., Leng, Y., & Cai, W. (2014) · Nutrients · doi:10.3390/nu6072552 · Cited by 76
Carvajal, S., Perramón, M., Oró, D., Casals, E., Fernández‐Varo, G., Casals, G., Parra‐Robert, M., de la Presa, B. G., Ribera, J., Pastor, Ó., et al. (2019) · Scientific Reports · doi:10.1038/s41598-019-49262-2 · Cited by 78
Bathish, B., Robertson, H., Dillon, J. F., Dinkova‐Kostova, A. T., & Hayes, J. D. (2022) · Free Radical Biology and Medicine · doi:10.1016/j.freeradbiomed.2022.06.226 · Cited by 70
Mehmood, A., Zhao, L., Wang, Y., Pan, F., Hao, S., Zhang, H., Iftikhar, A., & Usman, M. A. (2021) · Food Research International · doi:10.1016/j.foodres.2021.110180 · Cited by 67
The Effect and Mechanism of Tamoxifen-Induced Hepatocyte Steatosis in Vitro
Zhao, F., Xie, P., Jiang, J., Zhang, L., An, W., & Zhan, Y. (2014) · International Journal of Molecular Sciences · doi:10.3390/ijms15034019 · Cited by 66
Targeting mitochondria to oppose the progression of nonalcoholic fatty liver disease
Grattagliano, I., Montezinho, L. P., Oliveira, P. J., Frühbeck, G., Gómez‐Ambrosi, J., Montecucco, F., Carbone, F., Wieckowski, M. R., Wang, D. Q. ‐., & Portincasa, P. (2018) · Biochemical Pharmacology · doi:10.1016/j.bcp.2018.11.020 · Cited by 66
Tang, X., Shen, T., Jiang, X., Xia, M., Sun, X., Guo, H., & Ling, W. (2014) · Journal of Agricultural and Food Chemistry · doi:10.1021/jf504926n · Cited by 63
Priore, P., Cavallo, A., Gnoni, A., Damiano, F., Gnoni, G. V., & Siculella, L. (2015) · IUBMB Life · doi:10.1002/iub.1340 · Cited by 61
Self-citationGarcía‐Heredia, A., Kensicki, E., Mohney, R. P., Rull, A., Triguero, I., Marsillach, J., Tormos, C., Mackness, B., Mackness, M., Shih, D. M., et al. (2013) · Journal of Proteome Research · doi:10.1021/pr400050u · Cited by 61
Lee, Y., Hu, S., Park, Y., & Lee, J. (2019) · Preventive Nutrition and Food Science · doi:10.3746/pnf.2019.24.2.103 · Cited by 62
Zabielski, P., Lanza, I. R., Gopala, S., Holtz Heppelmann, C. J., Bergen, H. R., Dasari, S., & Nair, K. S. (2016) · Diabetes · doi:10.2337/db15-0823 · Cited by 54
Schugar, R. C., Huang, X., Moll, A. R., Brunt, E. M., & Crawford, P. A. (2013) · PLoS ONE · doi:10.1371/journal.pone.0074806 · Cited by 52
Motiño, O., Lambertucci, F., Anagnostopoulos, G., Li, S., Nah, J., Castoldi, F., Senovilla, L., Montégut, L., Chen, H., Durand, S., et al. (2022) · Proceedings of the National Academy of Sciences · doi:10.1073/pnas.2207344119 · Cited by 54
Cui, C.-X., Deng, J., Yan, L., Liu, Y., Fan, J., Mu, H., Sun, H., Wang, Y.-H., & Han, J. (2017) · Journal of Ethnopharmacology · doi:10.1016/j.jep.2017.06.030 · Cited by 51
Xu, L., Nagata, N., & Ota, T. (2019) · International Journal of Molecular Sciences · doi:10.3390/ijms20235920 · Cited by 51
Metabolism as a New Avenue for Hepatocellular Carcinoma Therapy
Gnocchi, D., Sabbà, C., Massimi, M., & Mazzocca, A. (2023) · International Journal of Molecular Sciences · doi:10.3390/ijms24043710 · Cited by 50
Nativ, N. I., Yarmush, G., So, A., Barminko, J., Maguire, T. J., Schloss, R. S., Francois Berthiaume, B., & Yarmush, M. L. (2014) · Liver Transplantation · doi:10.1002/lt.23905 · Cited by 47
Han, J., Dzierlenga, A. L., Lu, Z., Billheimer, D. D., Torabzadeh, E., Lake, A. D., Li, H., Novák, P., Shipkova, P. A., Aranı́bar, N., et al. (2017) · Obesity · doi:10.1002/oby.21855 · Cited by 47
Jia, Y., Yee, J. K., Wang, C., Nikolaenko, L., Diaz‐Arjonilla, M., Cohen, J. N., French, S. W., Liu, P. Y., Lue, Y., Lee, W. P., et al. (2017) · American Journal of Physiology-Endocrinology and Metabolism · doi:10.1152/ajpendo.00124.2017 · Cited by 45
Singular effects of PPAR agonists on nonalcoholic fatty liver disease of diet-induced obese mice
Barbosa‐da‐Silva, S., Souza‐Mello, V., Magliano, D. C., Marinho, T. D. S., Águila, M. B., & Mandarim‐de‐Lacerda, C. A. (2015) · Life Sciences · doi:10.1016/j.lfs.2015.02.003 · Cited by 44
Gut Microbiota at the Crossroad of Hepatic Oxidative Stress and MASLD
Termite, F., Archilei, S., D’Ambrosio, F., Petrucci, L., Viceconti, N., Iaccarino, R., Liguori, A., Gasbarrini, A., & Miele, L. (2025) · Antioxidants · doi:10.3390/antiox14010056 · Cited by 50
Hughey, C. C., Puchalska, P., & Crawford, P. A. (2022) · Biochimica et Biophysica Acta (BBA) - Molecular and Cell Biology of Lipids · doi:10.1016/j.bbalip.2022.159209 · Cited by 45
Zhu, Y., Soto, J. E., Anderson, B. D., Riehle, C., Zhang, Y., Wende, A. R., Jones, D., McClain, D. A., & Abel, E. D. (2013) · American Journal of Physiology-Heart and Circulatory Physiology · doi:10.1152/ajpheart.00877.2012 · Cited by 41
Peng, J. L., Bai, S., Wang, J. P., Ding, X., Zeng, Q., & Zhang, K. Y. (2018) · Poultry Science · doi:10.3382/ps/pey317 · Cited by 39
Liu, X., Zhong, F., Tang, X.-L., Lian, F., Zhou, Q., Guo, S., Liu, J.-F., Sun, P. G., Xu, H., Lu, Y., et al. (2014) · Acta Pharmacologica Sinica · doi:10.1038/aps.2013.186 · Cited by 38
In vivo cytochrome P450 activity alterations in diabetic nonalcoholic steatohepatitis mice
Li, H., Clarke, J., Dzierlenga, A. L., Bear, J., Goedken, M. J., & Cherrington, N. J. (2016) · Journal of Biochemical and Molecular Toxicology · doi:10.1002/jbt.21840 · Cited by 38
Xiao, W., Ren, M., Zhang, C., Li, S., & An, W. (2015) · American Journal of Physiology-Cell Physiology · doi:10.1152/ajpcell.00133.2014 · Cited by 38
Chen, J., Fan, X., Zhou, L., & Gao, X. (2015) · Journal of Gastroenterology and Hepatology · doi:10.1111/jgh.13272 · Cited by 37
Naini, B. V., Spilker, B., & Buchman, A. L. (2017) · Seminars in Liver Disease · doi:10.1055/s-0036-1597771 · Cited by 37
Vecchione, G., Grasselli, E., Cioffi, F., Baldini, F., Oliveira, P. J., Sardão, V. A., Cortese, K., Lanni, A., Voci, A., Portincasa, P., et al. (2017) · Frontiers in Nutrition · doi:10.3389/fnut.2017.00042 · Cited by 37
Borges, C. C., Salles, A. F., Bringhenti, I., Mandarim‐de‐Lacerda, C. A., & Águila, M. B. (2018) · Journal of Nutritional Science and Vitaminology · doi:10.3177/jnsv.64.106 · Cited by 37
Dhami-Shah, H., Vaidya, R., Udipi, S., Raghavan, S., Abhijit, S., Mohan, V., Balasubramanyam, M., & Vaidya, A. (2018) · Clinical and Molecular Hepatology · doi:10.3350/cmh.2017.0039 · Cited by 36
Heart energy metabolism impairment in Western-diet induced obese mice
Neves, F. A., Cortez, E. A. C., Bernardo, A. F., de Mattos, A. B. M., Vieira, A. K. G., Malafaia, T. D. O., Thole, A. A., Rodrigues-Cunha, A. C. D. S., Garcia‐Souza, É. P., Sichieri, R., et al. (2013) · The Journal of Nutritional Biochemistry · doi:10.1016/j.jnutbio.2013.08.014 · Cited by 40
Role of Pin1 Protein in the Pathogenesis of Nonalcoholic Steatohepatitis in a Rodent Model
Nakatsu, Y., Otani, Y., Sakoda, H., Zhang, J., Guo, Y., Okubo, H., Kushiyama, A., Fujishiro, M., Kikuch, T., Fukushima, T., et al. (2012) · Journal of Biological Chemistry · doi:10.1074/jbc.m112.397133 · Cited by 34
Wang, J., Lu, R., Sun, J.-J., Xie, D., Yang, F., & Nie, G.-X. (2016) · Aquaculture Research · doi:10.1111/are.13228 · Cited by 33
The Effects of Maternal Obesity on Porcine Placental Efficiency and Proteome
Li, J.-W., Hu, J., Wei, M., Guo, Y., & Yan, P. (2019) · Animals · doi:10.3390/ani9080546 · Cited by 29
Cavallo, A., Priore, P., Gnoni, G. V., Papa, S., Zanotti, F., & Gnoni, A. (2013) · PLoS ONE · doi:10.1371/journal.pone.0052328 · Cited by 29
Self-citationChiang, H., Lu, H.-F., Chen, J., Chen, Y., Sun, H.-T., Huang, H., Tien, H.-H., & Huang, C. (2020) · Evidence-based Complementary and Alternative Medicine · doi:10.1155/2020/9519625 · Cited by 29
Yang, Q., Liang, H., Maulu, S., Ge, X., Ren, M., Xie, J., & Xi, B. (2021) · Animal Feed Science and Technology · doi:10.1016/j.anifeedsci.2021.114896 · Cited by 27
Grattagliano, I., Ciaula, A. D., Baj, J., Molina‐Molina, E., Shanmugam, H., Garruti, G., Wang, D. Q. ‐., & Portincasa, P. (2021) · Methods in molecular biology · doi:10.1007/978-1-0716-1433-4_12 · Cited by 28
Hepatic Mitochondria-Gut Microbiota Interactions in Metabolism-Associated Fatty Liver Disease
Bellanti, F., Buglio, A. L., & Vendemiale, G. (2023) · Metabolites · doi:10.3390/metabo13030322 · Cited by 26
Self-citationPriore, P., Stanca, E., Gnoni, G. V., & Siculella, L. (2012) · Biochimica et Biophysica Acta (BBA) - Molecular and Cell Biology of Lipids · doi:10.1016/j.bbalip.2012.07.008 · Cited by 27
Self-citationBian, L., Chen, H., Gong, X., Zhao, C., & Zhou, X. D. (2021) · Frontiers in Pharmacology · doi:10.3389/fphar.2021.766737 · Cited by 25
Perazza, F., Leoni, L., Selvatici, B., Girolami, F., Bonalumi, A., Beretta, A., Ferri, S., Petroni, M. L., Piscaglia, F., Ravaioli, F., et al. (2025) · Nutrients · doi:10.3390/nu17111906 · Cited by 25
Influence of a Polyherbal Mixture in Dairy Calves: Growth Performance and Gene Expression
Galván, C. D., MÉNDEZ-OLVERA, E. T., Gómez, D. M., Trujillo, A. G., Hernández-García, P. A., Ayala, E. E., Martínez, M. P., Lara-Bueno, A., Martínez, G. D. M., & Velázquez-Cruz, L. A. (2021) · Frontiers in Veterinary Science · doi:10.3389/fvets.2020.623710 · Cited by 21
Kikusato, M., Sudo, S., & Toyomizu, M. (2015) · British Poultry Science · doi:10.1080/00071668.2014.996529 · Cited by 20
Reyes-García, J., Carbajal-García, A., Mise, A. D., Zheng, Y., Wang, X., & Wang, Y.-X. (2022) · Antioxidants · doi:10.3390/antiox11030473 · Cited by 20
Mechanism of the effect of glycosyltransferase GLT8D2 on fatty liver
Zhan, Y., Zhao, F., Xie, P., Zhong, L.-P., Li, D., Gai, Q., Li, L., Wei, H., Zhang, L., & An, W. (2015) · Lipids in Health and Disease · doi:10.1186/s12944-015-0040-3 · Cited by 19
Rao, A., van de Peppel, I. P., Gumber, S., Karpen, S. J., & Dawson, P. A. (2020) · Frontiers in Medicine · doi:10.3389/fmed.2020.00060 · Cited by 18
The role of ALDHs in lipid peroxidation-related diseases
Wang, Y.-N., & Liu, S. (2024) · International Journal of Biological Macromolecules · doi:10.1016/j.ijbiomac.2024.138760 · Cited by 18
Wang, L., Wang, H., Wu, J., Ji, C., Wang, Y., Gu, M., Li, M., & Yang, H. W. (2025) · Frontiers in Cellular and Infection Microbiology · doi:10.3389/fcimb.2025.1635638 · Cited by 18
Jersey steer ruminal papillae histology and nutrigenomics with diet changes
Novak, T. E., Rodriguez‐Zas, S. L., Southey, B. R., Starkey, J. D., Stockler, R. M., Alfaro, G. F., & Moisá, S. J. (2019) · Journal of Animal Physiology and Animal Nutrition · doi:10.1111/jpn.13189 · Cited by 18
Abramowicz, K., Krauze, M., & Ognik, K. (2019) · Annals of Animal Science · doi:10.2478/aoas-2018-0059 · Cited by 17
Zhang, Y., Zhou, G., Chen, Z., Guan, W., Zhang, J., Bi, M., Wang, F., You, X., Liao, Y., Zheng, S., et al. (2020) · Evidence-based Complementary and Alternative Medicine · doi:10.1155/2020/8786424 · Cited by 20
Liu, X., Zhang, J., Ming, Y., Chen, X., Zeng, M., & Mao, Y. (2015) · Scandinavian Journal of Gastroenterology · doi:10.3109/00365521.2015.1030687 · Cited by 16
Bernardo, A. F., Cortez, E. A. C., Neves, F. A., Vieira, A. K. G., Soares, V. D. M., Rodrigues-Cunha, A. C. D. S., de Andrade, D. C., Thole, A. A., Gabriel‐Costa, D., Brum, P. C., et al. (2015) · The Journal of Nutritional Biochemistry · doi:10.1016/j.jnutbio.2015.09.021 · Cited by 18
Tokoro, M., Gotoh, K., Kudo, Y., Hirashita, Y., Iwao, M., Arakawa, M., Endo, M., Oribe, J., Masaki, T., Honda, K., et al. (2020) · Obesity Science & Practice · doi:10.1002/osp4.460 · Cited by 18
Zhang, Q., Bertics, S. J., Luchini, N. D., & White, H. M. (2016) · Journal of Dairy Science · doi:10.3168/jds.2016-11312 · Cited by 15
Tacconi, S., Longo, S., Guerra, F., Moliteni, C., Friuli, M., Romano, A., Gaetani, S., Paradiso, V. M., Difonzo, G., Caponio, F., et al. (2023) · Food & Function · doi:10.1039/d3fo00817g · Cited by 14
Self-citationJia, Y., Kim, J.-H., Nam, B., Kim, J., Lee, J. H., Hwang, K.-Y., & Lee, S. (2014) · Bioorganic & Medicinal Chemistry Letters · doi:10.1016/j.bmcl.2014.04.019 · Cited by 14
Cavallo, A., Taurino, F., Damiano, F., Siculella, L., Sardanelli, A. M., & Gnoni, A. (2016) · Journal of Bioenergetics and Biomembranes · doi:10.1007/s10863-016-9686-4 · Cited by 14
Self-citationGellrich, L., & Merk, D. (2017) · Nuclear Receptor Research · doi:10.11131/2017/101310 · Cited by 13
Geng, H., Yang, P., Chen, Y., Qin, Y., Li, X., He, C., Mai, K., & Song, F. B. (2023) · Aquaculture Reports · doi:10.1016/j.aqrep.2023.101546 · Cited by 11
Joon, A., Sharma, A., Jalandra, R., Bayal, N., Dhar, R., & Karmakar, S. (2024) · Journal of Translational Gastroenterology · doi:10.14218/jtg.2023.00018 · Cited by 11
Grattagliano, I., Bonfrate, L., Lorusso, M. P., Castorani, L., de Bari, O., & Portincasa, P. (2014) · Methods in molecular biology · doi:10.1007/978-1-4939-1875-1_12 · Cited by 10
Yeh, J., Tung, Y., Yeh, Y., & Chien, Y. (2021) · Nutrients · doi:10.3390/nu13062022 · Cited by 10
Na, A., Jo, J. J., Kwon, O. K., Shrestha, R., Cho, P. J., Kim, K. M., Ki, S. H., Lee, T. H., Jeon, T. W., Jeong, T. C., et al. (2018) · Toxicology and Applied Pharmacology · doi:10.1016/j.taap.2018.05.021 · Cited by 10
Fock, E. M., Bachteeva, V. T., Lavrova, E. A., & Parnova, R. G. (2018) · Journal of Lipids · doi:10.1155/2018/5745790 · Cited by 10
Yang, W., Jiang, W., Luo, L., Bu, J., Pang, D., Wei, J., Du, C., Xia, X., Cui, Y., Liu, S., et al. (2014) · International Journal of Molecular Sciences · doi:10.3390/ijms15011499 · Cited by 9
Leiber, L., Boursier, J., Michalak, S., Roullier, V., Fizanne, L., Chaigneau, J., Roux, J., Moal, V., Flamment, M., Bazeries, P., et al. (2015) · Diagnostic and Interventional Imaging · doi:10.1016/j.diii.2015.03.006 · Cited by 9
Gligorovska, L., Teofilović, A., Milutinović, D. V., Miladinović, N., Kovačević, S., Veličković, N. A., & Djordjevic, A. D. (2021) · BioFactors · doi:10.1002/biof.1711 · Cited by 8
Li, S., An, J., Zhang, T., Chen, G., Zhang, Z., Guo, Z., Dai, Z., Cheng, X., Cheng, S., Xiong, X., et al. (2024) · Journal of Ethnopharmacology · doi:10.1016/j.jep.2024.118759 · Cited by 8
Protective Actions of Polyphenols in the Development of Nonalcoholic Fatty Liver Disease
Lee, Y., & Lee, J. (2019) · Elsevier eBooks · doi:10.1016/b978-0-12-814466-4.00008-2 · Cited by 9
Chandler, T. L., Erb, S. J., Myers, W. A., Deme, P., Haughey, N. J., McFadden, J. W., & White, H. M. (2020) · Scientific Reports · doi:10.1038/s41598-020-75956-z · Cited by 8
Nonalcoholic Steatohepatitis: Lessons from Different Diet-induced Animal Models
Souza‐Mello, V. (2014) · Journal of Diabetes Metabolic Disorders & Control · doi:10.15406/jdmdc.2014.01.00014 · Cited by 7
Sakunthala, A., & Rajamohan, T. (2018) · Journal of Exploratory Research in Pharmacology · doi:10.14218/jerp.2017.00008 · Cited by 7
Ham, J. R., Choi, R., Lee, H.-I., & Lee, M. (2020) · Molecules · doi:10.3390/molecules25051177 · Cited by 7
Metadata
- Authors
- Serviddio, G., Giudetti, A. M., Bellanti, F., Priore, P., Rollo, T., Tamborra, R., Siculella, L., Vendemiale, G., Altomare, E., & Gnoni, G. V.
- Affiliations
- University of Foggia (IT)
- University of Salento (IT)
- Corresponding author
- Gnoni, Gabriele V.
- ORCID
- Venue
- PLoS ONE
- Publisher
- Public Library of Science (PLoS)
- Published
- 2011-09-01
- Volume
- 6
- Issue
- 9
- Pages
- e24084
- ISSN
- 1932-6203 (ISSN-L)
- PMC
- PMC3164715
- OpenAlex
- W2007759293
- Cited by
- 128
- References
- 36
- Citations by year
- 2026: 5 · 2025: 6 · 2024: 7 · 2023: 7 · 2022: 8 · 2021: 10 · 2020: 9 · 2019: 9 · 2018: 11 · 2017: 10 · 2016: 7 · 2015: 14 · 2014: 9 · 2013: 9 · 2012: 6
- FWCI
- 6.03
- Type
- journal article
- Language
- en
- Open access
- gold
- doi.org
- Locations
- PLoS ONE (publishedVersion, cc-by)
- PubMed Central (publishedVersion, cc-by)
- PubMed (publishedVersion)
- DOAJ (DOAJ: Directory of Open Access Journals) (submittedVersion, cc-by-sa)
- AIRUS (submittedVersion)
- Funders
- Ministero dell’Istruzione, dell’Università e della Ricerca
- Topics
- Health Sciences › Medicine › Hepatology › Liver Disease Diagnosis and Treatment
- Life Sciences › Biochemistry, Genetics and Molecular Biology › Clinical Biochemistry › Metabolism and Genetic Disorders
- Life Sciences › Biochemistry, Genetics and Molecular Biology › Molecular Biology › Mitochondrial Function and Pathology
- Keywords
- carnitine palmitoyltransferase 1, fatty acid beta-oxidation, nonalcoholic steatohepatitis, methionine-choline-deficient diet, mitochondrial dysfunction, hepatocytes, liver mitochondria, post-translational modification, ketone synthesis, high-fat diet
- MeSH terms
- Acetyl-CoA Carboxylase, Animals, Blood Glucose, Carnitine O-Palmitoyltransferase, Cell Membrane Permeability, Choline, Diet, Fatty Acids, Feeding Behavior, Liver, Male, Malonyl Coenzyme A, Methionine, Mitochondria, Liver, Oxidation-Reduction, RNA, Messenger, 3-Hydroxyacyl CoA Dehydrogenases, Gene Expression Regulation, Enzymologic, Rats, Wistar, Palmitic Acid, Hepatocytes, Mitochondrial Membranes, Rats, Enzyme Assays
About these checks
Registry, retraction, Cites and statistics results are computed, not judged, with one exception: a printed reference that no index lists is read once by a model before it counts as a citation error. Claims are extracted by a model and kept only when their quote appears verbatim in the text; each cited source is then checked, with a model’s help, for whether it says what the claim relies on. Those verdicts can be wrong — read the claim’s quote and the cited source before relying on one.
Statistics and arithmetic are recomputed, not judged.
Confidence bands are shown only for fields calibrated on our annotated test set. None is calibrated yet, so no band is shown.
What counts as a claim ›How we measure confidence ›How we check this ›
Are you an author, or do you see a problem with this page? Request a review
