Cited by 232Neuroscience and Neural EngineeringAnalog and Mixed-Signal Circuit DesignNeural dynamics and brain function

The DOI matches its Crossref record; 51 of the 51 references it cites were found in a registry or an index.

Multiplexed, High Density Electrophysiology with Nanofabricated Neural Probes

Open access

Abstract

Extracellular electrode arrays can reveal the neuronal network correlates of behavior with single-cell, single-spike, and sub-millisecond resolution. However, implantable electrodes are inherently invasive, and efforts to scale up the number and density of recording sites must compromise on device size in order to connect the electrodes. Here, we report on silicon-based neural probes employing nanofabricated, high-density electrical leads. Furthermore, we address the challenge of reading out multichannel data with an application-specific integrated circuit (ASIC) performing signal amplification, band-pass filtering, and multiplexing functions. We demonstrate high spatial resolution extracellular measurements with a fully integrated, low noise 64-channel system weighing just 330 mg. The on-chip multiplexers make possible recordings with substantially fewer external wires than the number of input channels. By combining nanofabricated probes with ASICs we have implemented a system for performing large-scale, high-density electrophysiology in small, freely behaving animals that is both minimally invasive and highly scalable.

Overview

The claims and statistics of this paper haven’t been checked yet.

Run the check — free, no account needed. It reads the open-access text and checks the sources it cites.

A few free checks a day · papers already verified open instantly · results are public

Integrity signals

Registry

Crossref · 10.1371/journal.pone.0026204

Cites

51 of 51 references verified0 citation errors · 0 not checkable

Statistics

Figures

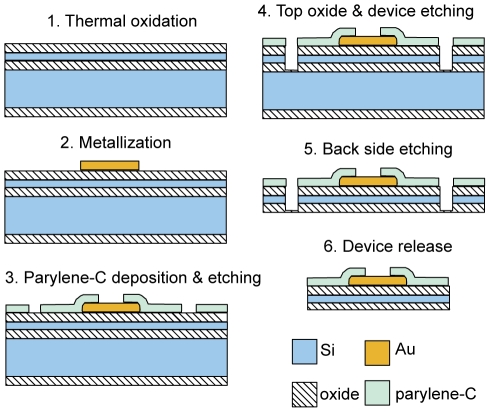
Figure 1 Process flow schematic for the nanofabrication of 64 channel silicon neural probes.
Figure 1 Process flow schematic for the nanofabrication of 64 channel silicon neural probes.CC BY · PubMed Central
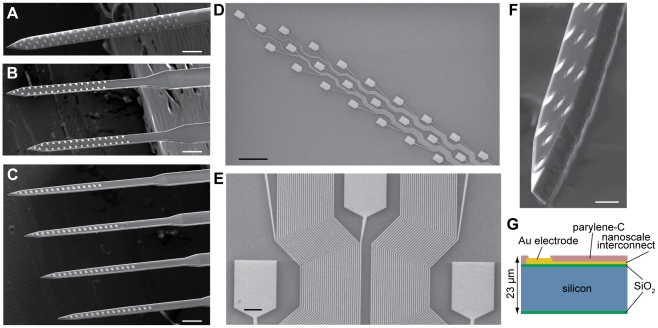
Figure 2 64 channel silicon-based neural probes with nanoscale leads. (A–C) Three configurations of probes. Scale bars, 200 µm. (D) Gold recording sites and nanoscale leads, patterned with e-beam lithography. The lead width ranges from 1000 nm at the top lefthand corner, to 290 nm at the bottom righthand corner of the image. Scale bar, 50 µm. (E) A section of interconnecting leads belonging to the “honeycomb” array configuration displayed in (A) and (D). The narrowest traces have width and spacing of 290 nm. Scale bar, 5 µm. (F) Characteristic chisel-shaped profile of the probes resulting from deep reactive ion etching of silicon. Scale bar, 25 µm. (G) Silicon device cross-section.
Figure 2 64 channel silicon-based neural probes with nanoscale leads. (A–C) Three configurations of probes. Scale bars, 200 µm. (D) Gold recording sites and nanoscale leads, patterned with e-beam lithography. The lead width ranges from 1000 nm at the top lefthand corner, to 290 nm at the bottom righthand corner of the image. Scale bar, 50 µm. (E) A section of interconnecting leads belonging to the “honeycomb” array configuration displayed in (A) and (D). The narrowest traces have width and spacing of 290 nm. Scale bar, 5 µm. (F) Characteristic chisel-shaped profile of the probes resulting from deep reactive ion etching of silicon. Scale bar, 25 µm. (G) Silicon device cross-section.CC BY · PubMed Central
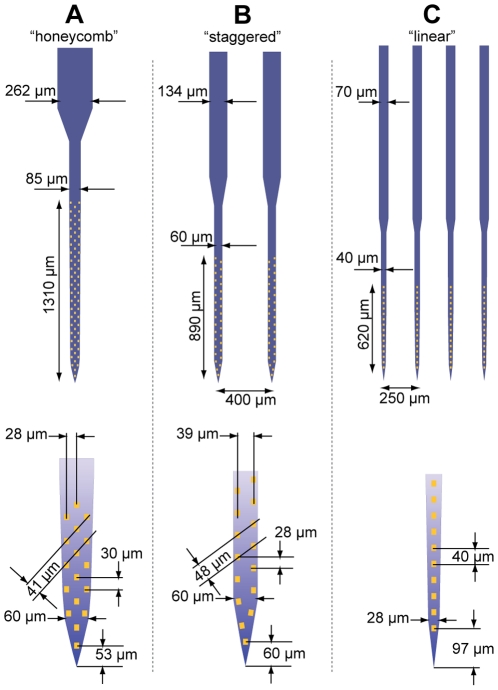
Figure 3 Detailed schematic of the three fabricated probe configurations. All probes contain 64 independent recording channels. Device (A) contains 290 nm leads at the most space-limited area of the array on the base of the shaft. The shaft width is tapered from 60 µm at the tip to 85 µm at the base. The 262 µm ‘stalk’ indicates the location at which lead fabrication was transferred from e-beam to a standard UV lithography process with 3 µm feature size. Device (B) contains 350 nm leads, 32 sites per shaft, and its shafts are 60 µm wide. Device (C) contains 500 nm leads, 16 sites per shaft, and its shafts are tapered from 28 to 40 µm. All array configurations were fabricated in two device length variants (2.5 or 5.5 mm long shafts).
Figure 3 Detailed schematic of the three fabricated probe configurations. All probes contain 64 independent recording channels. Device (A) contains 290 nm leads at the most space-limited area of the array on the base of the shaft. The shaft width is tapered from 60 µm at the tip to 85 µm at the base. The 262 µm ‘stalk’ indicates the location at which lead fabrication was transferred from e-beam to a standard UV lithography process with 3 µm feature size. Device (B) contains 350 nm leads, 32 sites per shaft, and its shafts are 60 µm wide. Device (C) contains 500 nm leads, 16 sites per shaft, and its shafts are tapered from 28 to 40 µm. All array configurations were fabricated in two device length variants (2.5 or 5.5 mm long shafts).CC BY · PubMed Central
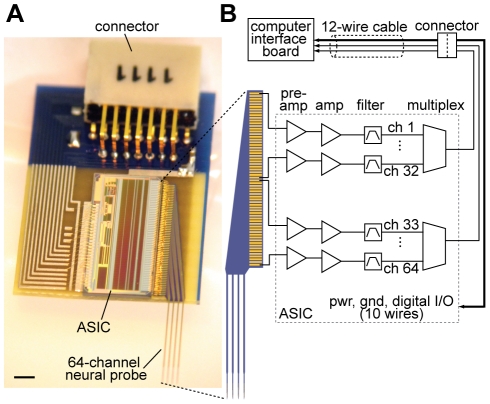
Figure 4 A fully integrated 64 channel recording system. (A) The system, weighing 330 mg, is built on a 9 mm×15 mm printed circuit board containing a nanofabricated neural probe, ASIC, and miniature connector. The epoxy encapsulating the ASIC is omitted to show the wire bonds connecting various components on the board. Scale bar, 1 mm. (B) Schematic illustrating the signal transduction path. Pre-amplification = 100x; amplification = 2x; filter = 1 to 6,400 Hz; multiplexing ratio = 32∶1. Note that only 6 wires are needed to operate the system in recording mode; the remaining wires are used for impedance, amplifier tests, and electroplating.
Figure 4 A fully integrated 64 channel recording system. (A) The system, weighing 330 mg, is built on a 9 mm×15 mm printed circuit board containing a nanofabricated neural probe, ASIC, and miniature connector. The epoxy encapsulating the ASIC is omitted to show the wire bonds connecting various components on the board. Scale bar, 1 mm. (B) Schematic illustrating the signal transduction path. Pre-amplification = 100x; amplification = 2x; filter = 1 to 6,400 Hz; multiplexing ratio = 32∶1. Note that only 6 wires are needed to operate the system in recording mode; the remaining wires are used for impedance, amplifier tests, and electroplating.CC BY · PubMed Central
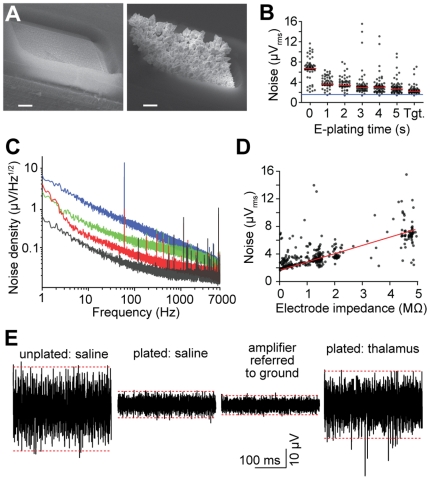
Figure 5 Low noise performance of the multiplexed recording system. (A) Scanning electron micrographs of 108 µm2 electrodes in their original fabricated state (left), and after gold electroplating to an impedance of 0.15 MΩ. Scale bars, 2 µm. (B) Root-mean-square noise of the electrophysiological recording system as a function of electroplating time. Measurements were performed in phosphate buffered saline. Tgt. denotes plating proceeded until a target impedance of 0.4 MΩ per channel was achieved. Signals correspond to the 0.1–6.5 kHz frequency band. Black points denote individual channels; red lines represent median value of 64 sites; the blue line corresponds to the input-referred noise floor of the amplifiers. (C) Amplifier noise spectral density of a 0 (black), 0.4 (red), 2.2 (green), and 4.9 MΩ (blue) impedance electrical connection to ground. (D) Root-mean-square noise in the 0.1–6.5 kHz band as a function of electrode impedance at 1 kHz. The red line is for illustration purposes. (E) Segments of single-site recordings under various electroplating and environmental conditions. Dashed red lines represent the 99.9th percentile range of the voltage. Unplated and plated electrodes have an impedance of 4.9 and 0.3 MΩ, respectively. The thalamic recording was carried out in a mouse under chloral hydrate anesthesia. Note that the noise level for a plated probe in thalamus is lower than that of an unplated probe in saline, in spite of background neural activity.
Figure 5 Low noise performance of the multiplexed recording system. (A) Scanning electron micrographs of 108 µm2 electrodes in their original fabricated state (left), and after gold electroplating to an impedance of 0.15 MΩ. Scale bars, 2 µm. (B) Root-mean-square noise of the electrophysiological recording system as a function of electroplating time. Measurements were performed in phosphate buffered saline. Tgt. denotes plating proceeded until a target impedance of 0.4 MΩ per channel was achieved. Signals correspond to the 0.1–6.5 kHz frequency band. Black points denote individual channels; red lines represent median value of 64 sites; the blue line corresponds to the input-referred noise floor of the amplifiers. (C) Amplifier noise spectral density of a 0 (black), 0.4 (red), 2.2 (green), and 4.9 MΩ (blue) impedance electrical connection to ground. (D) Root-mean-square noise in the 0.1–6.5 kHz band as a function of electrode impedance at 1 kHz. The red line is for illustration purposes. (E) Segments of single-site recordings under various electroplating and environmental conditions. Dashed red lines represent the 99.9th percentile range of the voltage. Unplated and plated electrodes have an impedance of 4.9 and 0.3 MΩ, respectively. The thalamic recording was carried out in a mouse under chloral hydrate anesthesia. Note that the noise level for a plated probe in thalamus is lower than that of an unplated probe in saline, in spite of background neural activity.CC BY · PubMed Central
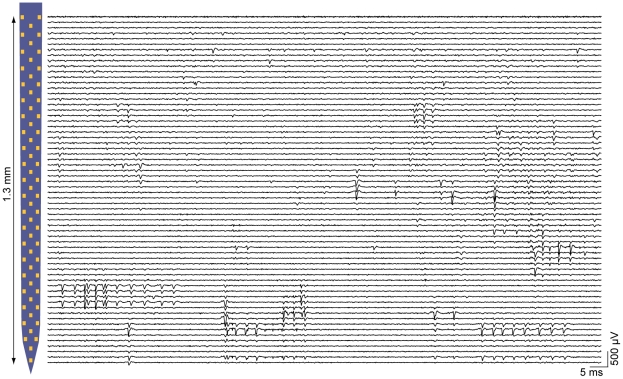
Figure 6 Parallel recording capabilities of the multiplexed electrophysiology system. Traces are filtered from 0.3–5 kHz to highlight spiking activity, and are plotted near their corresponding location on the shaft of the probe displayed on the left (for each horizontal left-right pair of pads, the trace for the left-hand pad appears just above the trace for the right-hand probe). Measurements were made in the mouse thalamus with a probe with post-plating impedances of 0.6±0.4 MΩ (mean±1 s.d.). The majority of sites report action potentials, and only one of the 64 sites (uppermost trace) is non-functional.
Figure 6 Parallel recording capabilities of the multiplexed electrophysiology system. Traces are filtered from 0.3–5 kHz to highlight spiking activity, and are plotted near their corresponding location on the shaft of the probe displayed on the left (for each horizontal left-right pair of pads, the trace for the left-hand pad appears just above the trace for the right-hand probe). Measurements were made in the mouse thalamus with a probe with post-plating impedances of 0.6±0.4 MΩ (mean±1 s.d.). The majority of sites report action potentials, and only one of the 64 sites (uppermost trace) is non-functional.CC BY · PubMed Central
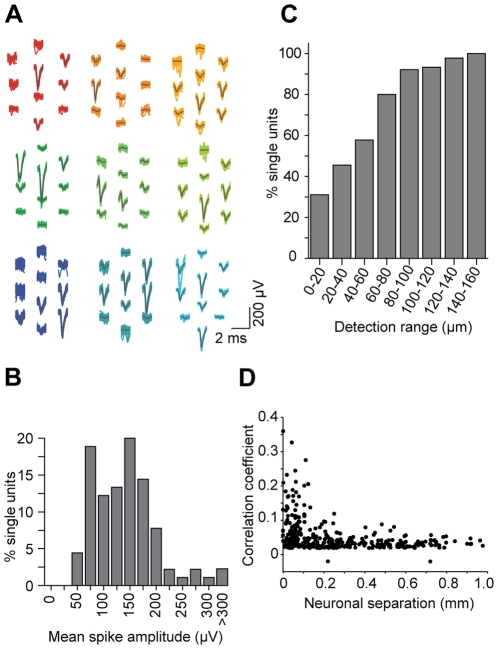
Figure 7 Nanofabricated probes facilitate high-density electrophysiological recordings. (A) Representative waveforms corresponding to putative single neurons. Gray lines denote the mean waveform. (B) Distribution of the maximum peak-to-peak amplitude per unit. The cutoff for reliable spike detection was 50 µV. (C) Cumulative distribution of the maximum distance across which a unit could be detected (defined as a mean spike-triggered waveform >50 µV). 31% of units were observed on only a single site; the remainder were measured on ≥2 recording sites, which have a nearest neighbor spacing of ∼40 µm. (D) Spike time cross-correlation coefficient from 54 simultaneously recorded putative thalamic units, as a function of estimated inter-somatic separation.
Figure 7 Nanofabricated probes facilitate high-density electrophysiological recordings. (A) Representative waveforms corresponding to putative single neurons. Gray lines denote the mean waveform. (B) Distribution of the maximum peak-to-peak amplitude per unit. The cutoff for reliable spike detection was 50 µV. (C) Cumulative distribution of the maximum distance across which a unit could be detected (defined as a mean spike-triggered waveform >50 µV). 31% of units were observed on only a single site; the remainder were measured on ≥2 recording sites, which have a nearest neighbor spacing of ∼40 µm. (D) Spike time cross-correlation coefficient from 54 simultaneously recorded putative thalamic units, as a function of estimated inter-somatic separation.CC BY · PubMed Central
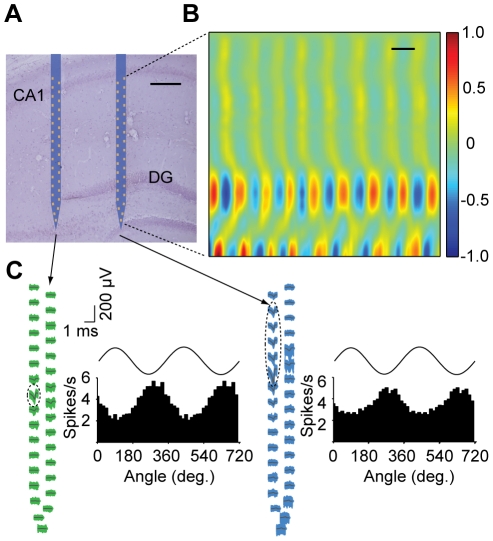
Figure 8 Electrophysiology with nanofabricated probes in awake behaving mice. (A) Nissl-stained brain section overlaid with a schematic of the probe at its stereotaxically implanted location. Each silicon shaft is 60 µm wide. Scale bar, 200 µm. (B) Current source density analysis of local field potentials across the hippocampus with a vertical resolution of ∼28 µm. Measurements correspond to the right-most shaft, which is co-localized with both the supra- and infra-pyramidal blades of the dentate gyrus (DG). The data were gathered during home cage exploratory behavior. The CSD is normalized to ±1. Scale bar, 100 ms. (C) Waveforms of two putative single units recorded from this probe across all sites on their entire respective shafts, with histograms showing theta phase locking of spikes. Dashed ellipses indicate the sites exhibiting the highest extracellular action potentials for these units. Measured theta oscillations on top of the histograms are for reference. Theta oscillations were measured from the upper right-most electrode near the CA1 pyramidal cell layer.
Figure 8 Electrophysiology with nanofabricated probes in awake behaving mice. (A) Nissl-stained brain section overlaid with a schematic of the probe at its stereotaxically implanted location. Each silicon shaft is 60 µm wide. Scale bar, 200 µm. (B) Current source density analysis of local field potentials across the hippocampus with a vertical resolution of ∼28 µm. Measurements correspond to the right-most shaft, which is co-localized with both the supra- and infra-pyramidal blades of the dentate gyrus (DG). The data were gathered during home cage exploratory behavior. The CSD is normalized to ±1. Scale bar, 100 ms. (C) Waveforms of two putative single units recorded from this probe across all sites on their entire respective shafts, with histograms showing theta phase locking of spikes. Dashed ellipses indicate the sites exhibiting the highest extracellular action potentials for these units. Measured theta oscillations on top of the histograms are for reference. Theta oscillations were measured from the upper right-most electrode near the CA1 pyramidal cell layer.CC BY · PubMed Central

Verification

Claims the paper makes

The claims and statistics of this paper haven’t been checked yet.

Run the check — free, no account needed. It reads the open-access text and checks the sources it cites.

A few free checks a day · papers already verified open instantly · results are public

Claims other papers make about this one

Each is checked against this paper’s own text: does it say what the citing paper says it does?

Self-check

Percentages, sums and reported differences re-computed from the paper’s own numbers.

The self-check needs the paper’s full text.

Citations

Cites

Show all 51 references

Cited by

Sorted by citations

See all 232

Metadata

Authors
Du, J., Blanche, T. J., Harrison, R. R., Lester, H. A., & Masmanidis, S. C.
Affiliations
  • California Institute of Technology (US)
  • University of California, Berkeley (US)
  • Intan Technologies (United States) (US)
Corresponding author
Masmanidis, Sotiris C.
Venue
PLoS ONE
Published
2011-10-12
Volume
6
Issue
10
Pages
e26204
ISSN
1932-6203 (ISSN-L)
OpenAlex
W2081826483
Cited by
231
References
51
Citations by year
2026: 6 · 2025: 15 · 2024: 6 · 2023: 14 · 2022: 10 · 2021: 21 · 2020: 19 · 2019: 14 · 2018: 19 · 2017: 19 · 2016: 28 · 2015: 19 · 2014: 16 · 2013: 20 · 2012: 5
FWCI
5.43
Type
journal article
Language
en
Open access
Locations
  • PLoS ONE (publishedVersion, cc-by)
  • Europe PMC (PubMed Central) (publishedVersion, cc-by)
  • PubMed Central (publishedVersion, cc-by)
  • PubMed (publishedVersion)
  • CaltechAUTHORS (California Institute of Technology) (submittedVersion, cc-by)
  • DOAJ (DOAJ: Directory of Open Access Journals) (submittedVersion, cc-by-sa)
  • eScholarship (California Digital Library) (submittedVersion)
  • eScholarship (California Digital Library) (submittedVersion, cc-by)
  • Figshare (submittedVersion, cc-by)
Funders
  • California Institute of Technology
  • National Institutes of Health (5r21ns066260-02, DA017279)
  • Kavli Nanoscience Institute, California Institute of Technology
  • National Institute on Drug Abuse (R01DA017279, DA017279)
  • National Institute of Neurological Disorders and Stroke (R21 NS066260, 5R21NS066260)
Topics
  • Life Sciences › Neuroscience › Cellular and Molecular Neuroscience › Neuroscience and Neural Engineering
  • Physical Sciences › Engineering › Electrical and Electronic Engineering › Analog and Mixed-Signal Circuit Design
  • Life Sciences › Neuroscience › Cognitive Neuroscience › Neural dynamics and brain function
Keywords
neural probes, extracellular recording, application-specific integrated circuits, silicon neural probe, implanted electrodes, freely moving animals
MeSH terms
Animals, Behavior, Animal, Electrodes, Male, Mice, Inbred C57BL, Neurons, Signal Processing, Computer-Assisted, Silicon, Temperature, Molecular Probes, Nanotechnology, Nanostructures, Mice, Electrophysiological Phenomena

About these checks

Registry, retraction, Cites and statistics results are computed, not judged, with one exception: a printed reference that no index lists is read once by a model before it counts as a citation error. Claims are extracted by a model and kept only when their quote appears verbatim in the text; each cited source is then checked, with a model’s help, for whether it says what the claim relies on. Those verdicts can be wrong — read the claim’s quote and the cited source before relying on one.

Statistics and arithmetic are recomputed, not judged.

Confidence bands are shown only for fields calibrated on our annotated test set. None is calibrated yet, so no band is shown.

What counts as a claim ›How we measure confidence ›How we check this ›

Are you an author, or do you see a problem with this page? Request a review