

The DOI matches its Crossref record; 47 of the 48 references it cites were found in a registry or an index.
Reducing the Effects of PCR Amplification and Sequencing Artifacts on 16S rRNA-Based Studies
Open accessAbstract
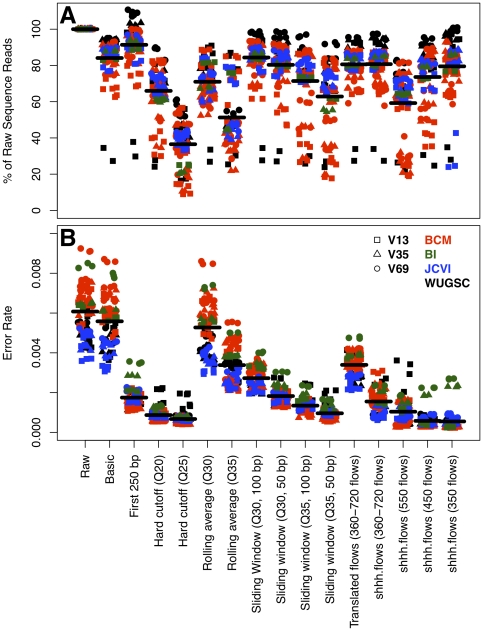
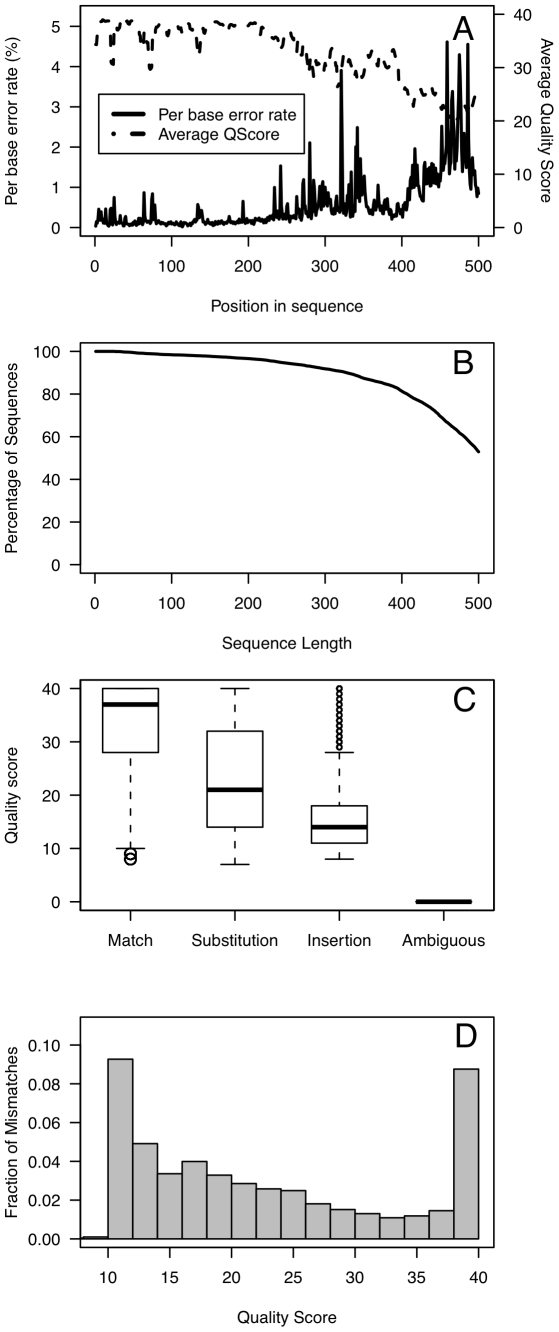
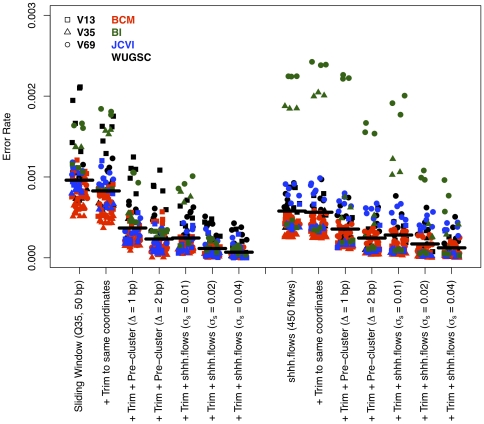
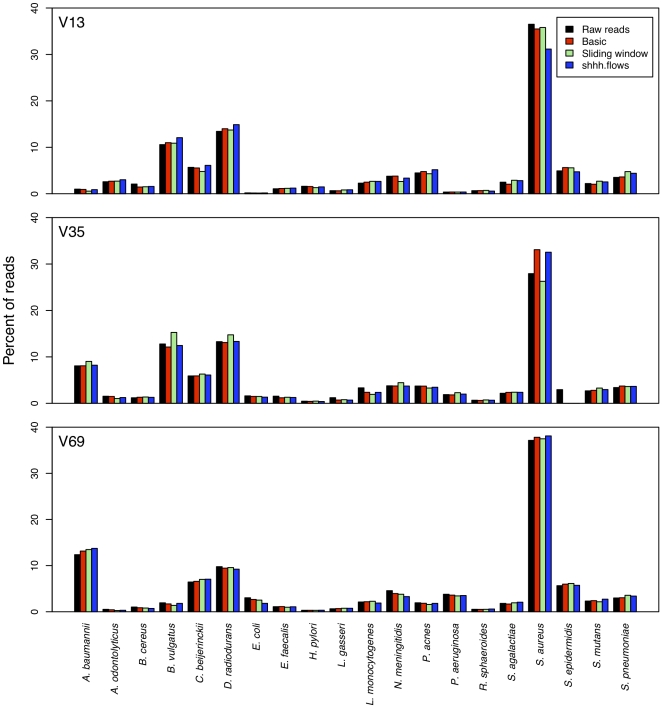
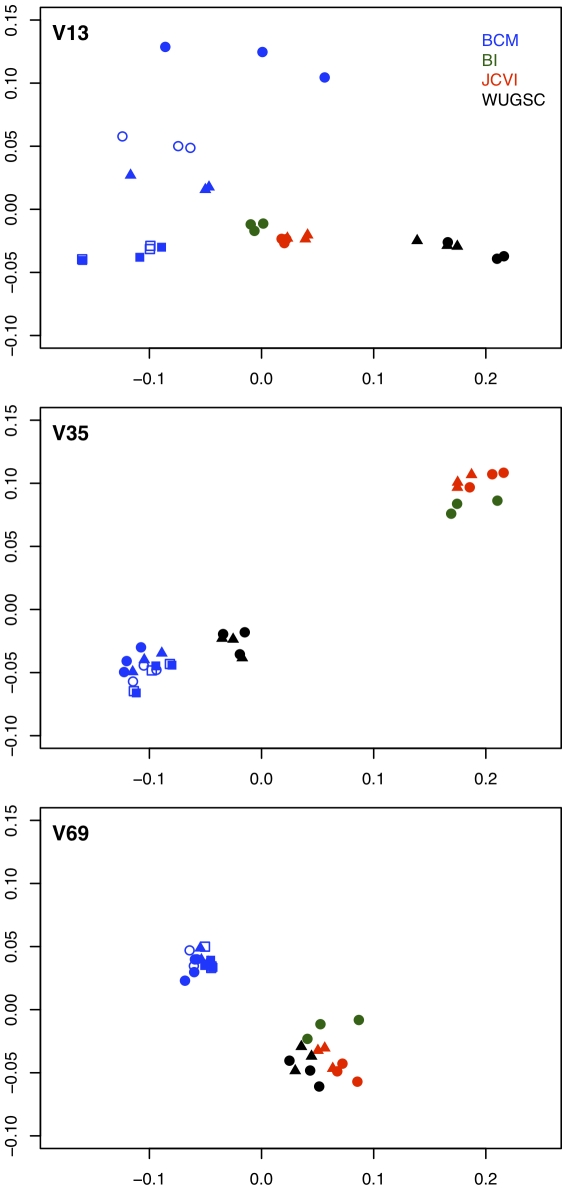
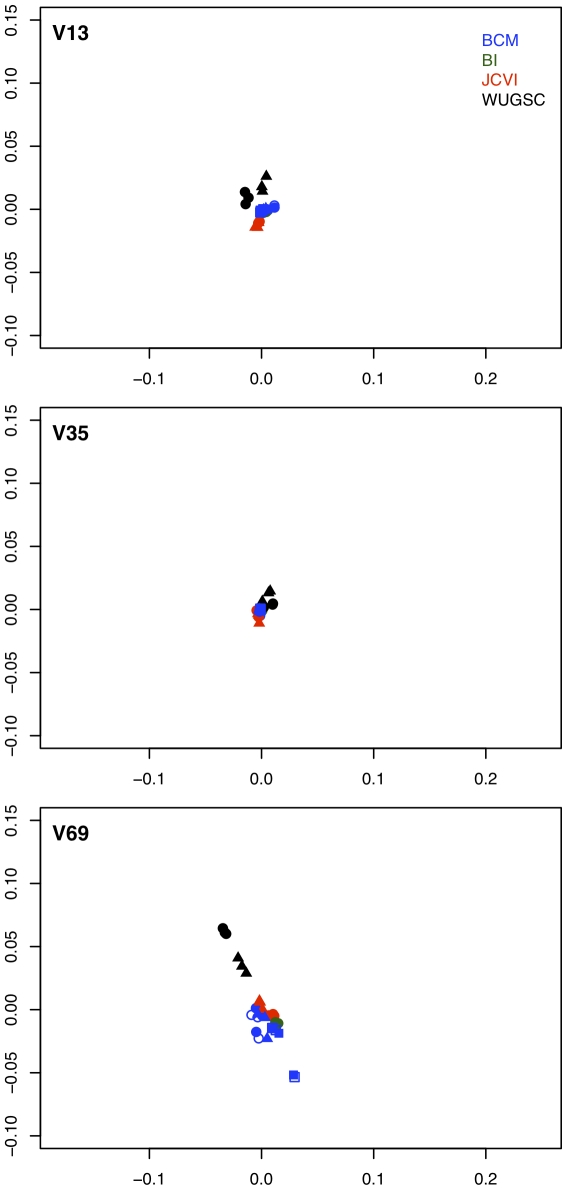
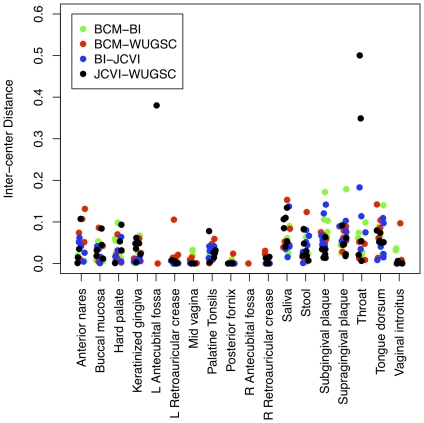
The advent of next generation sequencing has coincided with a growth in interest in using these approaches to better understand the role of the structure and function of the microbial communities in human, animal, and environmental health. Yet, use of next generation sequencing to perform 16S rRNA gene sequence surveys has resulted in considerable controversy surrounding the effects of sequencing errors on downstream analyses. We analyzed 2.7×10(6) reads distributed among 90 identical mock community samples, which were collections of genomic DNA from 21 different species with known 16S rRNA gene sequences; we observed an average error rate of 0.0060. To improve this error rate, we evaluated numerous methods of identifying bad sequence reads, identifying regions within reads of poor quality, and correcting base calls and were able to reduce the overall error rate to 0.0002. Implementation of the PyroNoise algorithm provided the best combination of error rate, sequence length, and number of sequences. Perhaps more problematic than sequencing errors was the presence of chimeras generated during PCR. Because we knew the true sequences within the mock community and the chimeras they could form, we identified 8% of the raw sequence reads as chimeric. After quality filtering the raw sequences and using the Uchime chimera detection program, the overall chimera rate decreased to 1%. The chimeras that could not be detected were largely responsible for the identification of spurious operational taxonomic units (OTUs) and genus-level phylotypes. The number of spurious OTUs and phylotypes increased with sequencing effort indicating that comparison of communities should be made using an equal number of sequences. Finally, we applied our improved quality-filtering pipeline to several benchmarking studies and observed that even with our stringent data curation pipeline, biases in the data generation pipeline and batch effects were observed that could potentially confound the interpretation of microbial community data.
Overview
The claims and statistics of this paper haven’t been checked yet.
Run the check — free, no account needed. It reads the open-access text and checks the sources it cites.
Integrity signals
Registry
Cites
Statistics
Figures
Verification
Claims the paper makes
The claims and statistics of this paper haven’t been checked yet.
Run the check — free, no account needed. It reads the open-access text and checks the sources it cites.
Claims other papers make about this one
Each is checked against this paper’s own text: does it say what the citing paper says it does?
The cited source says what the claim attributes to it.
In the citing paper
“Secondly, PCR introduces a bias in 16S tables, as some amplicon sequences will inevitably be amplified more efficiently than others (Acinas et al., 2005;Schloss et al., 2011) (Fig. 2).”
From The Microbiota-Gut-Brain Axis (2019) · cites this paper as Schloss et al., 2011
Self-check
Percentages, sums and reported differences re-computed from the paper’s own numbers.
The self-check needs the paper’s full text.
Citations
Cites
Naive Bayesian Classifier for Rapid Assignment of rRNA Sequences into the New Bacterial Taxonomy
Wang, Q., Garrity, G. M., Tiedje, J. M., & Cole, J. R. (2007) · Applied and Environmental Microbiology · doi:10.1128/aem.00062-07 · Cited by 20,145
Schloss, P. D., Westcott, S. L., Ryabin, T., Hall, J. R., Hartmann, M., Hollister, E. B., Lesniewski, R. A., Oakley, B. B., Parks, D. H., Robinson, C. J., et al. (2009) · Applied and Environmental Microbiology · doi:10.1128/aem.01541-09 · Cited by 19,549
Self-citationUCHIME improves sensitivity and speed of chimera detection
Edgar, R. C., Haas, B. J., Clemente, J. C., Quince, C., & Knight, R. (2011) · Bioinformatics · doi:10.1093/bioinformatics/btr381 · Cited by 15,114
A human gut microbial gene catalogue established by metagenomic sequencing
MetaHIT Consortium, Qin, J., Li, R., Raes, J., Arumugam, M., Burgdorf, K. S., Manichanh, C., Nielsen, T., Pons, N., Levenez, F., et al. (2010) · Nature · doi:10.1038/nature08821 · Cited by 11,624
Global patterns of 16S rRNA diversity at a depth of millions of sequences per sample
Caporaso, J. G., Lauber, C. L., Walters, W. A., Berg-Lyons, D., Lozupone, C., Turnbaugh, P. J., Fierer, N., & Knight, R. D. (2010) · Proceedings of the National Academy of Sciences · doi:10.1073/pnas.1000080107 · Cited by 9,944
Genome sequencing in microfabricated high-density picolitre reactors
Margulies, M., Egholm, M., Altman, W. E., Attiya, S., Bader, J. S., Bemben, L. A., Berka, J., Braverman, M. S., Chen, Y.-J., Chen, Z., et al. (2005) · Nature · doi:10.1038/nature03959 · Cited by 7,693
Measuring biological diversity
Magurran, A. E. (2004) · Choice Reviews Online · doi:10.5860/choice.42-1547 · Cited by 6,617
Turnbaugh, P. J., Ley, R. E., Hamady, M., Fraser-Liggett, C. M., Knight, R., & Gordon, J. I. (2007) · Nature · doi:10.1038/nature06244 · Cited by 6,091
Applied and Environmental Microbiology
(2018) · Applied and Environmental Microbiology · doi:10.1128/eissn.1098-5336 · Cited by 5,288
Measuring Biological Diversity
Reid, J. R. W. (2005) · Austral Ecology · doi:10.1111/j.1442-9993.2005.01502.x · Cited by 4,471
Research works printed but not linked: 1
- [7]Haenel H Schmidt EF Feldheim G 1959 Fecal dysbiosis in infancy. Z Kinderheilkd 82 595 603 13830809
Cited by
Sorted by citations
Items 701–800 of 1,002
The evolution of the gut microbiota in the giant and the red pandas
Li, Y., Guo, W., Han, S., Kong, F., Wang, C., Li, D., Zhang, H., Yang, M., Xu, H., Zeng, B., et al. (2015) · Scientific Reports · doi:10.1038/srep10185 · Cited by 53
Egea, E., David, B., Choné, T., Laurin, B., Féral, J., & Chenuil, A. (2015) · Molecular Phylogenetics and Evolution · doi:10.1016/j.ympev.2015.07.023 · Cited by 52
Bacterial communities in batch and continuous-flow wetlands treating the herbicide S-metolachlor
Elsayed, O. F., Maillard, E., Vuilleumier, S., & Imfeld, G. (2014) · The Science of The Total Environment · doi:10.1016/j.scitotenv.2014.08.048 · Cited by 52
Wang, C., Chen, Q., Wang, Q., Li, C.-H., Leng, Y.-Y., Li, S., Zhou, X., Han, W., Li, J.-G., Zhang, X., et al. (2014) · Food Research International · doi:10.1016/j.foodres.2014.05.017 · Cited by 52
Profiling Microbial Communities in Manganese Remediation Systems Treating Coal Mine Drainage
Chaput, D. L., Hansel, C. M., Burgos, W. D., & Santelli, C. M. (2015) · Applied and Environmental Microbiology · doi:10.1128/aem.03643-14 · Cited by 52
Xu, L., Lu, M., Xu, D., Chen, L., & Sun, J. (2016) · Journal of Insect Physiology · doi:10.1016/j.jinsphys.2016.09.014 · Cited by 52
Zhou, M., Guo, P., Wang, T., Gao, L., Yin, H., Cai, C., Gu, J., & Lü, X. (2017) · Biotechnology for Biofuels · doi:10.1186/s13068-017-0885-y · Cited by 52
Smith, H., Dieser, M., McKnight, D. M., SanClements, M., & Foreman, C. M. (2018) · FEMS Microbiology Ecology · doi:10.1093/femsec/fiy090 · Cited by 52
Zhang, L., Song, Y., Zuo, Y., Huo, S., Liang, C., & Hu, C. (2019) · Chemosphere · doi:10.1016/j.chemosphere.2018.12.168 · Cited by 52
Son, S. J., Koh, J. H., Park, M., Ryu, S., Lee, W. J., Yun, B., Lee, J. H., Oh, S., & Kim, Y. (2019) · Journal of Dairy Science · doi:10.3168/jds.2018-15013 · Cited by 52
Succession of Composition and Function of Soil Bacterial Communities During Key Rice Growth Stages
Wang, W., Luo, X. G., Yang, C., Ye, X., Wang, H., Cao, Z., Ran, W., & Cui, Z. (2019) · Frontiers in Microbiology · doi:10.3389/fmicb.2019.00421 · Cited by 52
Tatsika, S., Karamanoli, K., Karayanni, H., & Genitsaris, S. (2019) · Pathogens · doi:10.3390/pathogens8010037 · Cited by 52
Li, Q., Gu, P., Ji, X., Li, H., Zhang, J., & Zheng, Z. (2019) · Ecotoxicology and Environmental Safety · doi:10.1016/j.ecoenv.2019.109990 · Cited by 52
Cubillos, C. F., Aguilar, P., Grágeda, M., & Dorador, C. (2018) · Journal of Geophysical Research: Biogeosciences · doi:10.1029/2018jg004621 · Cited by 51
The Golden Goal of Soil Management: Disease-Suppressive Soils
Ságová‐Marečková, M., Omelka, M., & Kopecký, J. (2022) · Phytopathology · doi:10.1094/phyto-09-22-0324-kd · Cited by 51
Type I interferons have opposing effects during the emergence and recovery phases of colitis
Rauch, I., Hainzl, E., Rosebrock, F., Heider, S., Schwab, C., Berry, D., Stoiber, D., Wagner, M., Schleper, C., Loy, A., et al. (2014) · European Journal of Immunology · doi:10.1002/eji.201344401 · Cited by 51
Lange, A., Jost, S., Heider, D., Böck, C., Budeus, B., Schilling, E., Strittmatter, A. W., Boenigk, J., & Hoffmann, D. E. (2015) · PLoS ONE · doi:10.1371/journal.pone.0141590 · Cited by 51
Hassan, S. E., Bell, T. H., Stefani, F. O. P., Denis, D., Hijri, M., & St‐Arnaud, M. (2014) · PLoS ONE · doi:10.1371/journal.pone.0102838 · Cited by 51
Cui, Y., Suzuki, S., Omori, Y., Wong, S.-K., Ijichi, M., Kaneko, R., Kameyama, S., Tanimoto, H., & Hamasaki, K. (2015) · Applied and Environmental Microbiology · doi:10.1128/aem.03873-14 · Cited by 51
A novel conceptual approach to read-filtering in high-throughput amplicon sequencing studies
Puente‐Sánchez, F., Aguirre, J., & Parro, V. (2015) · Nucleic Acids Research · doi:10.1093/nar/gkv1113 · Cited by 51
Shao, J., He, Y., Zhang, H., Chen, A., Lei, M., Chen, J., Peng, L., & Gu, J. (2015) · Applied Microbiology and Biotechnology · doi:10.1007/s00253-015-7131-y · Cited by 51
Succession of biofilm communities responsible for biofouling of membrane bio-reactors (MBRs)
Luo, J., Lv, P., Zhang, J., Fane, A. G., McDougald, D., & Rice, S. A. (2017) · PLoS ONE · doi:10.1371/journal.pone.0179855 · Cited by 51
Weingarten, E. A., Atkinson, C. L., & Jackson, C. R. (2019) · PLoS ONE · doi:10.1371/journal.pone.0224796 · Cited by 51
Wang, W., Wang, N., Dang, K., Dai, W., Guan, L., Wang, B., Gao, J., Cui, Z., Dong, Y., & Wang, H. (2019) · The Science of The Total Environment · doi:10.1016/j.scitotenv.2019.135114 · Cited by 51
Combined toxic effects of anatoxin-a and microcystin-LR on submerged macrophytes and biofilms
Li, Q., Gu, P., Zhang, C., Luo, X., Zhang, H., Zhang, J., & Zheng, Z. (2020) · Journal of Hazardous Materials · doi:10.1016/j.jhazmat.2020.122053 · Cited by 51
Nieves, M., Partida‐Rodríguez, O., Moran, P. A., Serrano-Vázquez, A., Pérez-Juárez, H., Pérez‐Rodríguez, M., Arrieta, M., Ximénez-García, C., & Finlay, B. B. (2021) · Microbiology Spectrum · doi:10.1128/spectrum.00143-21 · Cited by 51
Kalenitchenko, D., Fagervold, S. K., Pruski, A. M., Vétion, G., Yücel, M., Bris, N. L., & Galand, P. E. (2015) · The ISME Journal · doi:10.1038/ismej.2015.61 · Cited by 51
Jones, A. C., Liao, T. S. V., Najar, F. Z., Roe, B. A., Hambright, K. D., & Caron, D. A. (2013) · Environmental Microbiology · doi:10.1111/1462-2920.12151 · Cited by 50
Jeon, Y.-S., Park, S., Lim, J., Chun, J., & Kim, B. S. (2015) · The Journal of Microbiology · doi:10.1007/s12275-015-4601-y · Cited by 50
Liu, W., Xi, X., Qimuge, S., Kwok, L., Guo, Z., Hou, Q., Menhe, B., Sun, T., & Zhang, H. (2015) · Annals of Microbiology · doi:10.1007/s13213-014-1013-x · Cited by 50
Ibarbalz, F. M., Pérez, M. V., Figuerola, E. L. M., & Erijman, L. (2014) · PLoS ONE · doi:10.1371/journal.pone.0099722 · Cited by 50
Goethem, M. W. V., Makhalanyane, T. P., Valverde, Á., Cary, S. C., & Cowan, D. A. (2016) · FEMS Microbiology Ecology · doi:10.1093/femsec/fiw051 · Cited by 50
Habtom, H. T., Demanèche, S., Dawson, L., Azulay, C., Matan, O., Robe, P., Gafny, R., Simonet, P., Jurkevitch, É., & Pasternak, Z. (2016) · Forensic Science International Genetics · doi:10.1016/j.fsigen.2016.10.005 · Cited by 50
Hydrological controls on glacially exported microbial assemblages
Dubnick, A. J., Kazemi, S., Sharp, M. J., Wadham, J. L., Hawkings, J. R., Beaton, A. D., & Lanoil, B. (2017) · Journal of Geophysical Research Biogeosciences · doi:10.1002/2016jg003685 · Cited by 50
Ferguson, R., Gontikaki, E., Anderson, J. A., & Witte, U. F. M. (2017) · Scientific Reports · doi:10.1038/s41598-017-02475-9 · Cited by 50
Kinross, J. K., Mirnezami, R., Alexander, J. L., Brown, R. C. D., Scott, A. J., Galea, D., Veselkov, K., Goldin, R. D., Darzi, A. W., Nicholson, J. K., et al. (2017) · Scientific Reports · doi:10.1038/s41598-017-08150-3 · Cited by 50
Chai, L., Dong, Z., Chen, A., & Wang, H. (2018) · Archives of Microbiology · doi:10.1007/s00203-018-1523-1 · Cited by 50
Fei, Z., Lijuan, Y., Xi, Y., Wu, W., Jing, Z., Da, M., & Han, S. (2019) · Gut Pathogens · doi:10.1186/s13099-019-0299-4 · Cited by 50
Al-Kamel, A., Baraniya, D., Alhajj, W. A., Halboub, E. S., Abdulrab, S., Chen, T., & Al-Hebshi, N. N. (2019) · Journal of Oral Microbiology · doi:10.1080/20002297.2019.1608141 · Cited by 50
Zhang, X., Fu, L., Deng, B., Quan, L., Zheng, J., Sun, J., Zhu, H., Peng, L., Wang, Y., Wenying, S., et al. (2013) · World Journal of Microbiology and Biotechnology · doi:10.1007/s11274-013-1327-z · Cited by 50
Liu, B., Hu, Y., Wang, Y., Xue, H., Li, Z., & Li, M. (2022) · Environmental Science and Pollution Research · doi:10.1007/s11356-022-20270-6 · Cited by 49
Changes in Chinese fir plantations root exudation strategies seasonally and as tree age
Chen, M., Yao, X., Cheng, H., Fan, A., Lin, R., Wang, X., Yang, Y., & Chen, G. (2023) · Forest Ecology and Management · doi:10.1016/j.foreco.2023.121239 · Cited by 49
Cohen, C., Toh, E. C., Munro, D. B., Dong, Q., & Hawlena, H. (2015) · The ISME Journal · doi:10.1038/ismej.2014.255 · Cited by 49
The interaction of Saccharomyces paradoxus with its natural competitors on oak bark
Kowallik, V., Miller, E. L., & Greig, D. (2015) · Molecular Ecology · doi:10.1111/mec.13120 · Cited by 49
Han, D., Kang, I., Ha, H. K., Kim, H., Kim, O.-S., Lee, B. Y., Cho, J., Hur, H., & Lee, Y. K. (2014) · PLoS ONE · doi:10.1371/journal.pone.0086887 · Cited by 49
Relationship between honeybee nutrition and their microbial communities
Saraiva, M. A., Zemolin, A. P. P., Franco, J. L., Boldo, J. T., Stefenon, V. M., Triplett, E. W., Camargo, F. A. D. O., & Roesch, L. F. W. (2015) · Antonie van Leeuwenhoek · doi:10.1007/s10482-015-0384-8 · Cited by 49
Cruaud, P., Vigneron, A., Pignet, P., Caprais, J., Lesongeur, F., Toffin, L. M. A. A., Godfroy, A., & Cambon‐Bonavita, M. (2015) · Frontiers in Marine Science · doi:10.3389/fmars.2015.00053 · Cited by 49
Considerations For Optimizing Microbiome Analysis Using a Marker Gene
de la Cuesta‐Zuluaga, J., & Escobar, J. S. (2016) · Frontiers in Nutrition · doi:10.3389/fnut.2016.00026 · Cited by 49
Experimental metagenomics and ribosomal profiling of the human skin microbiome
Ferretti, P., Farina, S., Cristofolini, M., Girolomoni, G., Tett, A., & Segata, N. (2016) · Experimental Dermatology · doi:10.1111/exd.13210 · Cited by 49
Panetta, J. L., Šíma, R., Calvani, N. E. D., Hajdušek, O., Chandra, S., Panuccio, J., & Šlapeta, J. R. (2017) · Parasites & Vectors · doi:10.1186/s13071-017-2579-5 · Cited by 49
The role of inflammation in temporal shifts in the inflammatory bowel disease mucosal microbiome
Kiely, C. J., Pavli, P., & O'Brien, C. L. (2018) · Gut Microbes · doi:10.1080/19490976.2018.1448742 · Cited by 49
Wang, J., Zhong, Q., Yang, Y., Li, H., Wang, L., Tong, Y., Fang, X., & Liao, Z. (2018) · Frontiers in Microbiology · doi:10.3389/fmicb.2018.01053 · Cited by 49
Zhang, W., Zhou, Y., Jeppesen, E., Wang, L., Tan, H., & Zhang, J. (2019) · The Science of The Total Environment · doi:10.1016/j.scitotenv.2019.05.055 · Cited by 49
Li, Q., Gu, P., Zhang, H., Luo, X., Zhang, J., & Zheng, Z. (2019) · The Science of The Total Environment · doi:10.1016/j.scitotenv.2019.134325 · Cited by 49
Hill-based dissimilarity indices and null models for analysis of microbial community assembly
Modin, O., Liébana, R., Alam, S. S., Wilén, B., Suarez, C., Hermansson, M., & Persson, F. (2020) · Microbiome · doi:10.1186/s40168-020-00909-7 · Cited by 49
Tang, X., Li, L., Shao, K., Wang, B., Cai, X., Zhang, L., Chao, J., & Gao, G. (2014) · Canadian Journal of Microbiology · doi:10.1139/cjm-2014-0503 · Cited by 49
Liu, G., Li, T., Zhu, X., Zhang, X., & Wang, J. (2023) · Frontiers in Microbiology · doi:10.3389/fmicb.2023.1178744 · Cited by 48
Maspolim, Y., Zhou, Y., Guo, C., Xiao, K., & Ng, W. J. (2015) · Journal of Environmental Sciences · doi:10.1016/j.jes.2015.02.017 · Cited by 48
Winter–Summer Succession of Unicellular Eukaryotes in a Meso-eutrophic Coastal System
Christaki, U., Kormas, K. A., Genitsaris, S., Georges, C., Sime‐Ngando, T., Viscogliosi, É., & Monchy, S. (2013) · Microbial Ecology · doi:10.1007/s00248-013-0290-4 · Cited by 48
Characterization of Microbial Communities in Household Washing Machines
Nix, I. D., Frontzek, A., & Bockmühl, D. P. (2015) · Tenside Surfactants Detergents · doi:10.3139/113.110394 · Cited by 48
Preterm gut microbiota and metabolome following discharge from intensive care
Stewart, C. J., Skeath, T., Nelson, A., Fernstad, S. J., Marrs, E. C. L., Perry, J. D., Cummings, S. P., Berrington, J. E., & Embleton, N. D. (2015) · Scientific Reports · doi:10.1038/srep17141 · Cited by 48
Ma, Y., Duan, S., Zhang, D., Su, X., Zhang, D., Lv, C., & Zhao, M. (2017) · Applied Sciences · doi:10.3390/app7020166 · Cited by 48
Legume–rhizobium symbiotic promiscuity and effectiveness do not affect plant invasiveness
Keet, J., Ellis, A. G., Hui, C., & Roux, J. J. L. (2017) · Annals of Botany · doi:10.1093/aob/mcx028 · Cited by 48
Zhang, Z., Wang, X., Han, S., Liu, C., & Liu, F. (2018) · International Journal of Biological Macromolecules · doi:10.1016/j.ijbiomac.2018.01.192 · Cited by 48
Unique subgingival microbiota associated with periodontitis in cirrhosis patients
Jensen, A., Grønkjær, L. L., Holmstrup, P., Vilstrup, H., & Kilian, M. (2018) · Scientific Reports · doi:10.1038/s41598-018-28905-w · Cited by 48
The Effects of Unfermented and Fermented Cow and Sheep Milk on the Gut Microbiota
Rettedal, E. A., Altermann, E., Roy, N. C., & Dalziel, J. E. (2019) · Frontiers in Microbiology · doi:10.3389/fmicb.2019.00458 · Cited by 48
Ren, F., Dong, W., & Yan, D. (2019) · Microorganisms · doi:10.3390/microorganisms7090322 · Cited by 48
Yang, X., Pan, Y., Wu, W., Quan, Q., Jing, Z., Jiamin, X., & Han, S. (2019) · Journal of Translational Medicine · doi:10.1186/s12967-019-2102-1 · Cited by 48
Zhang, Z., Huang, M., Qiu, L., Song, R., Zhang, Z., Ding, Y., Zhou, X. Y., Zhang, X., & Zheng, H. (2020) · Insect Science · doi:10.1111/1744-7917.12770 · Cited by 48
Gut Microbiota of Five Sympatrically Farmed Marine Fish Species in the Aegean Sea
Nikouli, E., Meziti, A., Smeti, E., Antonopoulou, E., Mente, E., & Kormas, K. A. (2020) · Microbial Ecology · doi:10.1007/s00248-020-01580-z · Cited by 48
Duan, Y., Chen, H., Wang, J.-L., Zeng, S., Wang, Y., Mo, Z., Dan, X., & Li, Y. (2021) · Aquaculture · doi:10.1016/j.aquaculture.2021.736885 · Cited by 48
Wang, Y., Wang, C., Chen, Y., Zhang, D., Zhao, M., Li, H., & Guo, P. (2021) · Frontiers in Microbiology · doi:10.3389/fmicb.2021.669570 · Cited by 48
Sun, W., & Zheng, Z. (2022) · Chemosphere · doi:10.1016/j.chemosphere.2022.135100 · Cited by 48
Microbial diversity and metabolite composition of Belgian red-brown acidic ales
Snauwaert, I., Roels, S. P., Nieuwerburgh, F. V., LANDSCHOOT, A. V., Vuyst, L. D., & Vandamme, P. A. R. (2016) · International Journal of Food Microbiology · doi:10.1016/j.ijfoodmicro.2015.12.009 · Cited by 48
The microbiome of the human lower airways: a next generation sequencing perspective
Aho, V. T. E., Pereira, P. A. B., Haahtela, T., Pawankar, R., Auvinen, P., & Koskinen, K. (2015) · World Allergy Organization Journal · doi:10.1186/s40413-015-0074-z · Cited by 47
Forensic Microbiology: When, Where and How
Nodari, R., Arghittu, M., Bailo, P., Cattaneo, C., Creti, R., D’Aleo, F., Saegeman, V., Franceschetti, L., Novati, S., Fernández-Rodríguez, A., et al. (2024) · Microorganisms · doi:10.3390/microorganisms12050988 · Cited by 47
Dynamics of tongue microbial communities with single-nucleotide resolution using oligotyping
Welch, J. L. M., Utter, D. R., Rossetti, B. J., Welch, D. B. M., Eren, A. M., & Borisy, G. G. (2014) · Frontiers in Microbiology · doi:10.3389/fmicb.2014.00568 · Cited by 47
Tkachuk, V. L., Krause, D. O., Knox, N., Hamm, A. C., Zvomuya, F., Ominski, K., & McAllister, T. A. (2014) · Journal of Applied Microbiology · doi:10.1111/jam.12449 · Cited by 47
RNA-Based Assessment of Diversity and Composition of Active Archaeal Communities in the German Bight
Wemheuer, B., Wemheuer, F., & Daniel, R. (2012) · Archaea · doi:10.1155/2012/695826 · Cited by 47
Tracking Strains in the Microbiome: Insights from Metagenomics and Models
Brito, I., & Alm, E. J. (2016) · Frontiers in Microbiology · doi:10.3389/fmicb.2016.00712 · Cited by 47
Investigation of sinonasal microbiome spatial organization in chronic rhinosinusitis
Ramakrishnan, V. R., Gitomer, S. A., Kofonow, J. M., Robertson, C. E., & Frank, D. N. (2016) · International Forum of Allergy & Rhinology · doi:10.1002/alr.21854 · Cited by 47
Simon, A., Hervé, V., Al-Dourobi, A., Verrecchia, É. P., & Junier, P. (2016) · FEMS Microbiology Ecology · doi:10.1093/femsec/fiw217 · Cited by 47
Montalban‐Arques, A., Wurm, P., Trajanoski, S., Schauer, S., Kienesberger, S., Halwachs, B., Högenauer, C., Langner, C., & Gorkiewicz, G. (2016) · The Journal of Pathology · doi:10.1002/path.4782 · Cited by 47
do Valle, D. R., Albuquerque, P. H. M., Zhao, Q., Barberán, A., & Fletcher, R. J. (2018) · Global Change Biology · doi:10.1111/gcb.14412 · Cited by 47
Jiao, N., Song, X., Song, R., Yin, D., & Deng, X. (2022) · PeerJ · doi:10.7717/peerj.12778 · Cited by 47
Lavecchia, A., Curci, M., Jangid, K., Whitman, W. B., Ricciuti, P., Pascazio, S., & Crecchio, C. (2015) · Biology and Fertility of Soils · doi:10.1007/s00374-015-1017-0 · Cited by 47
Phylogenetics and the Human Microbiome
Matsen, F. A., IV (2014) · Systematic Biology · doi:10.1093/sysbio/syu053 · Cited by 47
Environmental DNA analysis for macro-organisms: species distribution and more
Minamoto, T. (2022) · DNA Research · doi:10.1093/dnares/dsac018 · Cited by 46
Jiang, S., Zhang, W., Qian, X., Ji, J., Ning, X., Zhu, F., Yin, S., & Zhang, K. (2023) · Aquatic Toxicology · doi:10.1016/j.aquatox.2023.106556 · Cited by 46
Hambäck, P. A., Weingartner, E., Dalén, L., Wirta, H., & Roslin, T. V. (2016) · Ecology and Evolution · doi:10.1002/ece3.2536 · Cited by 46
Cao, X., Wang, J., Liao, J., Gao, Z., Jiang, D., Sun, J., Zhao, L., Huang, Y., & Luan, S. (2016) · The Science of The Total Environment · doi:10.1016/j.scitotenv.2016.11.143 · Cited by 46
Rissanen, A. J., Karvinen, A., Nykänen, H., Peura, S., Tiirola, M., Mäki, A., & Kankaala, P. (2017) · FEMS Microbiology Ecology · doi:10.1093/femsec/fix078 · Cited by 46
Qin, K., Struewing, I. T., Domingo, J. W. S., Lytle, D. A., & Lu, J. (2017) · Pathogens · doi:10.3390/pathogens6040054 · Cited by 46
Xie, X., Liu, N., Ping, J., Zhang, Q., Zheng, X., & Liu, J. (2018) · Chemosphere · doi:10.1016/j.chemosphere.2018.03.025 · Cited by 46
Li, Y., Chen, X.-H., Xie, Z.-X., Li, D., Wu, P., Kong, L., Lin, L., Kao, S., & Wang, D. (2018) · Frontiers in Microbiology · doi:10.3389/fmicb.2018.00797 · Cited by 46
Tsolcha, O. N., Tekerlekopoulou, A. G., Akratos, C. S., Aggelis, G., Genitsaris, S., Moustaka-Gouni, M. T., & Vayenas, D. V. (2018) · Water · doi:10.3390/w10111693 · Cited by 46
Yang, Y., Wang, P., & Zeng, Z. (2019) · Agronomy · doi:10.3390/agronomy9010014 · Cited by 46
Meng, F., Liu, D., Pan, Y., Xi, L., Yang, D., & Huang, W. (2018) · BioResources · doi:10.15376/biores.14.1.139-165 · Cited by 46
Zhong, C., Li, J., Flynn, S. L., Nesbø, C. L., Sun, C., von Gunten, K., Lanoil, B., Goss, G. G., Martin, J. W., & Alessi, D. S. (2019) · ACS Earth and Space Chemistry · doi:10.1021/acsearthspacechem.9b00037 · Cited by 46
Land Cover of Early-Life Environment Modulates the Risk of Type 1 Diabetes
Nurminen, N., Cerrone, D., Lehtonen, J., Parajuli, A., Roslund, M. I., Lönnrot, M., Ilonen, J., Toppari, J., Veijola, R., Knip, M., et al. (2021) · Diabetes Care · doi:10.2337/dc20-1719 · Cited by 46
Metadata
- Authors
- Schloss, P. D., Gevers, D., & Westcott, S. L.
- Affiliations
- University of Michigan (US)
- Broad Institute (US)
- Corresponding author
- Schloss, Patrick D.
- Venue
- PLoS ONE
- Publisher
- Public Library of Science (PLoS)
- Published
- 2011-12-14
- Volume
- 6
- Issue
- 12
- Pages
- e27310
- ISSN
- 1932-6203 (ISSN-L)
- PMC
- PMC3237409
- OpenAlex
- W2103412200
- Cited by
- 2,112
- References
- 48
- Citations by year
- 2026: 34 · 2025: 58 · 2024: 77 · 2023: 69 · 2022: 115 · 2021: 139 · 2020: 153 · 2019: 188 · 2018: 224 · 2017: 208 · 2016: 238 · 2015: 231 · 2014: 190 · 2013: 130 · 2012: 56
- FWCI
- 49.00
- Type
- journal article
- Language
- en
- Open access
- gold
- doi.org
- Locations
- PLoS ONE (publishedVersion, cc-by)
- PubMed Central (publishedVersion, cc-by)
- PubMed (publishedVersion)
- DOAJ (DOAJ: Directory of Open Access Journals) (submittedVersion, cc-by-sa)
- DSpace@MIT (Massachusetts Institute of Technology) (submittedVersion, cc-by-nc)
- Funders
- National Science Foundation (0743432)
- University of Michigan
- National Human Genome Research Institute (R01HG005975, U54HG004969, NIHU54HG004969)
- Topics
- Life Sciences › Biochemistry, Genetics and Molecular Biology › Molecular Biology › Genomics and Phylogenetic Studies
- Physical Sciences › Environmental Science › Ecology › Microbial Community Ecology and Physiology
- Physical Sciences › Environmental Science › Ecology › Environmental DNA in Biodiversity Studies
- Keywords
- 16S rRNA gene sequencing, sequencing errors, mock microbial community, error rate, quality filtering, operational taxonomic units, batch effects, microbial community analysis
- MeSH terms
- Algorithms, Base Sequence, DNA, Bacterial, Humans, Phylogeny, RNA, Ribosomal, 16S, Cluster Analysis, Polymerase Chain Reaction, Sequence Alignment, Artifacts, Sequence Analysis, DNA, DNA Primers, Biodiversity, Metagenome
About these checks
Registry, retraction, Cites and statistics results are computed, not judged, with one exception: a printed reference that no index lists is read once by a model before it counts as a citation error. Claims are extracted by a model and kept only when their quote appears verbatim in the text; each cited source is then checked, with a model’s help, for whether it says what the claim relies on. Those verdicts can be wrong — read the claim’s quote and the cited source before relying on one.
Statistics and arithmetic are recomputed, not judged.
Confidence bands are shown only for fields calibrated on our annotated test set. None is calibrated yet, so no band is shown.
What counts as a claim ›How we measure confidence ›How we check this ›
Are you an author, or do you see a problem with this page? Request a review
