Cited by 541Cancer, Hypoxia, and MetabolismAngiogenesis and VEGF in CancerLymphatic System and Diseases

The DOI matches its Crossref record; 67 of the 67 references it cites were found in a registry or an index.

Targeting the Lactate Transporter MCT1 in Endothelial Cells Inhibits Lactate-Induced HIF-1 Activation and Tumor Angiogenesis

Open access

Abstract

Switching to a glycolytic metabolism is a rapid adaptation of tumor cells to hypoxia. Although this metabolic conversion may primarily represent a rescue pathway to meet the bioenergetic and biosynthetic demands of proliferating tumor cells, it also creates a gradient of lactate that mirrors the gradient of oxygen in tumors. More than a metabolic waste, the lactate anion is known to participate to cancer aggressiveness, in part through activation of the hypoxia-inducible factor-1 (HIF-1) pathway in tumor cells. Whether lactate may also directly favor HIF-1 activation in endothelial cells (ECs) thereby offering a new druggable option to block angiogenesis is however an unanswered question. In this study, we therefore focused on the role in ECs of monocarboxylate transporter 1 (MCT1) that we previously identified to be the main facilitator of lactate uptake in cancer cells. We found that blockade of lactate influx into ECs led to inhibition of HIF-1-dependent angiogenesis. Our demonstration is based on the unprecedented characterization of lactate-induced HIF-1 activation in normoxic ECs and the consecutive increase in vascular endothelial growth factor receptor 2 (VEGFR2) and basic fibroblast growth factor (bFGF) expression. Furthermore, using a variety of functional assays including endothelial cell migration and tubulogenesis together with in vivo imaging of tumor angiogenesis through intravital microscopy and immunohistochemistry, we documented that MCT1 blockers could act as bona fide HIF-1 inhibitors leading to anti-angiogenic effects. Together with the previous demonstration of MCT1 being a key regulator of lactate exchange between tumor cells, the current study identifies MCT1 inhibition as a therapeutic modality combining antimetabolic and anti-angiogenic activities.

Overview

The claims and statistics of this paper haven’t been checked yet.

Run the check — free, no account needed. It reads the open-access text and checks the sources it cites.

A few free checks a day · papers already verified open instantly · results are public

Integrity signals

Registry

Crossref · 10.1371/journal.pone.0033418

Cites

67 of 67 references verified0 citation errors · 0 not checkable

Statistics

Figures

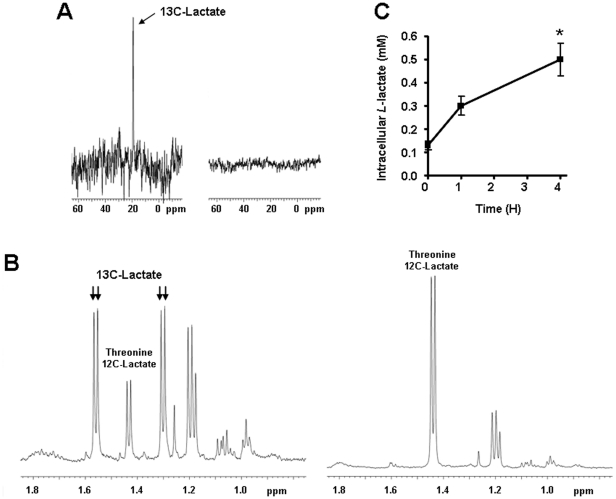
Figure 1 Endothelial cells import exogenous lactate. (A and B) HUVECs were incubated during 6-h with 10 mM of 13C-methy-labeled sodium lactate (left panels) or 10 mM of 12C sodium lactate (right panels). 13C-lactate was detected using nuclear magnetic resonance (NMR) in cell lysates. (A) In 13C NMR spectra, a 13C-Lactate peak is detected at 19 ppm. (B) In 1H NMR spectra, the methyl doublets at 1.56 and 1.30 ppm arise from 13C-lactate whereas the doublet at 1.43 ppm arises from a coincidental overlap of endogenous 12C-Lactate and threonine. (C) HUVECs were incubated with 10 mM sodium L-lactate. L-Lactate was detected using an enzymatic assay in the lysate of cells collected at different time points. *p<0.05; n = 4. Error bars reflect mean ± SEM.
Figure 1 Endothelial cells import exogenous lactate. (A and B) HUVECs were incubated during 6-h with 10 mM of 13C-methy-labeled sodium lactate (left panels) or 10 mM of 12C sodium lactate (right panels). 13C-lactate was detected using nuclear magnetic resonance (NMR) in cell lysates. (A) In 13C NMR spectra, a 13C-Lactate peak is detected at 19 ppm. (B) In 1H NMR spectra, the methyl doublets at 1.56 and 1.30 ppm arise from 13C-lactate whereas the doublet at 1.43 ppm arises from a coincidental overlap of endogenous 12C-Lactate and threonine. (C) HUVECs were incubated with 10 mM sodium L-lactate. L-Lactate was detected using an enzymatic assay in the lysate of cells collected at different time points. *p<0.05; n = 4. Error bars reflect mean ± SEM.CC BY · PubMed Central
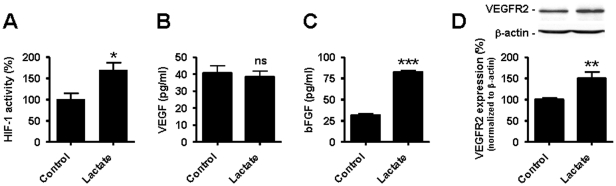
Figure 2 Lactate activates HIF-1 in normoxic endothelial cells. HUVECs were incubated during 24-h with 10 mM lactate or not. (A) The transcriptional activity of HIF-1 was determined using a dual luciferase reporter assay in HUVECs. *p = 0.0207; n = 4. (B) VEGF protein level was measured using ELISA in the supernatant of cells. ns, non-significant; n = 6. (C) bFGF protein level was measured using ELISA in the supernatant of cells. ***p<0.0001; n = 5. (D) VEGFR2 protein expression was detected by western blot in cell lysates. **p = 0.0084; n = 4–5. (A–D) Error bars reflect mean ± SEM.
Figure 2 Lactate activates HIF-1 in normoxic endothelial cells. HUVECs were incubated during 24-h with 10 mM lactate or not. (A) The transcriptional activity of HIF-1 was determined using a dual luciferase reporter assay in HUVECs. *p = 0.0207; n = 4. (B) VEGF protein level was measured using ELISA in the supernatant of cells. ns, non-significant; n = 6. (C) bFGF protein level was measured using ELISA in the supernatant of cells. ***p<0.0001; n = 5. (D) VEGFR2 protein expression was detected by western blot in cell lysates. **p = 0.0084; n = 4–5. (A–D) Error bars reflect mean ± SEM.CC BY · PubMed Central
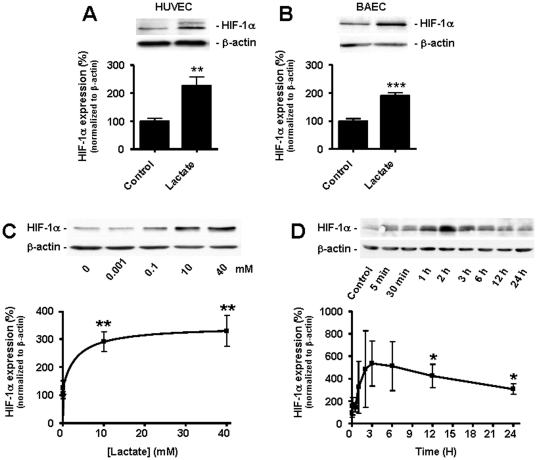
Figure 3 Lactate induces an increase in HIF-1α protein expression in normoxic endothelial cells. HIF-1α protein expression was detected by western blot in normoxic ECs. (A) HUVECs were incubated during 24-h with 10 mM lactate or not. **p = 0.0014; n = 8. (B) as in (A) but with BAECs. ***p<0.0001; n = 16–17. (C) BAECs were incubated during 24-h with the indicated concentrations of lactate. **p<0.01; n = 4. (D) BAECs were incubated during the indicated times with 10 mM of lactate. *p<0.05; n = 5–12. (A–D) Error bars reflect mean ± SEM.
Figure 3 Lactate induces an increase in HIF-1α protein expression in normoxic endothelial cells. HIF-1α protein expression was detected by western blot in normoxic ECs. (A) HUVECs were incubated during 24-h with 10 mM lactate or not. **p = 0.0014; n = 8. (B) as in (A) but with BAECs. ***p<0.0001; n = 16–17. (C) BAECs were incubated during 24-h with the indicated concentrations of lactate. **p<0.01; n = 4. (D) BAECs were incubated during the indicated times with 10 mM of lactate. *p<0.05; n = 5–12. (A–D) Error bars reflect mean ± SEM.CC BY · PubMed Central
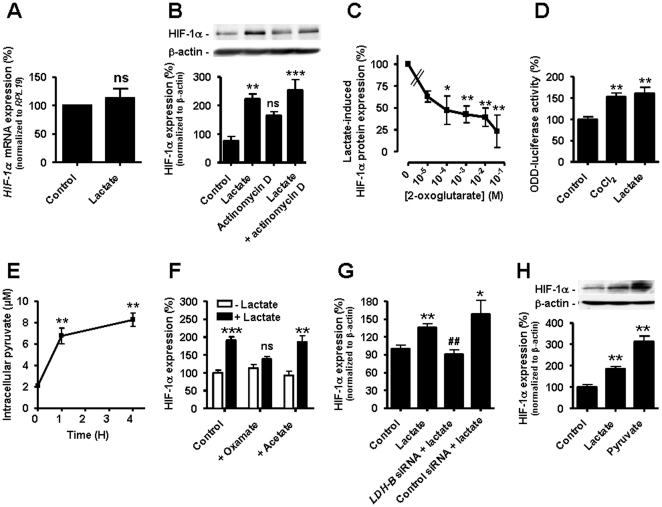
Figure 4 Lactate triggers HIF-1 induction in normoxic endothelial cells. Lactate was used at 10 mM for 24-h. (A) HIF-1α mRNA was detected using qRT-PCR in HUVECs incubated with lactate. ns, non-significant; n = 4. (B and C). HIF-1α protein expression was detected by western blot in BAECs incubated with lactate and/or (B) 5 µg/ml Actinomycin D (**p<0.01, ***p<0.005, ns, non-significant compared to control, n = 3–4); (C) increasing concentrations of 2-oxoglutarate. *p<0.05, **p<0.01; n = 5–6. (D) ODD-driven luciferase activity was assessed in HUVECs incubated with 150 µM CoCl2 or lactate. **p<0.01; n = 5. (E) Intracellular pyruvate was detected using an enzymatic assay in HUVECs incubated with lactate. **p<0.01; n = 4. (F–H) HIF-1α protein expression was detected by western blot. (F) BAECs were incubated with lactate, oxamate (10 mM), and/or acetate (10 mM). **p<0.01, ***p<0.005, ns, non-significant compared to control cells without lactate; n = 4–16. (G) HUVECs transfected with the indicated siRNA were incubated with lactate. *p = 0.0170, **p = 0.0019 compared to control; ## p = 0.0056 compared to lactate alone; n = 3–9. (H) BAECs were incubated with pyruvate (10 mM), lactate, or not. **p<0.01 compared to control; n = 3–19. (A–H) Error bars reflect mean ± SEM.
Figure 4 Lactate triggers HIF-1 induction in normoxic endothelial cells. Lactate was used at 10 mM for 24-h. (A) HIF-1α mRNA was detected using qRT-PCR in HUVECs incubated with lactate. ns, non-significant; n = 4. (B and C). HIF-1α protein expression was detected by western blot in BAECs incubated with lactate and/or (B) 5 µg/ml Actinomycin D (**p<0.01, ***p<0.005, ns, non-significant compared to control, n = 3–4); (C) increasing concentrations of 2-oxoglutarate. *p<0.05, **p<0.01; n = 5–6. (D) ODD-driven luciferase activity was assessed in HUVECs incubated with 150 µM CoCl2 or lactate. **p<0.01; n = 5. (E) Intracellular pyruvate was detected using an enzymatic assay in HUVECs incubated with lactate. **p<0.01; n = 4. (F–H) HIF-1α protein expression was detected by western blot. (F) BAECs were incubated with lactate, oxamate (10 mM), and/or acetate (10 mM). **p<0.01, ***p<0.005, ns, non-significant compared to control cells without lactate; n = 4–16. (G) HUVECs transfected with the indicated siRNA were incubated with lactate. *p = 0.0170, **p = 0.0019 compared to control; ## p = 0.0056 compared to lactate alone; n = 3–9. (H) BAECs were incubated with pyruvate (10 mM), lactate, or not. **p<0.01 compared to control; n = 3–19. (A–H) Error bars reflect mean ± SEM.CC BY · PubMed Central
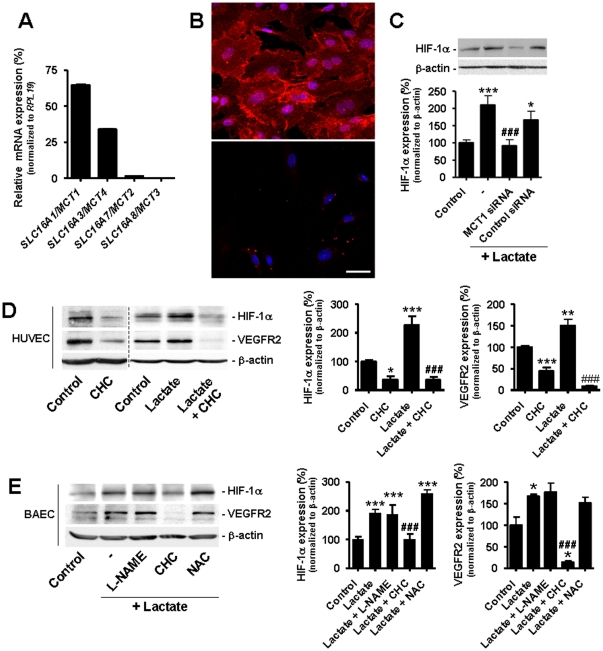
Figure 5 Targeting MCT1 inhibits lactate-induced HIF-1 activation in normoxic endothelial cells. (A) Relative mRNA expression was determined in confluent HUVECs using quantitative RT-PCR. n = 3. Error bars reflect mean ± SEM. (B) Immunostaining showing the membrane expression of MCT1 in HUVECs (upper panel) and negative control (lower panel, omission of primary antibody). Bar = 40 µm. (C) HUVECs transfected with the indicated siRNA were incubated during 24-h with 10 mM lactate or not. HIF-1α protein expression was detected by western blot. *p<0.05, ***p<0.005 compared to control; ### p<0.005 compared lactate alone; n = 6–14. (D and E) HIF-1α and VEGFR2 protein expression was detected by western blot. (D) HUVECs were incubated during 24-h with 10 mM lactate and/or 5 mM α-cyano-4-hydroxycinnamate (CHC). *p<0.05, **p<0.01, ***p<0.005 compared to control; ### p<0.005 compared to lactate alone; n = 3–12. (E) BAECs were incubated during 24-h with 10 mM lactate, 5 mM N ω-nitro-L-arginine methyl ester (L-NAME), 5 mM α-cyano-4-hydroxycinnamate (CHC), and/or 5 mM N-acetyl-L-cysteine (NAC). *p<0.01, ***p<0.005 compared to control; ### p<0.005 compared to lactate alone; n = 3–14. (C–E) Error bars reflect mean ± SEM.
Figure 5 Targeting MCT1 inhibits lactate-induced HIF-1 activation in normoxic endothelial cells. (A) Relative mRNA expression was determined in confluent HUVECs using quantitative RT-PCR. n = 3. Error bars reflect mean ± SEM. (B) Immunostaining showing the membrane expression of MCT1 in HUVECs (upper panel) and negative control (lower panel, omission of primary antibody). Bar = 40 µm. (C) HUVECs transfected with the indicated siRNA were incubated during 24-h with 10 mM lactate or not. HIF-1α protein expression was detected by western blot. *p<0.05, ***p<0.005 compared to control; ### p<0.005 compared lactate alone; n = 6–14. (D and E) HIF-1α and VEGFR2 protein expression was detected by western blot. (D) HUVECs were incubated during 24-h with 10 mM lactate and/or 5 mM α-cyano-4-hydroxycinnamate (CHC). *p<0.05, **p<0.01, ***p<0.005 compared to control; ### p<0.005 compared to lactate alone; n = 3–12. (E) BAECs were incubated during 24-h with 10 mM lactate, 5 mM N ω-nitro-L-arginine methyl ester (L-NAME), 5 mM α-cyano-4-hydroxycinnamate (CHC), and/or 5 mM N-acetyl-L-cysteine (NAC). *p<0.01, ***p<0.005 compared to control; ### p<0.005 compared to lactate alone; n = 3–14. (C–E) Error bars reflect mean ± SEM.CC BY · PubMed Central
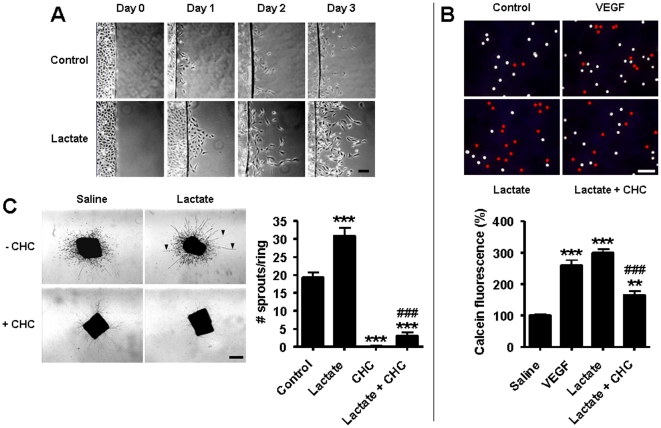
Figure 6 Targeting MCT1 inhibits lactate-induced endothelial cell migration and vascular sprouting. (A) Confluent BAECs on coverslips were placed into cell-free dishes in the presence of 10 mM lactate or not. Pictures show cell migration over time. Bar = 50 µm. (B) Quantification of EC migration was performed in a transwell assay in which calcein-labeled BAECs migrated during 24-h through a Matrigel-coated membrane towards serum-free medium containing 10 ng/ml VEGF, 10 mM lactate, or lactate and 5 mM CHC. Pictures show the membranes where pores occupied by endothelial cells (detected using a caveolin-1 antibody) are labeled with a red bullet. Bar = 50 µm. The graph shows calcein fluorescence in the bottom well. **p<0.01, ***p<0.005 compared to control; ### p<0.005 compared to lactate; n = 3. (C) Consecutive rings of a mouse aorta were cultured during 10 days in collagen gels containing 10 mM lactate and/or 2 mM CHC. Pictures show endothelial sproutings (arrowhead point at typical linear structures) and fibroblast seeding (scattered cells). Bar = 500 µm. The graph shows the number of sprouts per ring. ***p<0.005 compared to control; ### p<0.005 compared to lactate; n = 6–11. (B and C) Error bars reflect mean ± SEM.
Figure 6 Targeting MCT1 inhibits lactate-induced endothelial cell migration and vascular sprouting. (A) Confluent BAECs on coverslips were placed into cell-free dishes in the presence of 10 mM lactate or not. Pictures show cell migration over time. Bar = 50 µm. (B) Quantification of EC migration was performed in a transwell assay in which calcein-labeled BAECs migrated during 24-h through a Matrigel-coated membrane towards serum-free medium containing 10 ng/ml VEGF, 10 mM lactate, or lactate and 5 mM CHC. Pictures show the membranes where pores occupied by endothelial cells (detected using a caveolin-1 antibody) are labeled with a red bullet. Bar = 50 µm. The graph shows calcein fluorescence in the bottom well. **p<0.01, ***p<0.005 compared to control; ### p<0.005 compared to lactate; n = 3. (C) Consecutive rings of a mouse aorta were cultured during 10 days in collagen gels containing 10 mM lactate and/or 2 mM CHC. Pictures show endothelial sproutings (arrowhead point at typical linear structures) and fibroblast seeding (scattered cells). Bar = 500 µm. The graph shows the number of sprouts per ring. ***p<0.005 compared to control; ### p<0.005 compared to lactate; n = 6–11. (B and C) Error bars reflect mean ± SEM.CC BY · PubMed Central
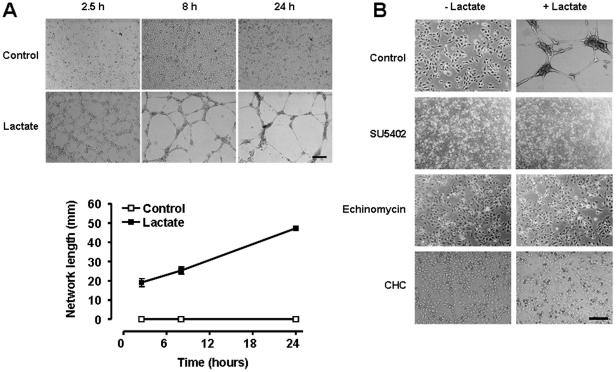
Figure 7 MCT1 inhibition blocks lactate-induced endothelial tube formation. HUVECs were seeded on growth factor-reduced Matrigel containing 10 mM lactate or not and monitored for their ability to generate vascular tubes. (A) Pictures of the upper panel show endothelial network formation over time (bar = 500 µm), which was quantified in the lower graph. n = 4. Error bars reflect mean ± SEM and are sometimes smaller than symbols. (B) The tube formation assay was performed in the presence of 10 µM SU5402 (targeting VEGF and bFGF receptors), 10 nM echinomycin (targeting the transcriptional activity of HIF-1), or 2 mM of CHC (targeting MCT1). Pictures were captured after 8-h of culture in the Matrigel matrix. Bar = 200 µm.
Figure 7 MCT1 inhibition blocks lactate-induced endothelial tube formation. HUVECs were seeded on growth factor-reduced Matrigel containing 10 mM lactate or not and monitored for their ability to generate vascular tubes. (A) Pictures of the upper panel show endothelial network formation over time (bar = 500 µm), which was quantified in the lower graph. n = 4. Error bars reflect mean ± SEM and are sometimes smaller than symbols. (B) The tube formation assay was performed in the presence of 10 µM SU5402 (targeting VEGF and bFGF receptors), 10 nM echinomycin (targeting the transcriptional activity of HIF-1), or 2 mM of CHC (targeting MCT1). Pictures were captured after 8-h of culture in the Matrigel matrix. Bar = 200 µm.CC BY · PubMed Central
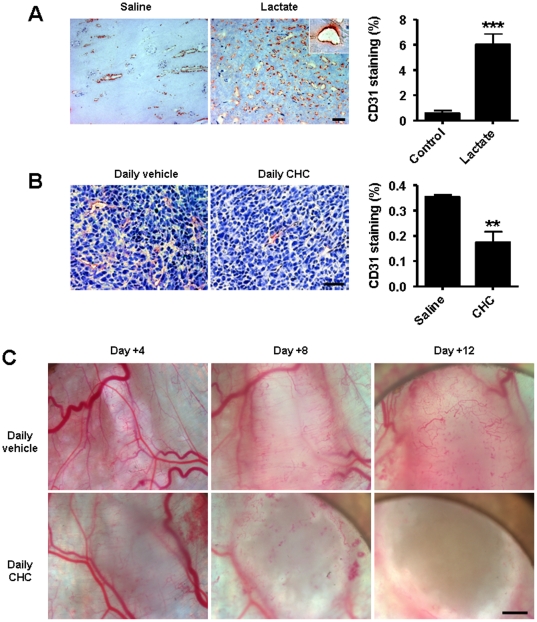
Figure 8 MCT1 inhibition blocks tumor angiogenesis. (A) Two Matrigel plugs were implanted subcutaneously in the same mouse, one containing 10 mM lactate (left flank) and the other one an equal volume of saline (right flank). Plugs were microdissected 7 days after implantation. Pictures show CD31 immunostainings (bar = 100 µm; inset: a vascular structure carrying red blood cells), which were quantified in the graph. ***p = 0.0007; n = 4. Error bars reflect mean ± SEM. (B and C) On Day 0, mice were randomly assigned to treatment groups consisting of daily i.p. injections of CHC (1 mmol/Kg) or vehicle. (B) Mice carrying LLc tumors (4±1 mm) were treated. Pictures show CD31 immunostainings of size-matched tumors (bar = 20 µm), which were quantified in the graph. **p = 0.0051; n = 4. Error bars reflect mean ± SEM. (C) Intravital microscopy pictures were captured over time in treated mice carrying tumors generated with MCT1-negative TLT tumor cells. Bar = 1 mm.
Figure 8 MCT1 inhibition blocks tumor angiogenesis. (A) Two Matrigel plugs were implanted subcutaneously in the same mouse, one containing 10 mM lactate (left flank) and the other one an equal volume of saline (right flank). Plugs were microdissected 7 days after implantation. Pictures show CD31 immunostainings (bar = 100 µm; inset: a vascular structure carrying red blood cells), which were quantified in the graph. ***p = 0.0007; n = 4. Error bars reflect mean ± SEM. (B and C) On Day 0, mice were randomly assigned to treatment groups consisting of daily i.p. injections of CHC (1 mmol/Kg) or vehicle. (B) Mice carrying LLc tumors (4±1 mm) were treated. Pictures show CD31 immunostainings of size-matched tumors (bar = 20 µm), which were quantified in the graph. **p = 0.0051; n = 4. Error bars reflect mean ± SEM. (C) Intravital microscopy pictures were captured over time in treated mice carrying tumors generated with MCT1-negative TLT tumor cells. Bar = 1 mm.CC BY · PubMed Central
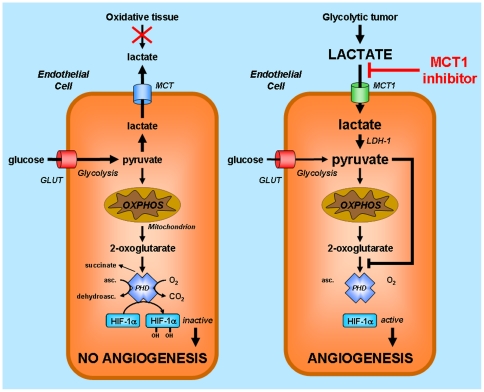
Figure 9 Model illustrating the anti-angiogenic activity of MCT1 inhibitors targeting lactate-induced HIF-1 activation in endothelial cells. HIF-1 activity primarily depends on the stability of HIF-1α. When HIF prolylhydroxylase (PHD) is active as it is the case for normoxic endothelial cells (ECs) in oxidative tissues (left), HIF-1α is hydroxylated and addressed to the proteasome for degradation. PHD requires 2-oxoglutarate as a substrate and is competitively inhibited by pyruvate. Normoxic ECs in glycolytic tissues such as tumors (right) take up exogenous lactate originating from distant hypoxic cells, a process under the control of monocarboxylate transporter 1 (MCT1). ECs do not primarily use lactate as a fuel for oxidative phosphorylation (OXPHOS). Lactate oxidation by LDH-B rather increases the pool of intracellular pyruvate, now available to compete with 2-oxoglutarate from PHD, resulting in HIF-1α protein stabilization, HIF-1 activation, and angiogenesis. Because MCT1 is the main transporter for lactate uptake by ECs, targeting MCT1 inhibits lactate-induced angiogenesis in tumors. Abbreviations: asc., ascorbate; dehydroasc., dehydroascorbate; GLUT, glucose transporter.
Figure 9 Model illustrating the anti-angiogenic activity of MCT1 inhibitors targeting lactate-induced HIF-1 activation in endothelial cells. HIF-1 activity primarily depends on the stability of HIF-1α. When HIF prolylhydroxylase (PHD) is active as it is the case for normoxic endothelial cells (ECs) in oxidative tissues (left), HIF-1α is hydroxylated and addressed to the proteasome for degradation. PHD requires 2-oxoglutarate as a substrate and is competitively inhibited by pyruvate. Normoxic ECs in glycolytic tissues such as tumors (right) take up exogenous lactate originating from distant hypoxic cells, a process under the control of monocarboxylate transporter 1 (MCT1). ECs do not primarily use lactate as a fuel for oxidative phosphorylation (OXPHOS). Lactate oxidation by LDH-B rather increases the pool of intracellular pyruvate, now available to compete with 2-oxoglutarate from PHD, resulting in HIF-1α protein stabilization, HIF-1 activation, and angiogenesis. Because MCT1 is the main transporter for lactate uptake by ECs, targeting MCT1 inhibits lactate-induced angiogenesis in tumors. Abbreviations: asc., ascorbate; dehydroasc., dehydroascorbate; GLUT, glucose transporter.CC BY · PubMed Central

Verification

Claims the paper makes

The claims and statistics of this paper haven’t been checked yet.

Run the check — free, no account needed. It reads the open-access text and checks the sources it cites.

A few free checks a day · papers already verified open instantly · results are public

Claims other papers make about this one

Each is checked against this paper’s own text: does it say what the citing paper says it does?

Self-check

Percentages, sums and reported differences re-computed from the paper’s own numbers.

The self-check needs the paper’s full text.

Citations

Cites

Show all 67 references

Cited by

Sorted by citations

See all 541

Metadata

Authors
Sonveaux, P., Copetti, T., De Saedeleer, C. J., Végran, F., Verrax, J., Kennedy, K. M., Moon, E. J., Dhup, S., Danhier, P., Frérart, F., Gallez, B., Ribeiro, A., Michiels, C., Dewhirst, M. W., & Feron, O.
Affiliations
  • Duke Medical Center (US)
  • UCLouvain (BE)
  • Duke University (US)
  • University of Namur (BE)
Corresponding author
Sonveaux, Pierre
Venue
PLoS ONE
Published
2012-03-13
Volume
7
Issue
3
Pages
e33418
ISSN
1932-6203 (ISSN-L)
OpenAlex
W2003842905
Cited by
536
References
67
Citations by year
2026: 34 · 2025: 38 · 2024: 25 · 2023: 50 · 2022: 58 · 2021: 46 · 2020: 62 · 2019: 34 · 2018: 36 · 2017: 36 · 2016: 30 · 2015: 32 · 2014: 26 · 2013: 22 · 2012: 6
FWCI
9.21
Type
journal article
Language
en
Open access
Locations
  • PLoS ONE (publishedVersion, cc-by)
  • PubMed Central (publishedVersion, cc-by)
  • PubMed (publishedVersion)
  • DIAL (Catholic University of Leuven) (submittedVersion, other-oa)
  • DOAJ (DOAJ: Directory of Open Access Journals) (submittedVersion, cc-by-sa)
  • Figshare (submittedVersion, cc-by)
  • Repository of the University of Namur (submittedVersion, other-oa)
Funders
  • Belgian American Educational Foundation
  • Fonds De La Recherche Scientifique - FNRS
  • National Institutes of Health (FP7/2007-2013, 5p01ca042745-23)
  • National Cancer Institute (CA40355, R01CA040355, CA40355-24, P01-CA042745, CA40355-25)
  • FP7 Ideas: European Research Council (243188)
Topics
  • Life Sciences › Biochemistry, Genetics and Molecular Biology › Cancer Research › Cancer, Hypoxia, and Metabolism
  • Life Sciences › Biochemistry, Genetics and Molecular Biology › Molecular Biology › Angiogenesis and VEGF in Cancer
  • Health Sciences › Medicine › Oncology › Lymphatic System and Diseases
Keywords
MCT1, MCT1 inhibition, lactate transport, endothelial cells, tumor angiogenesis, tumor hypoxia, glycolytic metabolism, VEGFR2, basic fibroblast growth factor, anti-angiogenic therapy, tumor microenvironment
MeSH terms
Monocarboxylate Transport Protein 1, Analysis of Variance, Animals, Cell Movement, Enzyme-Linked Immunosorbent Assay, Fibroblast Growth Factors, Humans, Immunohistochemistry, Luciferases, Neoplasms, Neovascularization, Pathologic, Blotting, Western, Polymerase Chain Reaction, Lactic Acid, Nuclear Magnetic Resonance, Biomolecular, Monocarboxylic Acid Transporters, Symporters, RNA Interference, RNA, Small Interfering, Vascular Endothelial Growth Factor Receptor-2, Endothelial Cells, Mice, Hypoxia-Inducible Factor 1

About these checks

Registry, retraction, Cites and statistics results are computed, not judged, with one exception: a printed reference that no index lists is read once by a model before it counts as a citation error. Claims are extracted by a model and kept only when their quote appears verbatim in the text; each cited source is then checked, with a model’s help, for whether it says what the claim relies on. Those verdicts can be wrong — read the claim’s quote and the cited source before relying on one.

Statistics and arithmetic are recomputed, not judged.

Confidence bands are shown only for fields calibrated on our annotated test set. None is calibrated yet, so no band is shown.

What counts as a claim ›How we measure confidence ›How we check this ›

Are you an author, or do you see a problem with this page? Request a review