

The DOI matches its Crossref record; 93 of the 95 references it cites were found in a registry or an index.
Mapping Connectivity Damage in the Case of Phineas Gage
Open accessAbstract
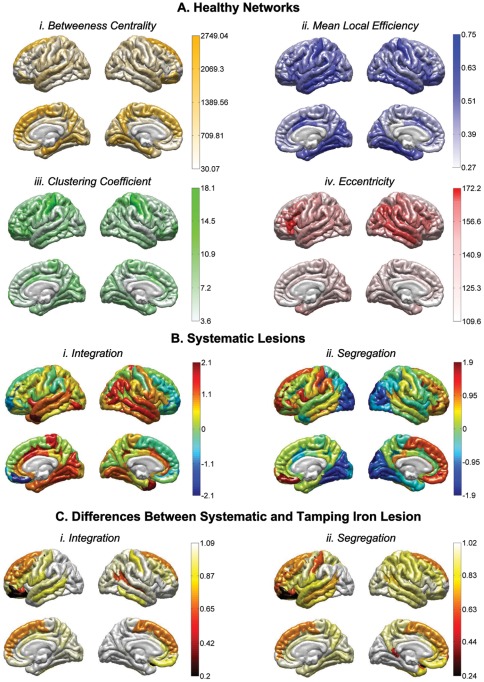
White matter (WM) mapping of the human brain using neuroimaging techniques has gained considerable interest in the neuroscience community. Using diffusion weighted (DWI) and magnetic resonance imaging (MRI), WM fiber pathways between brain regions may be systematically assessed to make inferences concerning their role in normal brain function, influence on behavior, as well as concerning the consequences of network-level brain damage. In this paper, we investigate the detailed connectomics in a noted example of severe traumatic brain injury (TBI) which has proved important to and controversial in the history of neuroscience. We model the WM damage in the notable case of Phineas P. Gage, in whom a "tamping iron" was accidentally shot through his skull and brain, resulting in profound behavioral changes. The specific effects of this injury on Mr. Gage's WM connectivity have not previously been considered in detail. Using computed tomography (CT) image data of the Gage skull in conjunction with modern anatomical MRI and diffusion imaging data obtained in contemporary right handed male subjects (aged 25-36), we computationally simulate the passage of the iron through the skull on the basis of reported and observed skull fiducial landmarks and assess the extent of cortical gray matter (GM) and WM damage. Specifically, we find that while considerable damage was, indeed, localized to the left frontal cortex, the impact on measures of network connectedness between directly affected and other brain areas was profound, widespread, and a probable contributor to both the reported acute as well as long-term behavioral changes. Yet, while significantly affecting several likely network hubs, damage to Mr. Gage's WM network may not have been more severe than expected from that of a similarly sized "average" brain lesion. These results provide new insight into the remarkable brain injury experienced by this noteworthy patient.
Overview
The claims and statistics of this paper haven’t been checked yet.
Run the check — free, no account needed. It reads the open-access text and checks the sources it cites.
Integrity signals
Registry
Cites
Statistics
Figures
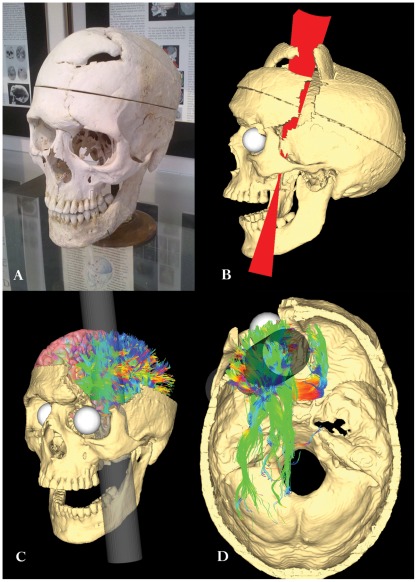
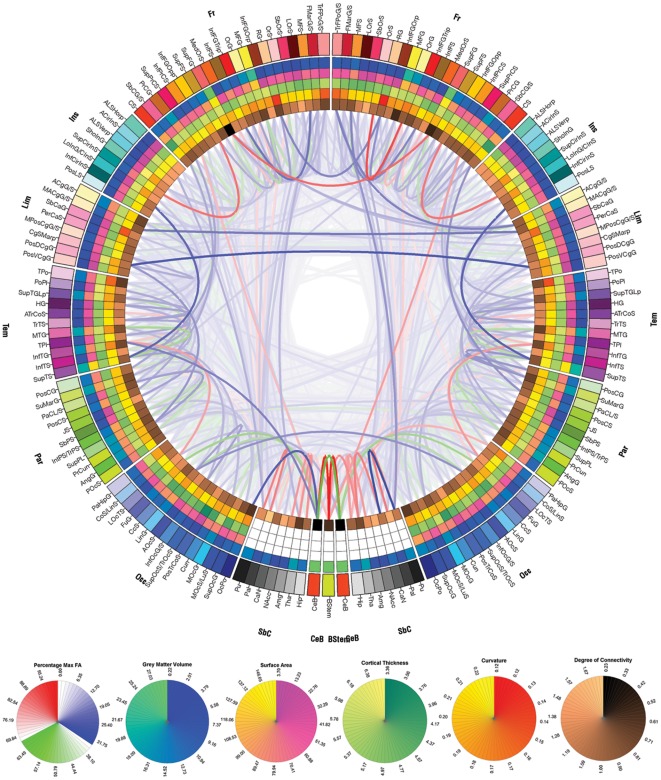
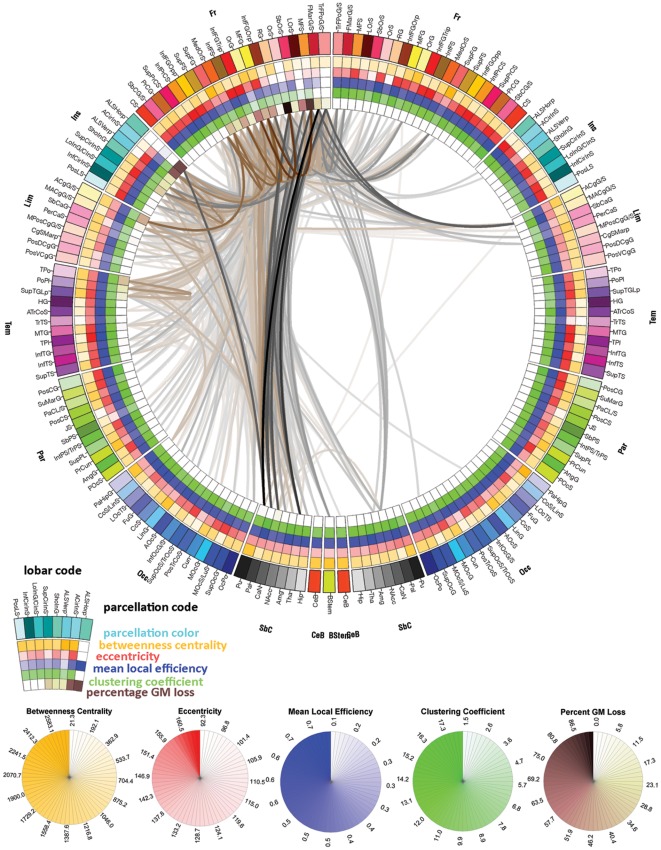
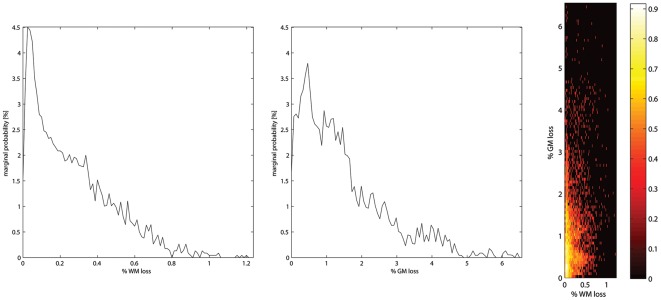
Verification
Claims the paper makes
The claims and statistics of this paper haven’t been checked yet.
Run the check — free, no account needed. It reads the open-access text and checks the sources it cites.
Claims other papers make about this one
Each is checked against this paper’s own text: does it say what the citing paper says it does?
The cited source says what the claim attributes to it.
In the citing paper
“While this indeed confirmed notable local injury, it also identified patterns of widespread and longrange connectivity loss that could also have contributed to the characteristic postinjury behavioral patterns described.”
From Graph theory analysis of complex brain networks: new concepts in brain mapping applied to neurosurgery (2016) · cites this paper as [99]
Self-check
Percentages, sums and reported differences re-computed from the paper’s own numbers.
The self-check needs the paper’s full text.
Citations
Cites
Collective dynamics of ‘small-world’ networks
Watts, D. J., & Strogatz, S. H. (1998) · Nature · doi:10.1038/30918 · Cited by 43,060
Complex brain networks: graph theoretical analysis of structural and functional systems
Bullmore, E., & Sporns, O. (2009) · Nature Reviews Neuroscience · doi:10.1038/nrn2575 · Cited by 11,820
Complex network measures of brain connectivity: Uses and interpretations
Rubinov, M., & Sporns, O. (2010) · NeuroImage · doi:10.1016/j.neuroimage.2009.10.003 · Cited by 11,522
Circos: An information aesthetic for comparative genomicsPreprint
Krzywinski, M. I., Schein, J. E., Birol, İ., Connors, J. M., Gascoyne, R. D., Horsman, D. E., Jones, S. J. M., & Marra, M. A. (2009) · Genome Research · doi:10.1101/gr.092759.109 · Cited by 11,073
Cortical Surface-Based Analysis
Dale, A. M., Fischl, B., & Sereno, M. I. (1999) · NeuroImage · doi:10.1006/nimg.1998.0395 · Cited by 10,910
Fischl, B., Salat, D. H., Busa, E., Albert, M., Dieterich, M., Haselgrove, C., van der Kouwe, A., Killiany, R., Kennedy, D., Klaveness, S., et al. (2002) · Neuron · doi:10.1016/s0896-6273(02)00569-x · Cited by 8,610
Cortical Surface-Based Analysis
Fischl, B., Sereno, M. I., & Dale, A. M. (1999) · NeuroImage · doi:10.1006/nimg.1998.0396 · Cited by 6,147
Measuring the thickness of the human cerebral cortex from magnetic resonance images
Fischl, B. R., & Dale, A. M. (2000) · Proceedings of the National Academy of Sciences · doi:10.1073/pnas.200033797 · Cited by 5,995
Automatically Parcellating the Human Cerebral Cortex
Fischl, B. R. (2003) · Cerebral Cortex · doi:10.1093/cercor/bhg087 · Cited by 4,208
Mapping the structural core of human cerebral cortex
Hagmann, P., Cammoun, L., Gigandet, X., Meuli, R., Honey, C. J., Wedeen, V. J., & Sporns, O. (2008) · PLoS Biology · doi:10.1371/journal.pbio.0060159 · Cited by 4,173
Research works printed but not linked: 7
- E Dupuy, 1877, A critical review of the prevailing theories concerning the physiology and pathology of the brain., Medical Times and Gazette, ii, 11
- AM Dale, 1999, Cortical surface-based analysis - I. Segmentation and surface reconstruction., Neuro Image, 9, 179
- B Fischl, 2002, Whole Brain Segmentation: Automated Labeling of Neuroanatomical Structures in the Human Brain., Neurotechnique, 33, 341
- B Fischl, 1999, Cortical surface-based analysis. II: Inflation, flattening, and a surface-based coordinate system., Neuroimage, 9, 195
- J Alstott, 2009, Modeling the impact of lesions in the human brain., Plos Computational Biology, 5, e1000408, 10.1371/journal.pcbi.1000408 · DOI · Paper page
- I Dinov, 2010, Neuroimaging Study Designs, Computational Analyses and Data Provenance Using the LONI Pipeline., PLoS ONE
- I Dinov, 2010, Efficient, distributed and interactive neuroimaging data analysis using the LONI pipeline., Frontiers in Neuroinformatics, 3, 1
Cited by
Sorted by citations
Network hubs in the human brain
van den Heuvel, M. P., & Sporns, O. (2013) · Trends in Cognitive Sciences · doi:10.1016/j.tics.2013.09.012 · Cited by 2,123
The social brain in psychiatric and neurological disorders
Kennedy, D. P., & Adolphs, R. (2012) · Trends in Cognitive Sciences · doi:10.1016/j.tics.2012.09.006 · Cited by 846
Network dysfunction after traumatic brain injury
Sharp, D. J., Scott, G., & Leech, R. (2014) · Nature Reviews Neurology · doi:10.1038/nrneurol.2014.15 · Cited by 657
Brain Networks in Schizophrenia
van den Heuvel, M. P., & Fornito, A. (2014) · Neuropsychology Review · doi:10.1007/s11065-014-9248-7 · Cited by 531
Understanding Emotions: Origins and Roles of the Amygdala
Šimić, G., Tkalčić, M., Vukić, V., Mulc, D., Španić, E., Šagud, M., Olucha-Bordonau, F. E., Vukšić, M., & Hof, P. R. (2021) · Biomolecules · doi:10.3390/biom11060823 · Cited by 631
Metadata
- Authors
- Van Horn, J. D., Irimia, A., Torgerson, C. M., Chambers, M. C., Kikinis, R., & Toga, A. W.
- Affiliations
- University of California, Los Angeles (US)
- Brigham and Women's Hospital (US)
- Venue
- PLoS ONE
- Publisher
- Public Library of Science (PLoS)
- Published
- 2012-05-16
- Volume
- 7
- Issue
- 5
- Pages
- e37454
- ISSN
- 1932-6203 (ISSN-L)
- PMC
- PMC3353935
- OpenAlex
- W2043275179
- Cited by
- 196
- References
- 95
- Citations by year
- 2026: 6 · 2025: 3 · 2024: 5 · 2023: 6 · 2022: 7 · 2021: 16 · 2020: 34 · 2019: 29 · 2018: 18 · 2017: 8 · 2016: 15 · 2015: 19 · 2014: 9 · 2013: 15 · 2012: 4
- FWCI
- 11.35
- Type
- journal article
- Language
- en
- Open access
- gold
- doi.org
- Locations
- PLoS ONE (publishedVersion, cc-by)
- Europe PMC (PubMed Central) (publishedVersion, cc-by)
- PubMed Central (publishedVersion, cc-by)
- PubMed (publishedVersion)
- Digital Access to Scholarship at Harvard (DASH) (Harvard University) (submittedVersion, cc-by)
- DOAJ (DOAJ: Directory of Open Access Journals) (submittedVersion, cc-by-sa)
- Figshare (submittedVersion, cc-by)
- Funders
- University of California, Los Angeles
- National Institute of Mental Health (RC1MH088194)
- National Institute of Biomedical Imaging and Bioengineering (U54EB005149)
- National Center for Research Resources (P41RR013642, P41RR013218)
- Topics
- Health Sciences › Medicine › Radiology, Nuclear Medicine and Imaging › Advanced Neuroimaging Techniques and Applications
- Life Sciences › Neuroscience › Cognitive Neuroscience › Functional Brain Connectivity Studies
- Health Sciences › Medicine › Clinical Neurology › Traumatic Brain Injury Research
- Keywords
- Phineas Gage, traumatic brain injury, white matter injury, connectomics, diffusion MRI, brain network connectivity, frontal lobe lesions, network hubs, history of neuroscience
- MeSH terms
- Adult, Brain Injuries, Frontal Lobe, Humans, Magnetic Resonance Imaging, Male, Nerve Fibers, Myelinated, Personality Disorders, Tomography, X-Ray Computed, Vermont, History, 19th Century, Neuroimaging
About these checks
Registry, retraction, Cites and statistics results are computed, not judged, with one exception: a printed reference that no index lists is read once by a model before it counts as a citation error. Claims are extracted by a model and kept only when their quote appears verbatim in the text; each cited source is then checked, with a model’s help, for whether it says what the claim relies on. Those verdicts can be wrong — read the claim’s quote and the cited source before relying on one.
Statistics and arithmetic are recomputed, not judged.
Confidence bands are shown only for fields calibrated on our annotated test set. None is calibrated yet, so no band is shown.
What counts as a claim ›How we measure confidence ›How we check this ›
Are you an author, or do you see a problem with this page? Request a review
