

The DOI matches its Crossref record; 40 of the 40 references it cites were found in a registry or an index.
SNP Calling, Genotype Calling, and Sample Allele Frequency Estimation from New-Generation Sequencing Data
Open accessAbstract
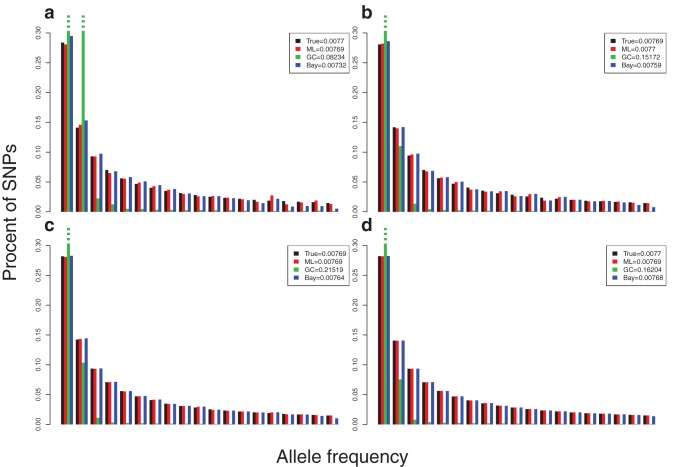
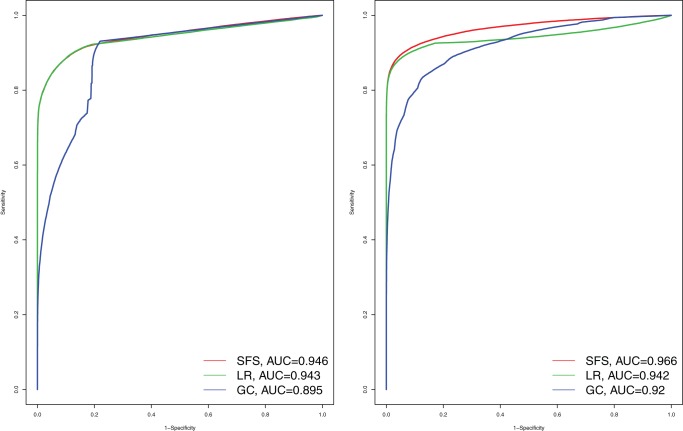
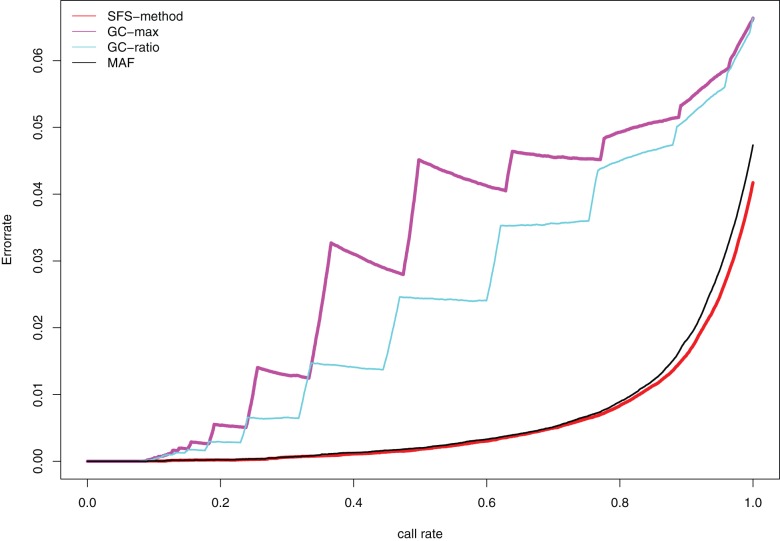
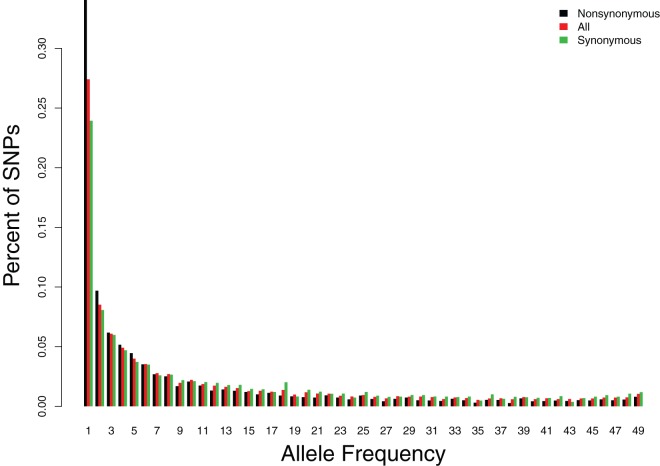
We present a statistical framework for estimation and application of sample allele frequency spectra from New-Generation Sequencing (NGS) data. In this method, we first estimate the allele frequency spectrum using maximum likelihood. In contrast to previous methods, the likelihood function is calculated using a dynamic programming algorithm and numerically optimized using analytical derivatives. We then use a bayesian method for estimating the sample allele frequency in a single site, and show how the method can be used for genotype calling and SNP calling. We also show how the method can be extended to various other cases including cases with deviations from Hardy-Weinberg equilibrium. We evaluate the statistical properties of the methods using simulations and by application to a real data set.
Overview
The claims and statistics of this paper haven’t been checked yet.
Run the check — free, no account needed. It reads the open-access text and checks the sources it cites.
Integrity signals
Registry
Cites
Statistics
Figures
Verification
Claims the paper makes
The claims and statistics of this paper haven’t been checked yet.
Run the check — free, no account needed. It reads the open-access text and checks the sources it cites.
Claims other papers make about this one
Each is checked against this paper’s own text: does it say what the citing paper says it does?
In the citing paper
“due to the error rate of sequencing, the mixture of nonparenchymal cells and polyploidy of hepatocytes, this approach could not detect low-frequency single-nucleotide polymorphisms in hepatocytes11.”
From Genome editing with Cas9 in adult mice corrects a disease mutation and phenotype (2014) · cites this paper as [11]
Self-check
Percentages, sums and reported differences re-computed from the paper’s own numbers.
The self-check needs the paper’s full text.
Citations
Cites
ESTIMATING F -STATISTICS FOR THE ANALYSIS OF POPULATION STRUCTURE
Weir, B. S., & Cockerham, C. C. (1984) · Evolution · doi:10.1111/j.1558-5646.1984.tb05657.x · Cited by 18,909 · cited 1×
“, [21]) also proceed from estimates of the SFS.”
BackgroundProceedings of the National Academy of Sciences of the United States of America
Dowling, J. E., & Wald, G. (2009) · Nutrition Reviews · doi:10.1111/j.1753-4887.1981.tb06752.x · Cited by 17,937
Numerical recipes in C: the art of scientific computing
(1993) · Choice Reviews Online · doi:10.5860/choice.30-5638 · Cited by 17,933
Numerical Recipes in C: The Art of Scientific Computing
Seiler, M. C., & Seiler, F. A. (1989) · Risk Analysis · doi:10.1111/j.1539-6924.1989.tb01007.x · Cited by 15,446
Press, W. H., Teukolsky, S. A., Vetterling, W. T., & Flannery, B. P. (1994) · Cited by 15,411
Statistical method for testing the neutral mutation hypothesis by DNA polymorphism.
Tajima, F. (1989) · Genetics · doi:10.1093/genetics/123.3.585 · Cited by 14,056
RNA-Seq: a revolutionary tool for transcriptomics
Wang, Z., Gerstein, M., & Snyder, M. (2009) · Nature Reviews Genetics · doi:10.1038/nrg2484 · Cited by 13,174 · cited 1×
“, [5]), in population genetic studies (e.”
Estimating F-Statistics for the Analysis of Population Structure
Weir, B. S., & Cockerham, C. C. (1984) · Evolution · doi:10.2307/2408641 · Cited by 11,023
A map of human genome variation from population-scale sequencing.
The 1000 Genomes Project Consortium (2010) · Nature · doi:10.1038/nature09534 · Cited by 7,877 · cited 4×
“In fact, imputation based genotype calling will lead to a substantial increase in accuracy over other methods [7].”
BackgroundMethodInfluentialLi, H. (2011) · Bioinformatics · doi:10.1093/bioinformatics/btr509 · Cited by 6,454
Cited by
Sorted by citations
ANGSD: Analysis of Next Generation Sequencing Data
Korneliussen, T. S., Albrechtsen, A., & Nielsen, R. (2014) · BMC Bioinformatics · doi:10.1186/s12859-014-0356-4 · Cited by 2,982
“[9].”
BackgroundMethodInfluentialSelf-citationHarnessing the power of RADseq for ecological and evolutionary genomics
Andrews, K. R., Good, J. M., Miller, M. R., Luikart, G., & Hohenlohe, P. A. (2016) · Nature Reviews Genetics · doi:10.1038/nrg.2015.28 · Cited by 1,502
Robust Demographic Inference from Genomic and SNP Data
Excoffier, L., Dupanloup, I., Huerta‐Sánchez, E., Sousa, V. C., & Foll, M. (2013) · PLoS Genetics · doi:10.1371/journal.pgen.1003905 · Cited by 1,475
“Several approaches have been proposed to correct for this bias [32,35], either during the process of genotype calling itself [e.g. 31,36,37] or later by applying quality filters on called genotypes [e.g. 38].”
MethodGenomics and the origin of species
D, O. S. C., Butlin, R. K., Keller, I., Wagner, C. E., BOUGHMAN, J. W., Hohenlohe, P. A., Peichel, C. L., Sætre, G., Bank, C., Brännström, Å., et al. (2014) · Nature Reviews Genetics · doi:10.1038/nrg3644 · Cited by 1,045
Genome editing with Cas9 in adult mice corrects a disease mutation and phenotype
Yin, H., Xue, W., Chen, S., Bogorad, R. L., Benedetti, E., Grompe, M., Koteliansky, V., Sharp, P. A., Jacks, T., & Anderson, D. G. (2014) · Nature Biotechnology · doi:10.1038/nbt.2884 · Cited by 951
Metadata
- Authors
- Nielsen, R., Korneliussen, T., Albrechtsen, A., Li, Y., & Wang, J.
- Affiliations
- BGI Group (China) (CN)
- University of Copenhagen (DK)
- Corresponding author
- Nielsen, Rasmus
- Wang, Jun
- Venue
- PLoS ONE
- Publisher
- Public Library of Science (PLoS)
- Published
- 2012-07-24
- Volume
- 7
- Issue
- 7
- Pages
- e37558
- ISSN
- 1932-6203 (ISSN-L)
- PMC
- PMC3404070
- OpenAlex
- W2005287518
- Cited by
- 424
- References
- 39
- Citations by year
- 2026: 24 · 2025: 18 · 2024: 43 · 2023: 33 · 2022: 38 · 2021: 40 · 2020: 25 · 2019: 19 · 2018: 37 · 2017: 30 · 2016: 39 · 2015: 30 · 2014: 25 · 2013: 19 · 2012: 1
- FWCI
- 9.58
- Type
- journal article
- Language
- en
- Open access
- gold
- doi.org
- Locations
- PLoS ONE (publishedVersion, cc-by)
- Europe PMC (PubMed Central) (publishedVersion, cc-by)
- PubMed Central (publishedVersion, cc-by)
- PubMed (publishedVersion)
- Research at the University of Copenhagen (University of Copenhagen) (publishedVersion, cc-by)
- RePEc: Research Papers in Economics (submittedVersion)
- DOAJ (DOAJ: Directory of Open Access Journals) (submittedVersion)
- eScholarship (California Digital Library) (submittedVersion)
- eScholarship (California Digital Library) (submittedVersion, cc-by)
- Figshare (submittedVersion, cc-by)
- Funders
- Villum Fonden (00007171)
- National Institutes of Health
- National Human Genome Research Institute (R01HG003229)
- Topics
- Life Sciences › Biochemistry, Genetics and Molecular Biology › Molecular Biology › Genomics and Phylogenetic Studies
- Life Sciences › Biochemistry, Genetics and Molecular Biology › Genetics › Genetic Associations and Epidemiology
- Life Sciences › Biochemistry, Genetics and Molecular Biology › Genetics › Genetic diversity and population structure
- Keywords
- allele frequency estimation, allele frequency spectrum, SNP calling, genotype calling, next-generation sequencing, maximum likelihood estimation, Hardy-Weinberg equilibrium, genetic variation
- MeSH terms
- Algorithms, Bayes Theorem, Computer Simulation, Denmark, Gene Frequency, Genotype, Humans, ROC Curve, Software, Likelihood Functions, Computational Biology, Internet, Polymorphism, Single Nucleotide, White People, High-Throughput Nucleotide Sequencing, Exome
About these checks
Registry, retraction, Cites and statistics results are computed, not judged, with one exception: a printed reference that no index lists is read once by a model before it counts as a citation error. Claims are extracted by a model and kept only when their quote appears verbatim in the text; each cited source is then checked, with a model’s help, for whether it says what the claim relies on. Those verdicts can be wrong — read the claim’s quote and the cited source before relying on one.
Statistics and arithmetic are recomputed, not judged.
Confidence bands are shown only for fields calibrated on our annotated test set. None is calibrated yet, so no band is shown.
What counts as a claim ›How we measure confidence ›How we check this ›
Are you an author, or do you see a problem with this page? Request a review
