

The DOI matches its Crossref record; 26 of the 26 references it cites were found in a registry or an index.
Hydrogen Sulfide Lowers Proliferation and Induces Protective Autophagy in Colon Epithelial Cells
Open accessAbstract
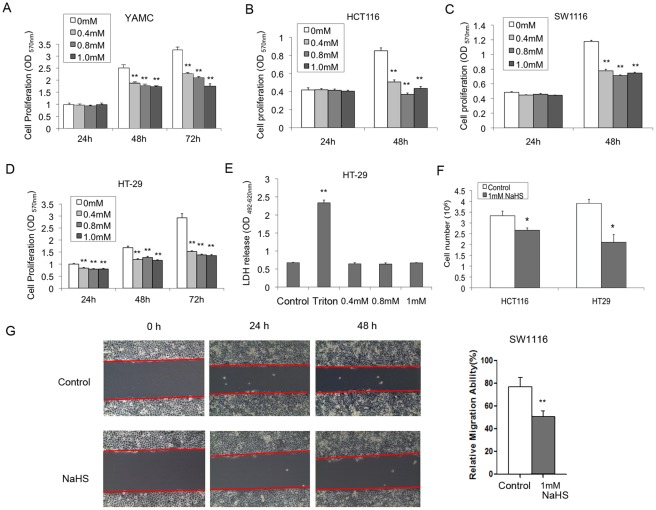
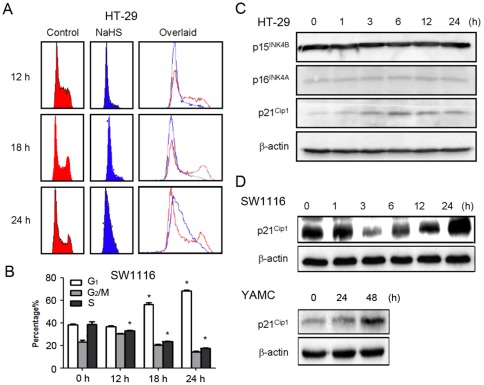
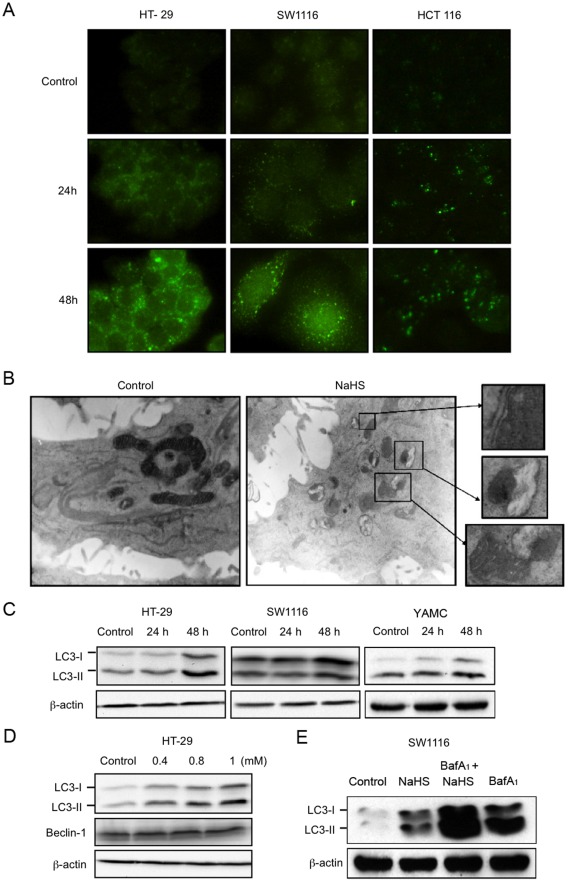
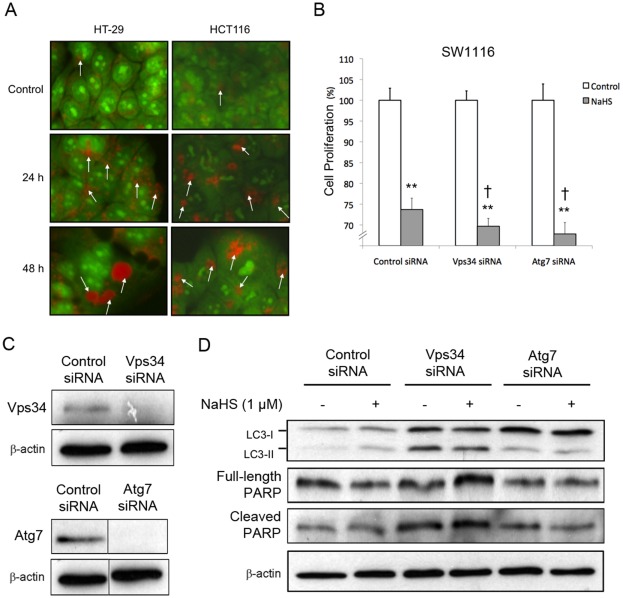
Hydrogen sulfide (H(2)S) is a gaseous bacterial metabolite that reaches high levels in the large intestine. In the present study, the effect of H(2)S on the proliferation of normal and cancerous colon epithelial cells was investigated. An immortalized colon epithelial cell line (YAMC) and a panel of colon cancer cell lines (HT-29, SW1116, HCT116) were exposed to H(2)S at concentrations similar to those found in the human colon. H(2)S inhibited normal and cancerous colon epithelial cell proliferation as measured by MTT assay. The anti-mitogenic effect of H(2)S was accompanied by G(1)-phase cell cycle arrest and the induction of the cyclin-dependent kinase inhibitor p21(Cip). Moreover, exposure to H(2)S led to features characteristic of autophagy, including increased formation of LC3B(+) autophagic vacuoles and acidic vesicular organelles as determined by immunofluorescence and acridine orange staining, respectively. Abolition of autophagy by RNA interference targeting Vps34 or Atg7 enhanced the anti-proliferative effect of H(2)S. Further mechanistic investigation revealed that H(2)S stimulated the phosphorylation of AMP-activated protein kinase (AMPK) and inhibited the phosphorylation of mammalian target of rapamycin (mTOR) and S6 kinase. Inhibition of AMPK significantly reversed H(2)S-induced autophagy and inhibition of cell proliferation. Collectively, we demonstrate that H(2)S inhibits colon epithelial cell proliferation and induces protective autophagy via the AMPK pathway.
Overview
The claims and statistics of this paper haven’t been checked yet.
Run the check — free, no account needed. It reads the open-access text and checks the sources it cites.
Integrity signals
Registry
Cites
Statistics
Figures
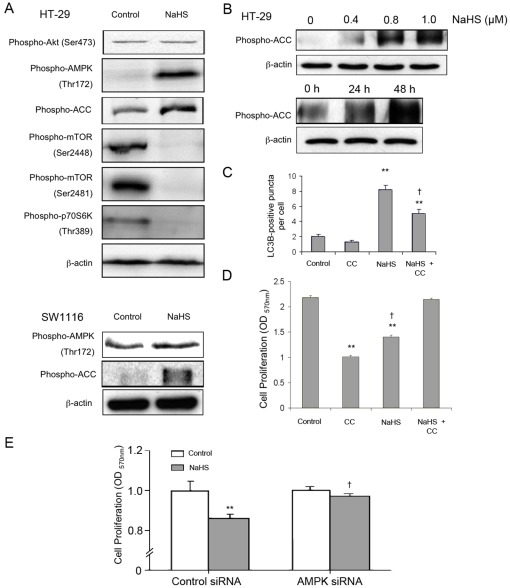
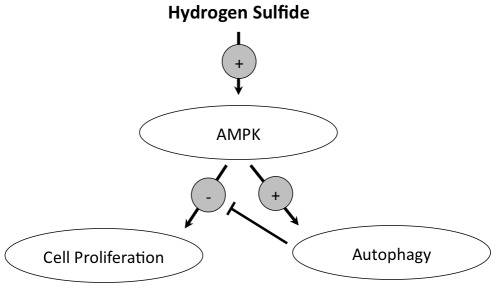
Verification
Claims the paper makes
The claims and statistics of this paper haven’t been checked yet.
Run the check — free, no account needed. It reads the open-access text and checks the sources it cites.
Claims other papers make about this one
Each is checked against this paper’s own text: does it say what the citing paper says it does?
The check wasn’t confident either way, so it gives no verdict — never disputed.
In the citing paper
“Several animal and human studies suggest that this is responsible for initiating esophageal mucosal injury and the development of dysmotility [13], [18], [19].”
From Cytoprotective Effects of Hydrogen Sulfide in Novel Rat Models of Non-Erosive Esophagitis (2014) · cites this paper as [19]
Experimental — accuracy not yet measured
Self-check
Percentages, sums and reported differences re-computed from the paper’s own numbers.
The self-check needs the paper’s full text.
Citations
Cites
Repertoires of Autophagy in the Pathogenesis of Ocular Diseases
Li, Y., Jiang, Q. L., Cao, G.-F., Yao, J., & Yan, B. (2015) · Cellular Physiology and Biochemistry · doi:10.1159/000373980 · Cited by 16,351
Autophagy fights disease through cellular self-digestion
Mizushima, N., Levine, B., Cuervo, A. M., & Klionsky, D. J. (2008) · Nature · doi:10.1038/nature06639 · Cited by 6,452
AMPK Phosphorylation of Raptor Mediates a Metabolic Checkpoint
Gwinn, D. M., Shackelford, D. B., Egan, D. F., Mihaylova, M. M., Mery, A., Vasquez, D. S., Turk, B. E., & Shaw, R. J. (2008) · Molecular Cell · doi:10.1016/j.molcel.2008.03.003 · Cited by 3,849
Self-eating and self-killing: crosstalk between autophagy and apoptosis
Maiuri, M. C., Zalckvar, E., Kimchi, A., & Kroemer, G. (2007) · Nature Reviews Molecular Cell Biology · doi:10.1038/nrm2239 · Cited by 3,638
Mathew, R., Karantza-Wadsworth, V., & White, E. (2007) · Nature Reviews Cancer · doi:10.1038/nrc2254 · Cited by 1,798
Hydrogen sulfide protects neurons from oxidative stress
Kimura, Y., & Kimura, H. (2004) · The FASEB Journal · doi:10.1096/fj.04-1815fje · Cited by 874
Comparison of fermentation reactions in different regions of the human colon
Macfarlane, G. T., Gibson, G. R., & Cummings, J. H. (1992) · Journal of Applied Bacteriology · doi:10.1111/j.1365-2672.1992.tb04882.x · Cited by 676
The role of TOR in autophagy regulation from yeast to plants and mammals
Díaz‐Troya, S., Pérez‐Pérez, M. E., Florencio, F. J., & Crespo, J. L. (2008) · Autophagy · doi:10.4161/auto.6555 · Cited by 392
Sato, K., Tsuchihara, K., Fujii, S., Sugiyama, M., Goya, T., Atomi, Y., Ueno, T., Ochiai, A., & Esumi, H. (2007) · Cancer Research · doi:10.1158/0008-5472.can-07-1462 · Cited by 362
Magee, E. A., Richardson, C. J., Hughes, R., & Cummings, J. H. (2000) · The American Journal of Clinical Nutrition · doi:10.1093/ajcn/72.6.1488 · Cited by 359
Hydrogen sulfide-releasing anti-inflammatory drugs
Wallace, J. L. (2007) · Trends in Pharmacological Sciences · doi:10.1016/j.tips.2007.09.003 · Cited by 328 · cited 1×
“Moreover, several H2S-releasing non-steroidal anti-inflammatory drugs have been developed for inflammatory bowel diseases [23].”
BackgroundComparison of fermentation reactions in different regions of the human colon
Macfarlane, G. T., Gibson, G. R., & Cummings, J. H. (1992) · Journal of Applied Microbiology · doi:10.1111/j.1365-2672.1992.tb05187.x · Cited by 279
Bian, J., Yong, Q. C., Pan, T., Feng, Z.-N., Ali, M. Y., Zhou, S., & Moore, P. K. (2006) · Journal of Pharmacology and Experimental Therapeutics · doi:10.1124/jpet.105.092023 · Cited by 262
Teague, B., Asiedu, S. O., & Moore, P. K. (2002) · British Journal of Pharmacology · doi:10.1038/sj.bjp.0704858 · Cited by 258
The autophagic paradox in cancer therapy
Wu, W. K. K., Coffelt, S. B., Cho, C. H., Wang, X. J., Lee, C., Chan, F. K. L., Yu, J. Q., & Sung, J. J. �. (2011) · Oncogene · doi:10.1038/onc.2011.295 · Cited by 250
Hydrogen sulfide enhances ulcer healing in rats
Wallace, J. L., Dicay, M., McKnight, W., & Martin, G. R. (2007) · The FASEB Journal · doi:10.1096/fj.07-8669com · Cited by 236
Hydrogen Sulfide Is a Novel Prosecretory Neuromodulator in the Guinea-Pig and Human Colon
Schicho, R., Krueger, D., Zeller, F., von Weyhern, C. W. H., Frieling, T., Kimura, H., Ishii, I., GIORGIO, R. D., Campi, B., & Schemann, M. (2006) · Gastroenterology · doi:10.1053/j.gastro.2006.08.035 · Cited by 218
Fiorucci, S., Orlandi, S., Mencarelli, A., Caliendo, G., Santagada, V., Distrutti, E., Santucci, L., Cirino, G., & Wallace, J. L. (2007) · British Journal of Pharmacology · doi:10.1038/sj.bjp.0707193 · Cited by 212
Fecal Hydrogen Sulfide Production in Ulcerative Colitis
Levine, J., Ellis, C. J., Furne, J. K., Springfield, J. R., & Levitt, M. D. (1998) · The American Journal of Gastroenterology · doi:10.1111/j.1572-0241.1998.083_c.x · Cited by 212
Metabolism of dietary sulphate: absorption and excretion in humans.
Florin, T. H., Neale, G., Gibson, G. R., Christl, S. U., & Cummings, J. H. (1991) · Gut · doi:10.1136/gut.32.7.766 · Cited by 211
Hydrogen sulfide as a novel nociceptive messenger
Kawabata, A., Ishiki, T., Nagasawa, K., Yoshida, S., Maeda, Y., Takahashi, T., Sekiguchi, F., Wada, T., Ichida, S., & Nishikawa, H. (2007) · Pain · doi:10.1016/j.pain.2007.01.026 · Cited by 187
Tripatara, P., Patel, N. S. A., Collino, M., Gallicchio, M., Kieswich, J. E., Castiglia, S., Benetti, E., Stewart, K. N., Brown, P. A., Yaqoob, M., et al. (2008) · Laboratory Investigation · doi:10.1038/labinvest.2008.73 · Cited by 172
AMP-Activated Protein Kinase and Autophagy
Meijer, A. J., & Codogno, P. (2007) · Autophagy · doi:10.4161/auto.3710 · Cited by 165
Ramasamy, S., Singh, S., Tanière, P., Langman, M. J. S., & Eggo, M. C. (2006) · American Journal of Physiology-Gastrointestinal and Liver Physiology · doi:10.1152/ajpgi.00324.2005 · Cited by 153
Impaired Detoxication of Hydrogen Sulfide in Ulcerative Colitis?
Picton, R., Eggo, M. C., Langman, M. J. S., & Singh, S. V. (2007) · Digestive Diseases and Sciences · doi:10.1007/s10620-006-9529-y · Cited by 32
Linoleic acid and butyrate synergize to increase Bcl‐2 levels in colonocytes
Turk, H. F., Kolar, S. S. N., Fan, Y., Cozby, C. A., Lupton, J. R., & Chapkin, R. S. (2010) · International Journal of Cancer · doi:10.1002/ijc.25323 · Cited by 30
Cited by
Sorted by citations
Szabó, C., Coletta, C., Chao, C., Módis, K., Szczęsny, B., Papapetropoulos, A., & Hellmich, M. R. (2013) · Proceedings of the National Academy of Sciences · doi:10.1073/pnas.1306241110 · Cited by 771
Nutrients, foods, and colorectal cancer prevention
Song, M., Garrett, W. S., & Chan, A. T. (2015) · Gastroenterology · doi:10.1053/j.gastro.2014.12.035 · Cited by 700
Physiological roles of hydrogen sulfide in mammalian cells, tissues, and organs
Cirino, G., Szabó, C., & Papapetropoulos, A. (2022) · Physiological Reviews · doi:10.1152/physrev.00028.2021 · Cited by 578
Metabolic niche of a prominent sulfate-reducing human gut bacterium
Rey, F. E., Gonzalez, M. D., Cheng, J., Wu, M., Ahern, P. P., & Gordon, J. I. (2013) · Proceedings of the National Academy of Sciences · doi:10.1073/pnas.1312524110 · Cited by 426
Cao, X., Ding, L., Xie, Z., Yang, Y., Whiteman, M., Moore, P. K., & Bian, J. (2018) · Antioxidants and Redox Signaling · doi:10.1089/ars.2017.7058 · Cited by 412
Metadata
- Authors
- Wu, Y. C., Wang, X. J., Yu, L., Chan, F. K. L., Cheng, A. S. L., Yu, J., Sung, J. J. Y., Wu, W. K. K., & Cho, C. H.
- Affiliations
- Chinese University of Hong Kong (HK)
- Corresponding author
- Wu, William K. K.
- Venue
- PLoS ONE
- Publisher
- Public Library of Science (PLoS)
- Published
- 2012-05-29
- Volume
- 7
- Issue
- 5
- Pages
- e37572
- ISSN
- 1932-6203 (ISSN-L)
- PMC
- PMC3362591
- OpenAlex
- W2088784248
- Cited by
- 109
- References
- 26
- Citations by year
- 2026: 3 · 2025: 7 · 2024: 5 · 2023: 7 · 2022: 9 · 2021: 13 · 2020: 11 · 2019: 8 · 2018: 11 · 2017: 6 · 2016: 7 · 2015: 8 · 2014: 8 · 2013: 6
- FWCI
- 3.01
- Type
- journal article
- Language
- en
- Open access
- gold
- doi.org
- Locations
- PLoS ONE (publishedVersion, cc-by)
- Europe PMC (PubMed Central) (publishedVersion, cc-by)
- PubMed Central (publishedVersion, cc-by)
- PubMed (publishedVersion)
- DOAJ (DOAJ: Directory of Open Access Journals) (submittedVersion, cc-by-sa)
- Topics
- Life Sciences › Biochemistry, Genetics and Molecular Biology › Biochemistry › Sulfur Compounds in Biology
- Life Sciences › Biochemistry, Genetics and Molecular Biology › Cell Biology › Autophagy in Disease and Therapy
- Physical Sciences › Chemical Engineering › Catalysis › Catalysis and Hydrodesulfurization Studies
- Keywords
- hydrogen sulfide, colonic epithelial cells, colon cancer, cell proliferation, autophagy, AMPK signaling, mTOR, S6 kinase, p21, G1 cell cycle arrest, Vps34, ATG7, LC3B
- MeSH terms
- Autophagy-Related Protein 7, Animals, Autophagy, Cell Cycle, Cell Line, Cell Movement, Colon, Epithelial Cells, Humans, Hydrogen Sulfide, Intestinal Mucosa, Microtubule-Associated Proteins, Phagosomes, Signal Transduction, Ubiquitin-Activating Enzymes, Cell Proliferation, Cyclin-Dependent Kinase Inhibitor p21, Mice, AMP-Activated Protein Kinases, Class III Phosphatidylinositol 3-Kinases, TOR Serine-Threonine Kinases
About these checks
Registry, retraction, Cites and statistics results are computed, not judged, with one exception: a printed reference that no index lists is read once by a model before it counts as a citation error. Claims are extracted by a model and kept only when their quote appears verbatim in the text; each cited source is then checked, with a model’s help, for whether it says what the claim relies on. Those verdicts can be wrong — read the claim’s quote and the cited source before relying on one.
Statistics and arithmetic are recomputed, not judged.
Confidence bands are shown only for fields calibrated on our annotated test set. None is calibrated yet, so no band is shown.
What counts as a claim ›How we measure confidence ›How we check this ›
Are you an author, or do you see a problem with this page? Request a review
