

The DOI matches its Crossref record; 68 of the 68 references it cites were found in a registry or an index.
Microglial Activation Correlates with Disease Progression and Upper Motor Neuron Clinical Symptoms in Amyotrophic Lateral Sclerosis
Open accessAbstract
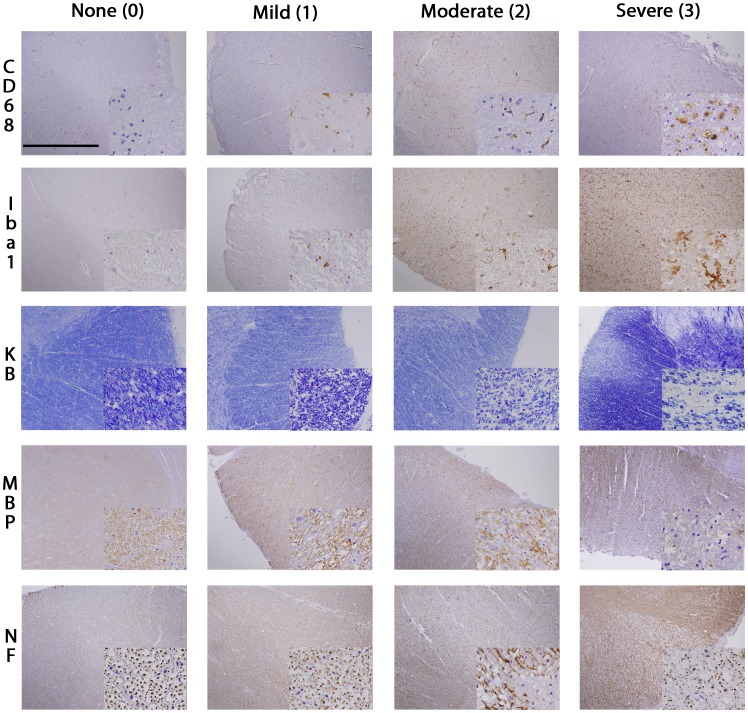
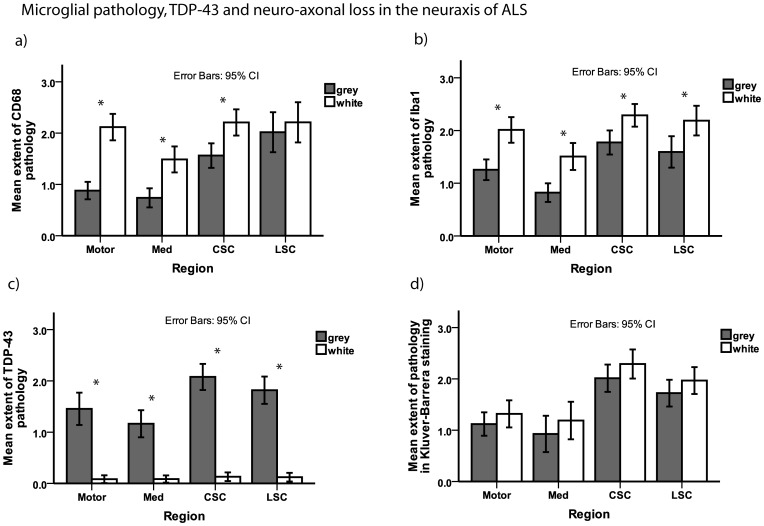
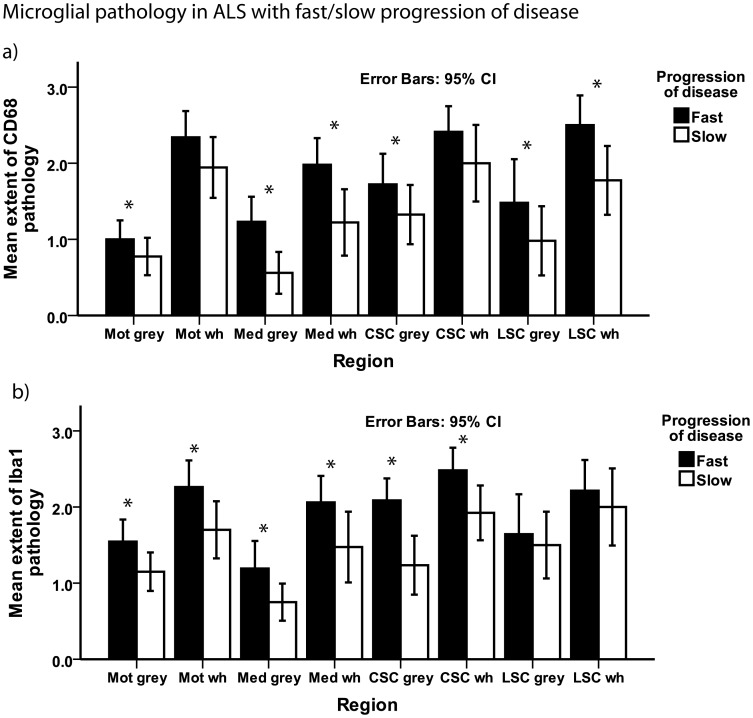
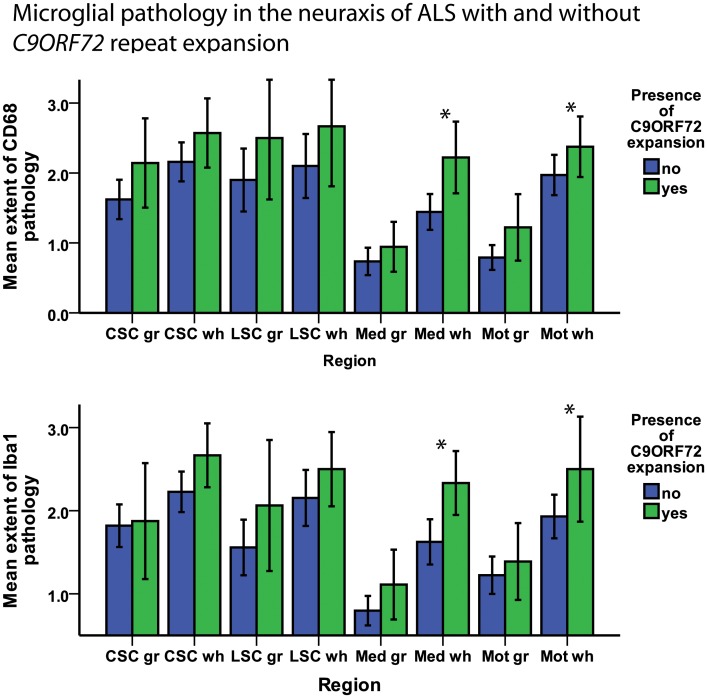
BACKGROUND/AIMS: We evaluated clinicopathological correlates of upper motor neuron (UMN) damage in amyotrophic lateral sclerosis (ALS), and analyzed if the presence of the C9ORF72 repeat expansion was associated with alterations in microglial inflammatory activity. METHODS: Microglial pathology was assessed by IHC with 2 different antibodies (CD68, Iba1), myelin loss by Kluver-Barrera staining and myelin basic protein (MBP) IHC, and axonal loss by neurofilament protein (TA51) IHC, performed on 59 autopsy cases of ALS including 9 cases with C9ORF72 repeat expansion. RESULTS: Microglial pathology as depicted by CD68 and Iba1 was significantly more extensive in the corticospinal tract (CST) of ALS cases with a rapid progression of disease. Cases with C9ORF72 repeat expansion showed more extensive microglial pathology in the medulla and motor cortex which persisted after adjusting for disease duration in a logistic regression model. Higher scores on the clinical UMN scale correlated with increasing microglial pathology in the cervical CST. TDP-43 pathology was more extensive in the motor cortex of cases with rapid progression of disease. CONCLUSIONS: This study demonstrates that microglial pathology in the CST of ALS correlates with disease progression and is linked to severity of UMN deficits.
Overview
The claims and statistics of this paper haven’t been checked yet.
Run the check — free, no account needed. It reads the open-access text and checks the sources it cites.
Integrity signals
Registry
Cites
Statistics
Figures
Verification
Claims the paper makes
The claims and statistics of this paper haven’t been checked yet.
Run the check — free, no account needed. It reads the open-access text and checks the sources it cites.
Claims other papers make about this one
Each is checked against this paper’s own text: does it say what the citing paper says it does?
The cited source says what the claim attributes to it.
In the citing paper
“Neuroinflammation has also been observed in patients with ALS, in which inflammatory microglial hyperactivity in these patients has been linked to disease progression [50,54].”
From Head Injury and Amyotrophic Lateral Sclerosis: Population-Based Study from the National ALS Registry (2025) · cites this paper as [54]
In the citing paper
“ALS patients carrying C9orf72 mutations display microglial activation that correlates with disease progression [438].”
From Autophagy and ALS: mechanistic insights and therapeutic implications (2022) · cites this paper as [438]
In the citing paper
“Postmortem studies308–310 and in vivo PET studies311–313 revealed widespread cerebral microglial activation in patients with ALS,308–312 and even in pre-symptomatic ALS-related mutation carriers.309,313”
From Microglia in neurodegenerative diseases: mechanism and potential therapeutic targets (2023) · cites this paper as [309]
In the citing paper
“Microglial activation in the corticospinal tract of ALS correlated with neuronal and axonal loss and more severe upper motor neuron symptoms.309”
From Microglia in neurodegenerative diseases: mechanism and potential therapeutic targets (2023) · cites this paper as [309]
In the citing paper
“Transcriptome and histologic analyses of postmortem tissue from patients with ALS carrying the C9orf72 expansion (C9-ALS) found that decreased C9orf72 expression in C9-ALS led to altered microglial function and increased microglial activation.309,361”
From Microglia in neurodegenerative diseases: mechanism and potential therapeutic targets (2023) · cites this paper as [309]
Self-check
Percentages, sums and reported differences re-computed from the paper’s own numbers.
The self-check needs the paper’s full text.
Citations
Cites
Rosen, D. R., Siddique, T., Patterson, D., Figlewicz, D. A., Sapp, P., Hentati, A., Donaldson, D., Goto, J., O'Regan, J. P., Deng, H.-X., et al. (1993) · Nature · doi:10.1038/362059a0 · Cited by 7,062
Ubiquitinated TDP-43 in Frontotemporal Lobar Degeneration and Amyotrophic Lateral Sclerosis
Neumann, M., Sampathu, D. M., Kwong, L. K., Truax, A. C., Micsenyi, M. C., Chou, T. T., Bruce, J., Schuck, T., Grossman, M., Clark, C. M., et al. (2006) · Science · doi:10.1126/science.1134108 · Cited by 6,576
Self-citationInterrater Reliability of a Modified Ashworth Scale of Muscle Spasticity
Bohannon, R. W., & Smith, M. B. (1987) · Physical Therapy · doi:10.1093/ptj/67.2.206 · Cited by 5,461
El Escorial revisited: revised criteria for the diagnosis of amyotrophic lateral sclerosis
Brooks, B. R., Miller, R. G., Swash, M., & Munsat, T. L. (2000) · Amyotrophic Lateral Sclerosis and Other Motor Neuron Disorders · doi:10.1080/146608200300079536 · Cited by 5,433
DeJesus-Hernandez, M., Mackenzie, I. R., Boeve, B. F., Boxer, A. L., Baker, M., Rutherford, N. J., Nicholson, A. M., Finch, N. A., Flynn, H., Adamson, J., et al. (2011) · Neuron · doi:10.1016/j.neuron.2011.09.011 · Cited by 4,936
A Hexanucleotide Repeat Expansion in C9ORF72 Is the Cause of Chromosome 9p21-Linked ALS-FTD
Renton, A. E., Majounie, E., Waite, A., Simón-Sánchez, J., Rollinson, S., Gibbs, J. R., Schymick, J. C., Laaksovirta, H., van Swieten, J. C., Myllykangas, L., et al. (2011) · Neuron · doi:10.1016/j.neuron.2011.09.010 · Cited by 4,409
Cedarbaum, J. M., Stambler, N., Malta, E., Fuller, C., Hilt, D., Thurmond, B., & Nakanishi, A. (1999) · Journal of the Neurological Sciences · doi:10.1016/s0022-510x(99)00210-5 · Cited by 3,307
Kiernan, M. C., Vucic, S., Cheah, B. C., Turner, M. R., Eisen, A., Hardiman, O., Burrell, J. R., & Zoing, M. C. (2011) · The Lancet · doi:10.1016/s0140-6736(10)61156-7 · Cited by 2,603
Onset and Progression in Inherited ALS Determined by Motor Neurons and Microglia
Boillée, S., Yamanaka, K., Lobsiger, C. S., Copeland, N. G., Jenkins, N. A., Kassiotis, G., Kollias, G., & Cleveland, D. W. (2006) · Science · doi:10.1126/science.1123511 · Cited by 1,623
Amyotrophic Lateral Ssclerosis and Structural Defects in Cu,Zn Superoxide Dismutase
Deng, H., Hentati, A., Tainer, J. A., Iqbal, Z., Cayabyab, A., Hung, W.-Y., Getzoff, E. D., Hu, P., Herzfeldt, B., Roos, R. P., et al. (1993) · Science · doi:10.1126/science.8351519 · Cited by 1,479
Cited by
Sorted by citations
Microglia in neurodegenerative diseases: mechanism and potential therapeutic targets
Gao, C., Jiang, J., Tan, Y., & Chen, S. (2023) · Signal Transduction and Targeted Therapy · doi:10.1038/s41392-023-01588-0 · Cited by 1,616
Innate immune activation in neurodegenerative disease
Heneka, M. T., Kummer, M. P., & Latz, E. (2014) · Nature Reviews Immunology · doi:10.1038/nri3705 · Cited by 1,437
Inflammation and white matter degeneration persist for years after a single traumatic brain injury
Johnson, V. E., Stewart, J. E., Begbie, F. D., Trojanowski, J. Q., Smith, D. H., & Stewart, W. (2013) · Brain · doi:10.1093/brain/aws322 · Cited by 1,045
Self-citationMicroglia-mediated neuroinflammation in neurodegenerative diseases
Subhramanyam, C. S., Wang, C., Hu, Q., & Dheen, S. T. (2019) · Seminars in Cell and Developmental Biology · doi:10.1016/j.semcdb.2019.05.004 · Cited by 894
Chronic neuropathologies of single and repetitive TBI: substrates of dementia?
Smith, D. H., Johnson, V. E., & Stewart, W. (2013) · Nature Reviews Neurology · doi:10.1038/nrneurol.2013.29 · Cited by 699
Metadata
- Authors
- Brettschneider, J., Toledo, J. B., Van Deerlin, V. M., Elman, L., McCluskey, L., Lee, V. M.-Y., & Trojanowski, J. Q.
- Affiliations
- Universität Ulm (DE)
- University of Pennsylvania (US)
- Corresponding author
- Brettschneider, Johannes
- Venue
- PLoS ONE
- Publisher
- Public Library of Science (PLoS)
- Published
- 2012-06-14
- Volume
- 7
- Issue
- 6
- Pages
- e39216
- ISSN
- 1932-6203 (ISSN-L)
- PMC
- PMC3375234
- OpenAlex
- W1974485241
- Cited by
- 268
- References
- 68
- Citations by year
- 2026: 16 · 2025: 18 · 2024: 23 · 2023: 27 · 2022: 24 · 2021: 25 · 2020: 24 · 2019: 24 · 2018: 15 · 2017: 22 · 2016: 10 · 2015: 13 · 2014: 12 · 2013: 13 · 2012: 2
- FWCI
- 8.26
- Type
- journal article
- Language
- en
- Open access
- gold
- doi.org
- Locations
- PLoS ONE (publishedVersion, cc-by)
- PubMed Central (publishedVersion, cc-by)
- PubMed (publishedVersion)
- DOAJ (DOAJ: Directory of Open Access Journals) (submittedVersion, cc-by-sa)
- Figshare (submittedVersion, cc-by)
- Funders
- Deutsche Forschungsgemeinschaft (AG10124)
- National Institutes of Health (AG 10 124, AG 17586)
- National Institute on Aging (AG033101, AG-32953, P30AG010124, P01AG017586, AG17586, AG-10124, K08AG033101, P01AG032953)
- Topics
- Health Sciences › Medicine › Clinical Neurology › Amyotrophic Lateral Sclerosis Research
- Life Sciences › Neuroscience › Neurology › Neuroinflammation and Neurodegeneration Mechanisms
- Life Sciences › Neuroscience › Cellular and Molecular Neuroscience › Alzheimer's disease research and treatments
- Keywords
- amyotrophic lateral sclerosis, microglial activation, upper motor neuron lesion, corticospinal tract, C9orf72 repeat expansion, disease progression, TDP-43 pathology, demyelination, axonal loss, neuroinflammation, motor cortex, medulla
- MeSH terms
- Aged, Amyotrophic Lateral Sclerosis, Axons, Base Sequence, Female, Humans, Male, Middle Aged, Motor Neurons, Cohort Studies, Polymerase Chain Reaction, Open Reading Frames, Microglia, DNA Primers, Disease Progression
About these checks
Registry, retraction, Cites and statistics results are computed, not judged, with one exception: a printed reference that no index lists is read once by a model before it counts as a citation error. Claims are extracted by a model and kept only when their quote appears verbatim in the text; each cited source is then checked, with a model’s help, for whether it says what the claim relies on. Those verdicts can be wrong — read the claim’s quote and the cited source before relying on one.
Statistics and arithmetic are recomputed, not judged.
Confidence bands are shown only for fields calibrated on our annotated test set. None is calibrated yet, so no band is shown.
What counts as a claim ›How we measure confidence ›How we check this ›
Are you an author, or do you see a problem with this page? Request a review
