Student or educator? Sign up with your school email and get 6 months of Pro free.
Cited by 97

The DOI matches its Crossref record; 52 of the 52 references it cites were found in a registry or an index.

APE1/Ref-1 regulates STAT3 transcriptional activity and APE1/Ref-1-STAT3 dual-targeting effectively inhibits pancreatic cancer cell survival

Cardoso, Angelo A., Jiang, Yanlin, Luo, Meihua, Reed, April M., Shahda, Safi, He, Ying, Maitra, Anirban, Kelley, Mark R., Fishel, Melissa L.·2012·PLoS ONE

Abstract

Pancreatic cancer is a largely incurable disease, and increasing evidence supports strategies targeting multiple molecular mediators of critical functions of pancreatic ductal adenocarcinoma cells. Intracellular redox state modulates the activity of various signal transduction pathways and biological processes, including cell survival, drug resistance and responsiveness to microenvironmental factors. Recently, it has been shown that the transcription factor STAT3 is under redox control, but the mechanisms involved in its regulation are unknown. Here, we demonstrate for the first time that STAT3 DNA binding and transcriptional activity is directly regulated by the redox function of the APE1/Ref-1 endonuclease, using overexpression and redox-specific mutational strategies, and gene knockdown. Also, pharmacological blockade of APE1/Ref-1 by the redox-selective inhibitor E3330 abrogates STAT3 DNA binding. Since APE1/Ref-1 also exerts redox control on other cancer-associated transcription factors, we assessed the impact of dual-targeting of STAT3 signaling and APE1/Ref-1 redox on pancreatic cancer cell functions. We observed that disruption of APE1/Ref-1 redox activity synergizes with STAT3 blockade to potently inhibit the proliferation and viability of human PDAC cells. Mechanistically, we show that STAT3-APE1/Ref-1 dual targeting promotes marked tumor cell apoptosis, with engagement of caspase-3 signaling, which are significantly increased in comparison to the effects triggered by single target blockade. Also, we show that STAT3-APE1/Ref-1 dual blockade results in significant inhibition of tumor cell migration. Overall, this work demonstrates that the transcriptional activity of STAT3 is directly regulated by the redox function of APE1/Ref-1, and that concurrent blockade of STAT3 and APE1/Ref-1 redox synergize effectively inhibit critical PDAC cell functions.

Overview

The claims and statistics of this paper haven’t been checked yet.

Run the check — free, no account needed. It reads the open-access text and checks the sources it cites.

A few free checks a day · papers already verified open instantly · results are public

Integrity signals

Registry

Crossref · 10.1371/journal.pone.0047462

Cites

52 of 52 references verified0 citation errors · 0 not checkable

Statistics

Figures

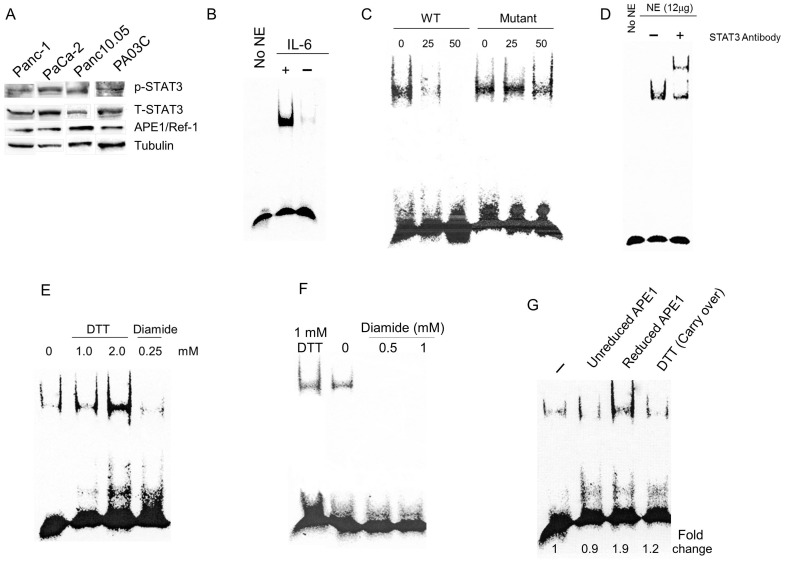
Figure 1 STAT3 is under APE1 redox control in PDAC cells. A) Immunoblotting for STAT3 (pY705) in PDAC cells; total STAT3 levels shown in middle panel. APE1 protein levels are shown for the patient-derived lines and tubulin is the loading control. B) STAT3 EMSA assay in PaCa-2 cells stimulated with IL-6, NE = nuclear extract; C) Competitive EMSA on STAT3 using nuclear extract from PaCa-2 cells and either 25- or 50-fold cold probe (WT or STAT3 binding-defective mutant); D) Supershift of STAT3 DNA binding using nuclear extract; E) STAT3 EMSA assay following treatment with DTT and diamide. F) STAT3 EMSA assay following treatment with DTT or increasing concentrations of diamide, as indicated. G) STAT3 EMSA assay with reduced APE1. DTT (Carry-over) reflects 0.04 mM DTT as used in the reaction after reducing the APE1 protein. For all EMSA assays, nuclear extract from PaCa-2 cells was treated with IL-6 (50 ng/mL) for 2 hrs in 2% FBS, unless otherwise indicated.
Figure 1 STAT3 is under APE1 redox control in PDAC cells. A) Immunoblotting for STAT3 (pY705) in PDAC cells; total STAT3 levels shown in middle panel. APE1 protein levels are shown for the patient-derived lines and tubulin is the loading control. B) STAT3 EMSA assay in PaCa-2 cells stimulated with IL-6, NE = nuclear extract; C) Competitive EMSA on STAT3 using nuclear extract from PaCa-2 cells and either 25- or 50-fold cold probe (WT or STAT3 binding-defective mutant); D) Supershift of STAT3 DNA binding using nuclear extract; E) STAT3 EMSA assay following treatment with DTT and diamide. F) STAT3 EMSA assay following treatment with DTT or increasing concentrations of diamide, as indicated. G) STAT3 EMSA assay with reduced APE1. DTT (Carry-over) reflects 0.04 mM DTT as used in the reaction after reducing the APE1 protein. For all EMSA assays, nuclear extract from PaCa-2 cells was treated with IL-6 (50 ng/mL) for 2 hrs in 2% FBS, unless otherwise indicated.CC BY · PubMed Central
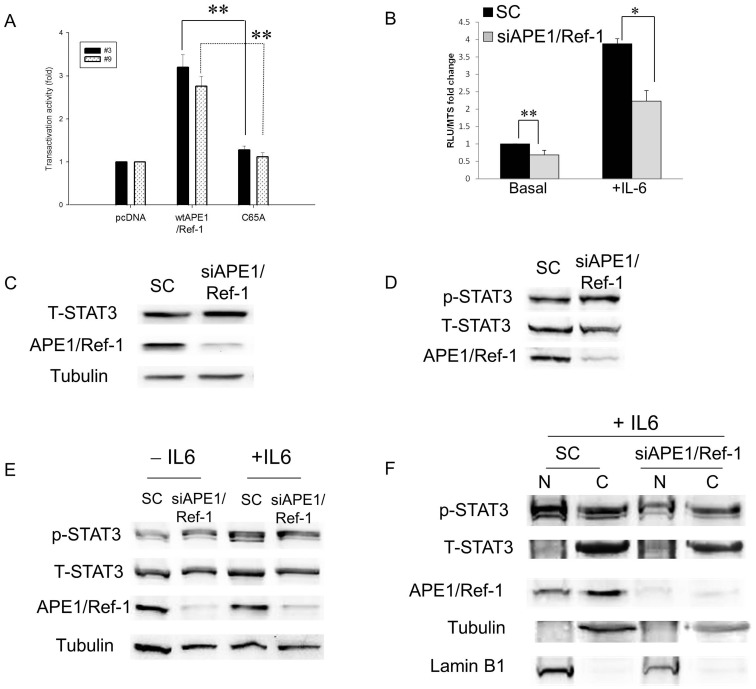
Figure 2 Effects of modulation of APE1 expression on STAT3 transactivation in PDAC cells. A) Panc-1 cells transiently transfected with pcDNA3, pcDNA3-wt-APE1, or pcDNA3-C65A-APE1 were assayed for STAT3 activity via luciferase reporter assay at 30 hr post-transfection. **p<0.01, n = 3 for each clone comparing wt to C65A. B) STAT3 Reporter assay of Panc-1 cells transfected with scrambled or APE1 siRNA (50 nM) and stimulated with IL-6 (50 ng/mL, 6 hr). * p<0.05, **p<0.01, n = 6 comparing SC to siAPE1. C) Western blot of total STAT3 protein levels following APE1 knockdown in PaCa-2 cells. Tubulin was used as a loading control. D) p-STAT3 (Y705) levels following APE1 knockdown in PaCa-2 cells. E) Immunoblots of whole cell extracts showing that stimulation with IL-6 (50 ng/mL, 3 hrs) increases p-STAT3 levels in both SC- and siAPE1- treated cells but does not change the levels of total STAT3 protein. F) Western blot of fractionated PaCa-2 cells stimulated with IL-6 and transfected with siRNA: nuclear (N) and cytoplasmic (C) fractions. Tubulin was utilized as a loading control for cytoplasm and Lamin B1 for nuclear.
Figure 2 Effects of modulation of APE1 expression on STAT3 transactivation in PDAC cells. A) Panc-1 cells transiently transfected with pcDNA3, pcDNA3-wt-APE1, or pcDNA3-C65A-APE1 were assayed for STAT3 activity via luciferase reporter assay at 30 hr post-transfection. **p<0.01, n = 3 for each clone comparing wt to C65A. B) STAT3 Reporter assay of Panc-1 cells transfected with scrambled or APE1 siRNA (50 nM) and stimulated with IL-6 (50 ng/mL, 6 hr). * p<0.05, **p<0.01, n = 6 comparing SC to siAPE1. C) Western blot of total STAT3 protein levels following APE1 knockdown in PaCa-2 cells. Tubulin was used as a loading control. D) p-STAT3 (Y705) levels following APE1 knockdown in PaCa-2 cells. E) Immunoblots of whole cell extracts showing that stimulation with IL-6 (50 ng/mL, 3 hrs) increases p-STAT3 levels in both SC- and siAPE1- treated cells but does not change the levels of total STAT3 protein. F) Western blot of fractionated PaCa-2 cells stimulated with IL-6 and transfected with siRNA: nuclear (N) and cytoplasmic (C) fractions. Tubulin was utilized as a loading control for cytoplasm and Lamin B1 for nuclear.CC BY · PubMed Central
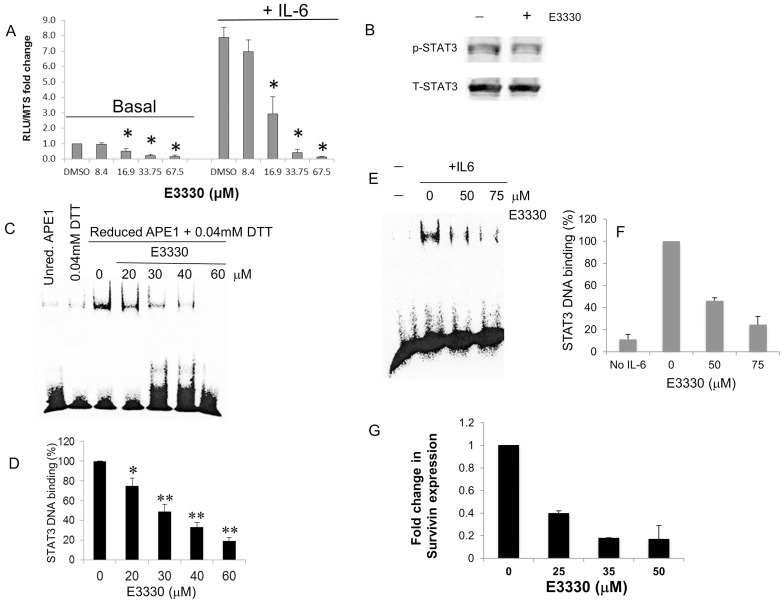
Figure 3 STAT3 activity following treatment of PDAC cells with APE1 redox inhibitor, E3330. A) STAT3 reporter assay in Panc-1 cells following treatment with E3330 (24 h) and stimulation with IL-6 (6 h). Doses were based on survival data from previously published data [4]. * p<0.05 t test, n = 6 comparing DMSO control to drug-treated samples. B) Representative Western blot of PaCa-2 cells treated with E3330 (50 µM, 24 hr). C) Addition of E3330 to the EMSA reaction inhibits the STAT3 DNA binding of nuclear extracts stimulated with IL-6. Representative EMSA blot shown with quantitation of three independent experiments in D. * p<0.05, ** p<0.01, compared to DMSO control, using Student’s t test. E) STAT3 DNA binding via EMSA assay following treatment of PaCa-2 cells with E3330 (2 h) and then stimulated with IL-6 (50 ng/mL, 2 h) with quantitation in (F) where intensity of binding was compared to amount of STAT3 DNA binding with IL-6 stimulation; G) qPCR analysis of Survivin expression following E3330 treatment for 24 h in patient-derived cells, Pa02C. Shown is data from 2–3 individual experiments (avg±SE). Samples were run in triplicate and normalized to DMSO vehicle control.
Figure 3 STAT3 activity following treatment of PDAC cells with APE1 redox inhibitor, E3330. A) STAT3 reporter assay in Panc-1 cells following treatment with E3330 (24 h) and stimulation with IL-6 (6 h). Doses were based on survival data from previously published data [4]. * p<0.05 t test, n = 6 comparing DMSO control to drug-treated samples. B) Representative Western blot of PaCa-2 cells treated with E3330 (50 µM, 24 hr). C) Addition of E3330 to the EMSA reaction inhibits the STAT3 DNA binding of nuclear extracts stimulated with IL-6. Representative EMSA blot shown with quantitation of three independent experiments in D. * p<0.05, ** p<0.01, compared to DMSO control, using Student’s t test. E) STAT3 DNA binding via EMSA assay following treatment of PaCa-2 cells with E3330 (2 h) and then stimulated with IL-6 (50 ng/mL, 2 h) with quantitation in (F) where intensity of binding was compared to amount of STAT3 DNA binding with IL-6 stimulation; G) qPCR analysis of Survivin expression following E3330 treatment for 24 h in patient-derived cells, Pa02C. Shown is data from 2–3 individual experiments (avg±SE). Samples were run in triplicate and normalized to DMSO vehicle control.CC BY · PubMed Central
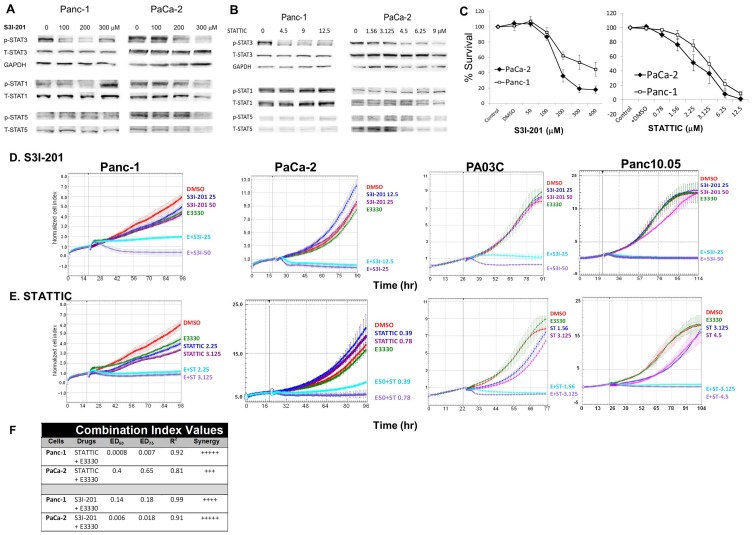
Figure 4 STAT3– APE1 dual targeting effectively inhibits PDAC cell proliferation. Immunoblotting of STAT proteins, p-STAT3(Y705), p-STAT1(Y701), and p-STAT5(Y694) in PDAC cells treated with S3I-201 (A) or STATTIC (B). DMSO was used as vehicle control and is included in the lane without STAT3 inhibitor. Panc-1 cells were treated with S3I-201 for 30 hr and STATTIC for 30 min. PaCa-2 cells were treated with S3I-201 and STATTIC for 24 hr. C) Dose response in PaCa-2 and Panc-1 cells following 72 hr treatment with S3I-201 or STATTIC via MTS assay. D, E) Cell proliferation after E3330 (50 µM for all lines, except 40 µM for Panc10.05) and S3I-201 or STATTIC treatment. Assays were performed in duplicate, representative experiment, from 2–4 independent experiments. F) Combination index (CI) values calculated with Calcusyn for combination of APE1 and STAT3 inhibitors at their ED50s in the MTS assay. CI values of <0.1, very strong synergy; 0.1–0.3: strong synergy; and 0.3–0.7: synergy.
Figure 4 STAT3– APE1 dual targeting effectively inhibits PDAC cell proliferation. Immunoblotting of STAT proteins, p-STAT3(Y705), p-STAT1(Y701), and p-STAT5(Y694) in PDAC cells treated with S3I-201 (A) or STATTIC (B). DMSO was used as vehicle control and is included in the lane without STAT3 inhibitor. Panc-1 cells were treated with S3I-201 for 30 hr and STATTIC for 30 min. PaCa-2 cells were treated with S3I-201 and STATTIC for 24 hr. C) Dose response in PaCa-2 and Panc-1 cells following 72 hr treatment with S3I-201 or STATTIC via MTS assay. D, E) Cell proliferation after E3330 (50 µM for all lines, except 40 µM for Panc10.05) and S3I-201 or STATTIC treatment. Assays were performed in duplicate, representative experiment, from 2–4 independent experiments. F) Combination index (CI) values calculated with Calcusyn for combination of APE1 and STAT3 inhibitors at their ED50s in the MTS assay. CI values of <0.1, very strong synergy; 0.1–0.3: strong synergy; and 0.3–0.7: synergy.CC BY · PubMed Central
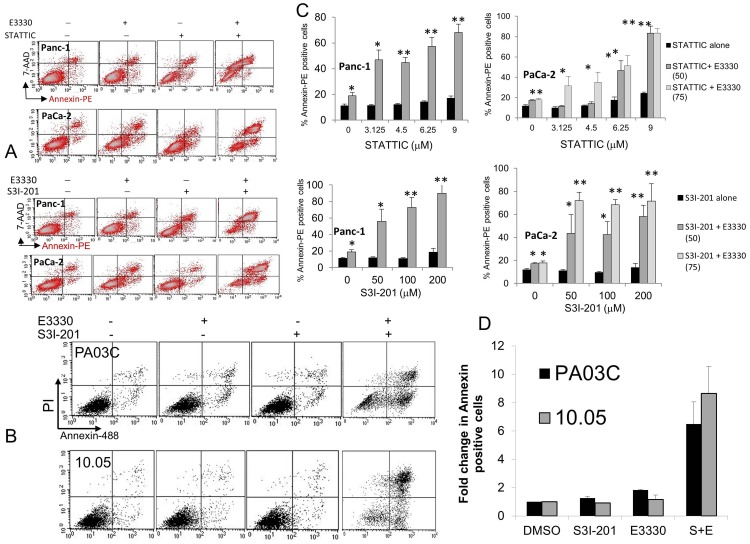
Figure 5 Effect on apoptosis of inhibition of APE1 in combination with STAT3 inhibitors in Panc-1, PaCa-2, and the patient-derived Pa03C and Panc10.05 cells. Inhibitors were added simultaneously (E3330 40, 50, or 75 µM), and apoptosis was determined using Annexin-V (x-axis) and 7-AAD or PI (y-axis) staining after 24 hr. Representative dot plots are shown in A and B with high dose of STAT3 inhibitor for Panc-1 and PaCa-2 and 50µMS3I-201 for the patient-derived cells. Graphical representation represents >3 independent experiments; *, p<0.05, **, p<0.01 all compared to STAT3 inhibitor alone at corresponding dose (A, C) or 2 independent experiments for (B, D).
Figure 5 Effect on apoptosis of inhibition of APE1 in combination with STAT3 inhibitors in Panc-1, PaCa-2, and the patient-derived Pa03C and Panc10.05 cells. Inhibitors were added simultaneously (E3330 40, 50, or 75 µM), and apoptosis was determined using Annexin-V (x-axis) and 7-AAD or PI (y-axis) staining after 24 hr. Representative dot plots are shown in A and B with high dose of STAT3 inhibitor for Panc-1 and PaCa-2 and 50µMS3I-201 for the patient-derived cells. Graphical representation represents >3 independent experiments; *, p<0.05, **, p<0.01 all compared to STAT3 inhibitor alone at corresponding dose (A, C) or 2 independent experiments for (B, D).CC BY · PubMed Central
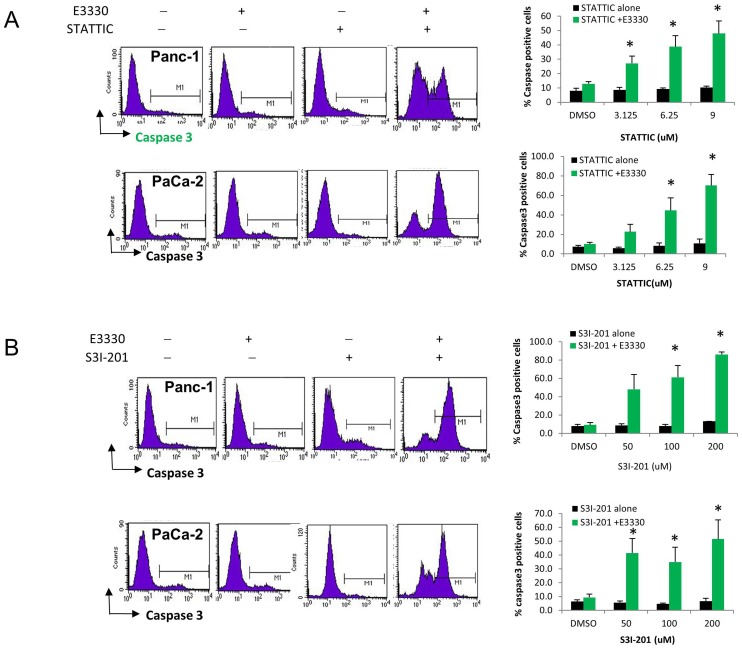
Figure 6 Dual STAT3– APE1 targeting activates Caspase 3 in PDAC cells. Panc-1 and PaCa-2 cells were treated with E3330 (50, 75 µM) and increasing amounts of STATTIC (A) or S3I-201 (B) and assayed for caspase 3 activity. The graphs represent >3 independent experiments; *, p<0.05, all compared to STAT3 inhibitor alone at corresponding dose.
Figure 6 Dual STAT3– APE1 targeting activates Caspase 3 in PDAC cells. Panc-1 and PaCa-2 cells were treated with E3330 (50, 75 µM) and increasing amounts of STATTIC (A) or S3I-201 (B) and assayed for caspase 3 activity. The graphs represent >3 independent experiments; *, p<0.05, all compared to STAT3 inhibitor alone at corresponding dose.CC BY · PubMed Central
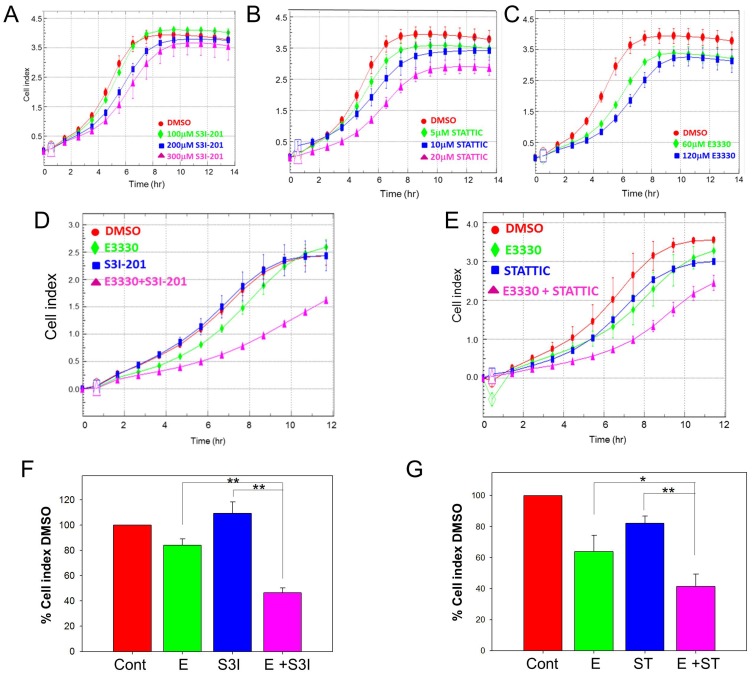
Figure 7 STAT3– APE1 dual targeting inhibits PDAC cell migration. Migration assayed via xCELLigence system, treatment with increasing amounts of S3I-201 (A), STATTIC (B), or E3330 (C). Combination of E3330 (75 µM) with STAT3 inhibitor S3I-201 (D), 50 µM or STATTIC (E), 10 µM dramatically reduces the cell’s migratory ability. Quantitation of three individual experiments at 8 hr is shown in F and G. * p<0.05, ** p<0.01 using paired t test comparing inhibitor alone versus combination treatment.
Figure 7 STAT3– APE1 dual targeting inhibits PDAC cell migration. Migration assayed via xCELLigence system, treatment with increasing amounts of S3I-201 (A), STATTIC (B), or E3330 (C). Combination of E3330 (75 µM) with STAT3 inhibitor S3I-201 (D), 50 µM or STATTIC (E), 10 µM dramatically reduces the cell’s migratory ability. Quantitation of three individual experiments at 8 hr is shown in F and G. * p<0.05, ** p<0.01 using paired t test comparing inhibitor alone versus combination treatment.CC BY · PubMed Central
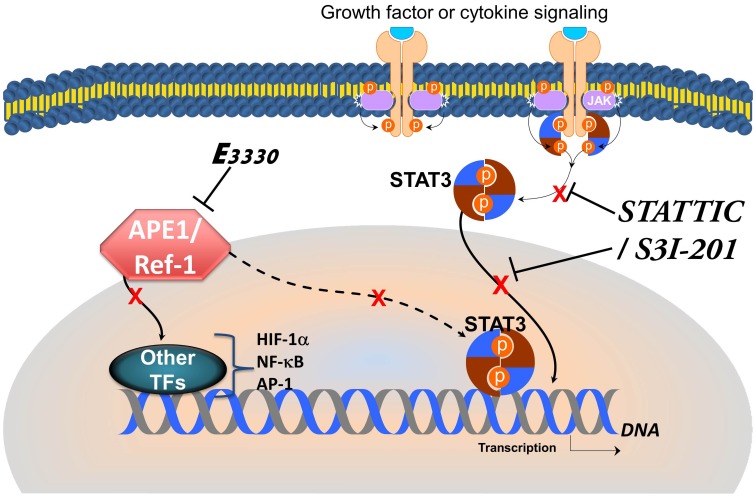
Figure 8 Model showing inhibition of STAT3 phosphorylation and nuclear translocation via S3I-201 or STATTIC as well as inhibition of STAT3 DNA binding via APE1 disruption. TF = Transcription factor.
Figure 8 Model showing inhibition of STAT3 phosphorylation and nuclear translocation via S3I-201 or STATTIC as well as inhibition of STAT3 DNA binding via APE1 disruption. TF = Transcription factor.CC BY · PubMed Central

Verification

Claims the paper makes

The claims and statistics of this paper haven’t been checked yet.

Run the check — free, no account needed. It reads the open-access text and checks the sources it cites.

A few free checks a day · papers already verified open instantly · results are public

Claims other papers make about this one

Each is checked against this paper’s own text: does it say what the citing paper says it does?

Self-check

Percentages, sums and reported differences re-computed from the paper’s own numbers.

The self-check needs the paper’s full text.

Citations

Cites

Show all 52 references

Cited by

Metadata

Authors
Cardoso, A. A., Jiang, Y., Luo, M., Reed, A. M., Shahda, S., He, Y., Maitra, A., Kelley, M. R., & Fishel, M. L.
Venue
PLoS ONE
Published
2012-10-19
Volume
7
Issue
10
Pages
e47462
ISSN
1932-6203
Cited by
97
References
52
Language
en

About these checks

Registry, retraction, Cites and statistics results are computed, not judged, with one exception: a printed reference that no index lists is read once by a model before it counts as a citation error. Claims are extracted by a model and kept only when their quote appears verbatim in the text; each cited source is then checked, with a model’s help, for whether it says what the claim relies on. Those verdicts can be wrong — read the claim’s quote and the cited source before relying on one.

Statistics and arithmetic are recomputed, not judged.

Confidence bands are shown only for fields calibrated on our annotated test set. None is calibrated yet, so no band is shown.

What counts as a claim ›How we measure confidence ›How we check this ›

Are you an author, or do you see a problem with this page? Request a review

Data sources

Bibliographic data: Semantic Scholar, OpenAlex, Crossref.

Contains information from the Semantic Scholar Academic Graph Datasets, made available under the ODC Attribution License (ODC-BY 1.0).

Semantic Scholar’s data is described in: Kinney, R., et al. (2023). The Semantic Scholar Open Data Platform. arXiv:2301.10140.