

The DOI matches its Crossref record; 42 of the 42 references it cites were found in a registry or an index.
TGF-b Superfamily Cytokine MIC-1/GDF15 Is a Physiological Appetite and Body Weight Regulator
Open accessAbstract
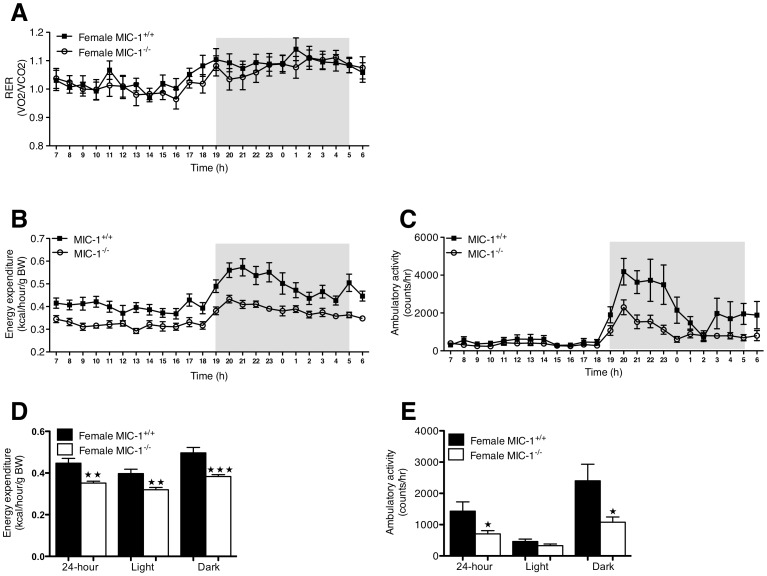
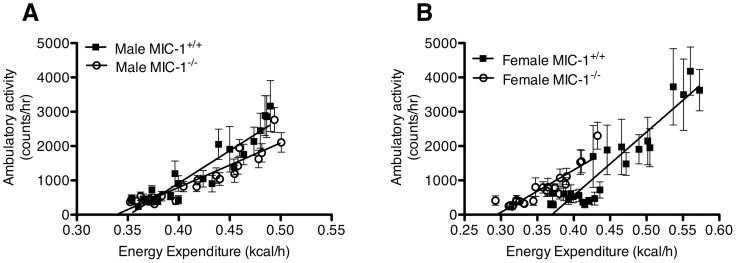
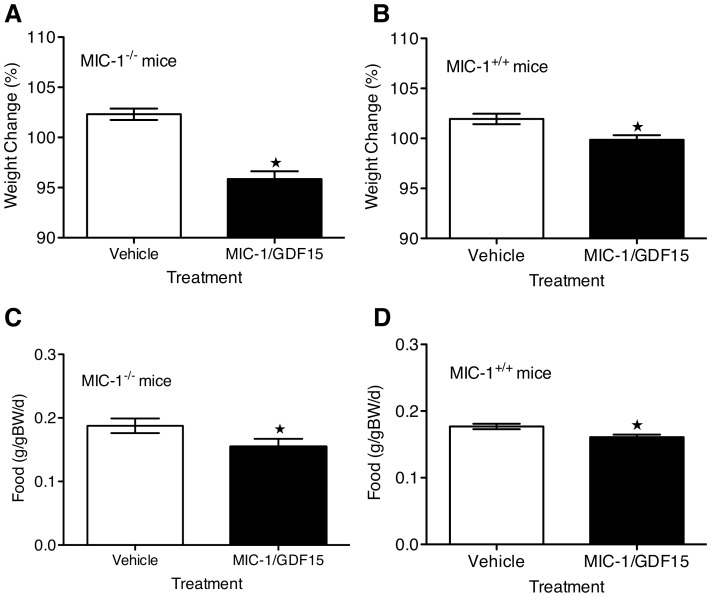
The TGF-b superfamily cytokine MIC-1/GDF15 circulates in all humans and when overproduced in cancer leads to anorexia/cachexia, by direct action on brain feeding centres. In these studies we have examined the role of physiologically relevant levels of MIC-1/GDF15 in the regulation of appetite, body weight and basal metabolic rate. MIC-1/GDF15 gene knockout mice (MIC-1(-/-)) weighed more and had increased adiposity, which was associated with increased spontaneous food intake. Female MIC-1(-/-) mice exhibited some additional alterations in reduced basal energy expenditure and physical activity, possibly owing to the associated decrease in total lean mass. Further, infusion of human recombinant MIC-1/GDF15 sufficient to raise serum levels in MIC-1(-/-) mice to within the normal human range reduced body weight and food intake. Taken together, our findings suggest that MIC-1/GDF15 is involved in the physiological regulation of appetite and energy storage.
Overview
The claims and statistics of this paper haven’t been checked yet.
Run the check — free, no account needed. It reads the open-access text and checks the sources it cites.
Integrity signals
Registry
Cites
Statistics
Figures
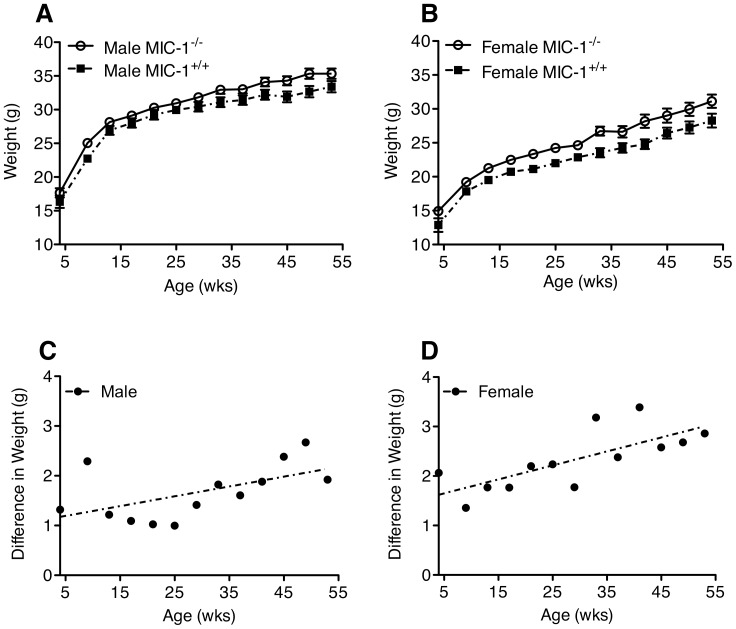
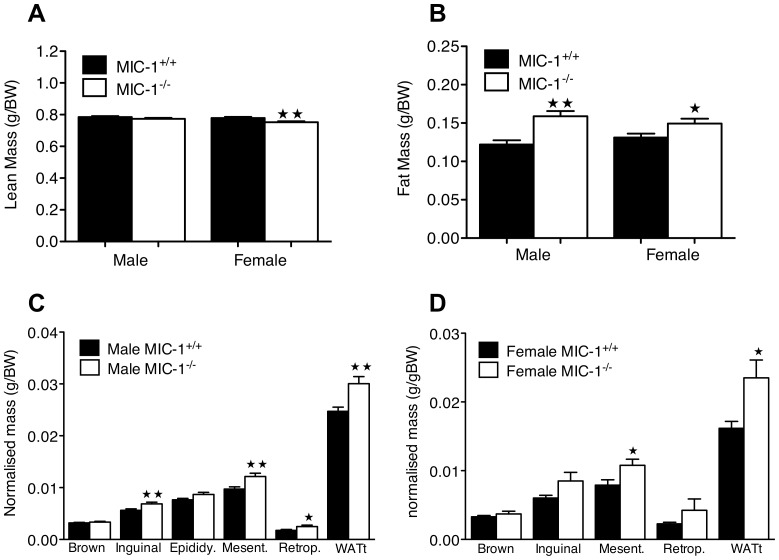
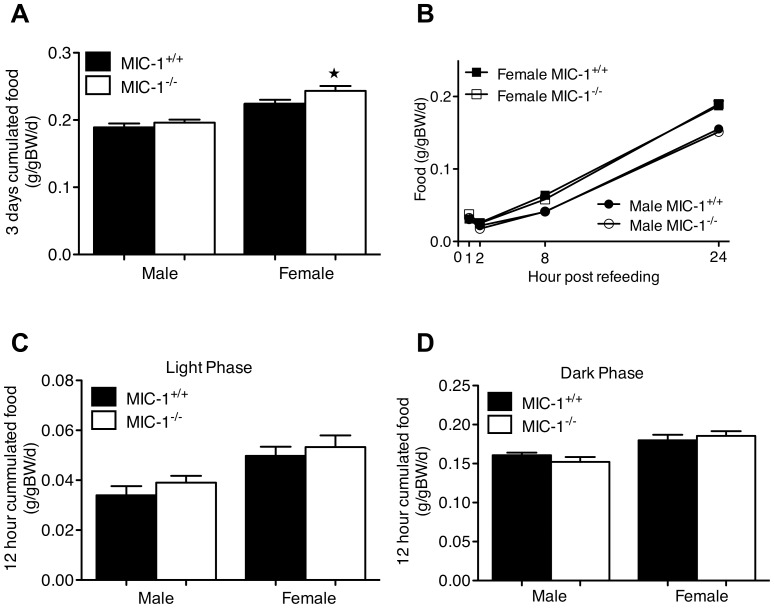
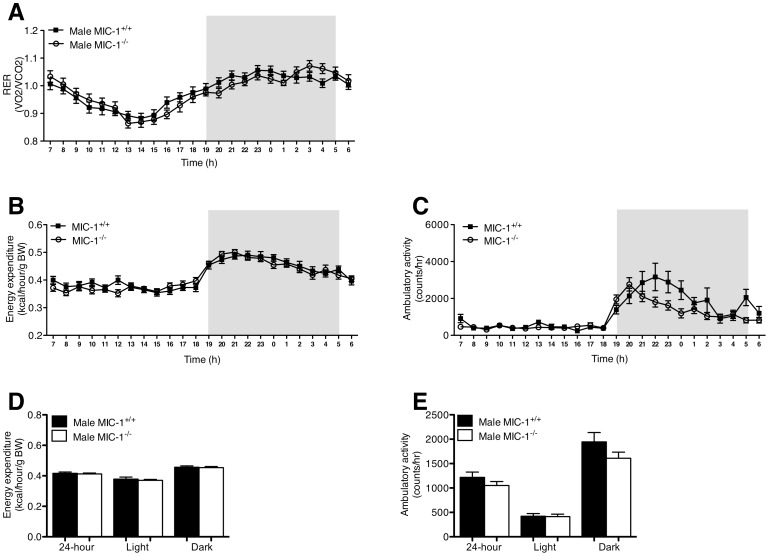
Verification
Claims the paper makes
The claims and statistics of this paper haven’t been checked yet.
Run the check — free, no account needed. It reads the open-access text and checks the sources it cites.
Claims other papers make about this one
Each is checked against this paper’s own text: does it say what the citing paper says it does?
The source backs part of the claim, not all of it — or backs it for a different population, condition or comparison.
In the citing paper
“Tsai et al. (107) reported that GDF-15 gene knockout mice (Gdf-15 (-/-)) weighed more and had increased adiposity, which was associated with increased food intake, and that infusion of human recombinant GDF-15 was sufficient to raise serum levels in Gdf-15 (-/-) mice to within the normal human range, reducing body weight and food intake.”
From GDF-15 as a Weight Watcher for Diabetic and Non-Diabetic People Treated With Metformin (2020) · cites this paper as [107]
Experimental — accuracy not yet measuredIn the citing paper
“In line with these studies, exogenous administration of recombinant murine or human GDF-15 induced weight loss in different animal models (26, 32, 40, 41, 107).”
From GDF-15 as a Weight Watcher for Diabetic and Non-Diabetic People Treated With Metformin (2020) · cites this paper as [107]
In the citing paper
“Tsai et al. (107) reported that GDF-15 gene knockout mice (Gdf-15 (-/-)) weighed more and had increased adiposity, which was associated with increased food intake, and that infusion of human recombinant GDF-15 was sufficient to raise serum levels in Gdf-15 (-/-) mice to within the normal human range, reducing body weight and food intake.”
From GDF-15 as a Weight Watcher for Diabetic and Non-Diabetic People Treated With Metformin (2020) · cites this paper as [107]
Self-check
Percentages, sums and reported differences re-computed from the paper’s own numbers.
The self-check needs the paper’s full text.
Citations
Cites
Calculation of substrate oxidation rates in vivo from gaseous exchange.
Frayn, K. N. (1983) · Journal of Applied Physiology · doi:10.1152/jappl.1983.55.2.628 · Cited by 2,365
Obesity and the Environment: Where Do We Go from Here?
Hill, J. O., Wyatt, H. R., Reed, G. W., & Peters, J. C. (2003) · Science · doi:10.1126/science.1079857 · Cited by 2,180
Hatori, M., Vollmers, C., Zarrinpar, A., DiTacchio, L., Bushong, E. A., Gill, S., Leblanc, M., Chaix, A., Joens, M., Fitzpatrick, J. A. J., et al. (2012) · Cell Metabolism · doi:10.1016/j.cmet.2012.04.019 · Cited by 1,986
Antibiotics in early life alter the murine colonic microbiome and adiposity
Cho, I., Yamanishi, S., Cox, L., Methé, B. A., Zavadil, J., Li, K., Gao, Z., Mahana, D., Raju, K., Teitler, I., et al. (2012) · Nature · doi:10.1038/nature11400 · Cited by 1,613
The theoretical bases of indirect calorimetry: A review
Ferrannini, E. (1988) · Metabolism · doi:10.1016/0026-0495(88)90110-2 · Cited by 1,604
MIC-1, a novel macrophage inhibitory cytokine, is a divergent member of the TGF-β superfamily
Bootcov, M. R., Bauskin, A. R., Valenzuela, S. M., Moore, A. G., Bansal, M., He, X. Y., Zhang, H. P., Donnellan, M., Mahler, S. M., Pryor, K., et al. (1997) · Proceedings of the National Academy of Sciences · doi:10.1073/pnas.94.21.11514 · Cited by 1,180
New role of bone morphogenetic protein 7 in brown adipogenesis and energy expenditure
Tseng, Y.-H., Kokkotou, E., Schulz, T. J., Huang, T. L., Winnay, J. N., Taniguchi, C. M., Tran, T. T., Suzuki, R., Espinoza, D. O., Yamamoto, Y., et al. (2008) · Nature · doi:10.1038/nature07221 · Cited by 1,099
The Hormonal Control of Food Intake
Coll, A. P., Farooqi, I. S., & O’Rahilly, S. (2007) · Cell · doi:10.1016/j.cell.2007.04.001 · Cited by 624
Tumor-induced anorexia and weight loss are mediated by the TGF-β superfamily cytokine MIC-1
Johnen, H., Lin, S., Kuffner, T., Brown, D. A., Tsai, V. W.-W., Bauskin, A. R., Wu, L., Pankhurst, G., Jiang, L., Junankar, S., et al. (2007) · Nature Medicine · doi:10.1038/nm1677 · Cited by 612
Self-citationLarge-Scale Delineation of Secreted Protein Biomarkers Overexpressed in Cancer Tissue and Serum
Welsh, J. B., Sapinoso, L. M., Kern, S. G., Brown, D. A., Liu, T., Bauskin, A. R., Ward, R. L., Hawkins, N. J., Quinn, D. I., Russell, P. J., et al. (2003) · Proceedings of the National Academy of Sciences · doi:10.1073/pnas.0530278100 · Cited by 503
Cited by
Sorted by citations
GFRAL is the receptor for GDF15 and the ligand promotes weight loss in mice and nonhuman primates
Mullican, S. E., Lin-Schmidt, X., Chin, C.-N., Chavez, J. A., Furman, J. L., Armstrong, A. A., Beck, S. C., South, V. J., Dinh, T. Q., Cash-Mason, T. D., et al. (2017) · Nature Medicine · doi:10.1038/nm.4392 · Cited by 774
GFRAL is the receptor for GDF15 and is required for the anti-obesity effects of the ligand
Yang, L., Chang, C.-C., Sun, Z., Madsen, D., Zhu, H., Padkjær, S. B., Wu, X., Huang, T., Hultman, K., Paulsen, S. J., et al. (2017) · Nature Medicine · doi:10.1038/nm.4394 · Cited by 668
GDF15 Provides an Endocrine Signal of Nutritional Stress in Mice and Humans
Patel, S., Alvarez-Guaita, A., Melvin, A., Rimmington, D., Dattilo, A., Miedzybrodzka, E. L., Cimino, I., Maurin, A.-C., Roberts, G. P., Meek, C. L., et al. (2019) · Cell Metabolism · doi:10.1016/j.cmet.2018.12.016 · Cited by 509
GDF15: emerging biology and therapeutic applications for obesity and cardiometabolic disease
Wang, D., Day, E. A., Townsend, L. K., Djordjevic, D., Jørgensen, S. B., & Steinberg, G. R. (2021) · Nature Reviews Endocrinology · doi:10.1038/s41574-021-00529-7 · Cited by 543
GDF15 Is an Inflammation-Induced Central Mediator of Tissue Tolerance
Luan, H. H., Wang, A., Hilliard, B. K., Carvalho, F., Rosen, C. E., Ahasic, A. M., Herzog, E. L., Kang, I., Pisani, M. A., Yu, S., et al. (2019) · Cell · doi:10.1016/j.cell.2019.07.033 · Cited by 527
Metadata
- Authors
- Tsai, V. W.-W., Macia, L., Johnen, H., Kuffner, T., Manadhar, R., Jørgensen, S. B., Lee-Ng, K. K. M., Zhang, H. P., Wu, L., Marquis, C. P., Jiang, L., Husaini, Y., Lin, S., Herzog, H., Brown, D. A., Sainsbury, A., & Breit, S. N.
- Affiliations
- UNSW Sydney (AU)
- Garvan Institute of Medical Research (AU)
- Novo Nordisk (Denmark) (DK)
- Corresponding author
- Breit, Samuel N.
- ORCID
- Venue
- PLoS ONE
- Publisher
- Public Library of Science (PLoS)
- Published
- 2013-02-28
- Volume
- 8
- Issue
- 2
- Pages
- e55174
- ISSN
- 1932-6203 (ISSN-L)
- PMC
- PMC3585300
- OpenAlex
- W1983011875
- Cited by
- 188
- References
- 42
- Citations by year
- 2026: 7 · 2025: 11 · 2024: 20 · 2023: 20 · 2022: 17 · 2021: 18 · 2020: 24 · 2019: 24 · 2018: 9 · 2017: 12 · 2016: 10 · 2015: 7 · 2014: 8 · 2013: 1
- FWCI
- 4.67
- Type
- journal article
- Language
- en
- Open access
- gold
- doi.org
- Locations
- PLoS ONE (publishedVersion, cc-by)
- Europe PMC (PubMed Central) (publishedVersion, cc-by)
- PubMed Central (publishedVersion, cc-by)
- PubMed (publishedVersion)
- Monash University Research Portal (Monash University) (acceptedVersion, cc-by)
- The Sydney eScholarship Repository (The University of Sydney) (submittedVersion)
- UNSWorks (University of New South Wales, Sydney, Australia) (submittedVersion, cc-by-nc-nd)
- UNSWorks (UNSW Sydney) (submittedVersion, cc-by-nc-nd)
- DOAJ (DOAJ: Directory of Open Access Journals) (submittedVersion)
- Funders
- Medical Research Council
- National Health and Medical Research Council
- Topics
- Life Sciences › Neuroscience › Endocrine and Autonomic Systems › Regulation of Appetite and Obesity
- Health Sciences › Medicine › Cardiology and Cardiovascular Medicine › GDF15 and Related Biomarkers
- Life Sciences › Biochemistry, Genetics and Molecular Biology › Molecular Biology › Fibroblast Growth Factor Research
- Keywords
- appetite regulation, body weight regulation, basal metabolic rate, energy expenditure, dietary intake, adiposity, lean body mass, knockout mice, energy storage
- MeSH terms
- Adipose Tissue, Animals, Appetite, Body Weight, Eating, Energy Metabolism, Female, Genotype, Humans, Male, Organ Size, Sex Factors, Signal Transduction, Weight Gain, Mice, Knockout, Mice, Growth Differentiation Factor 15
About these checks
Registry, retraction, Cites and statistics results are computed, not judged, with one exception: a printed reference that no index lists is read once by a model before it counts as a citation error. Claims are extracted by a model and kept only when their quote appears verbatim in the text; each cited source is then checked, with a model’s help, for whether it says what the claim relies on. Those verdicts can be wrong — read the claim’s quote and the cited source before relying on one.
Statistics and arithmetic are recomputed, not judged.
Confidence bands are shown only for fields calibrated on our annotated test set. None is calibrated yet, so no band is shown.
What counts as a claim ›How we measure confidence ›How we check this ›
Are you an author, or do you see a problem with this page? Request a review
