

The DOI matches its Crossref record; 52 of the 52 references it cites were found in a registry or an index.
Diaphragm Postural Function Analysis Using Magnetic Resonance Imaging
Open accessAbstract
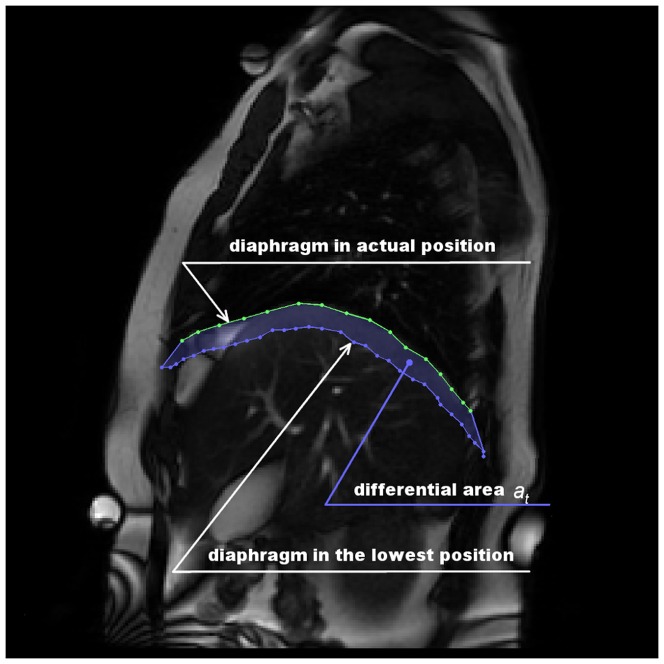
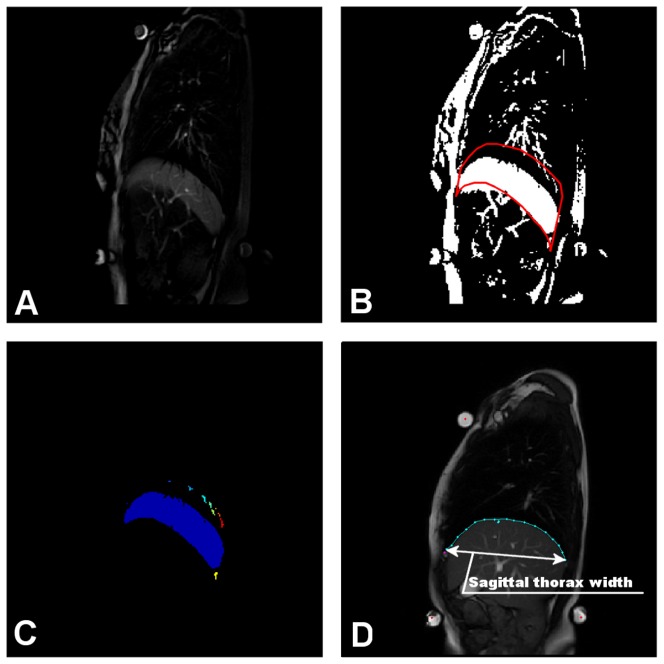
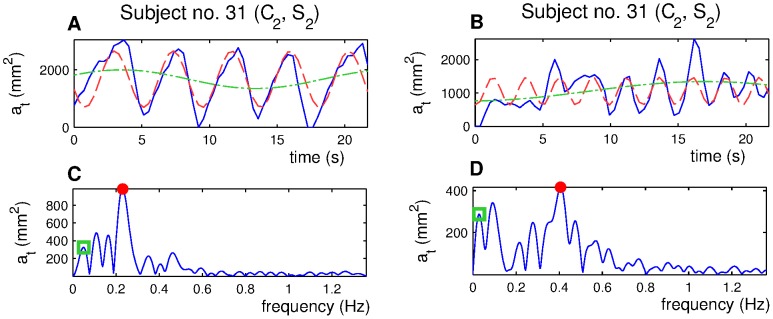
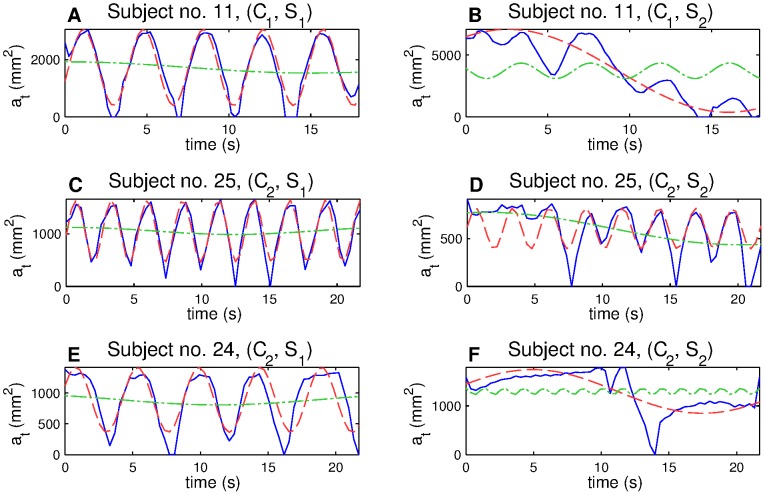
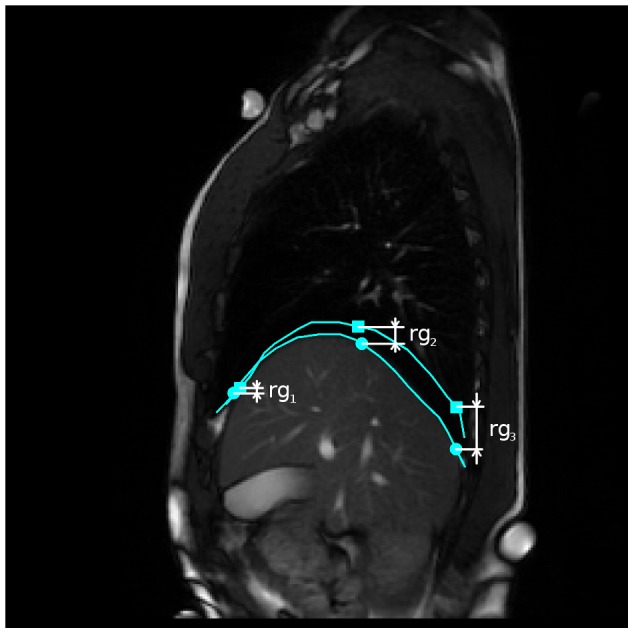
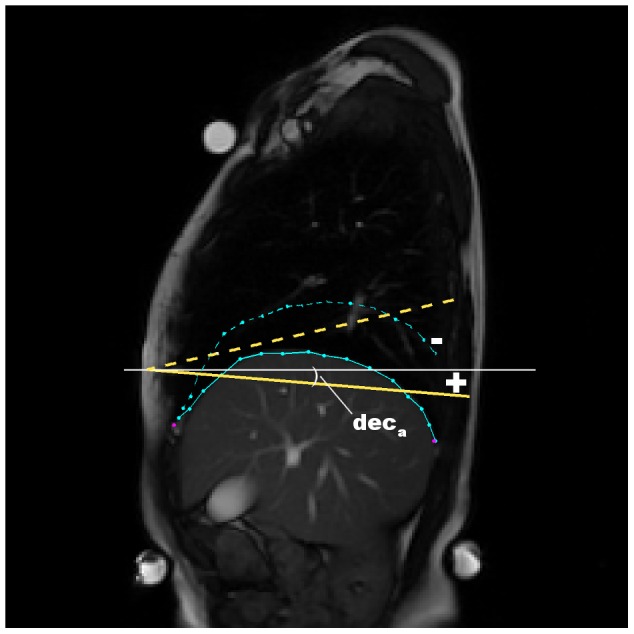
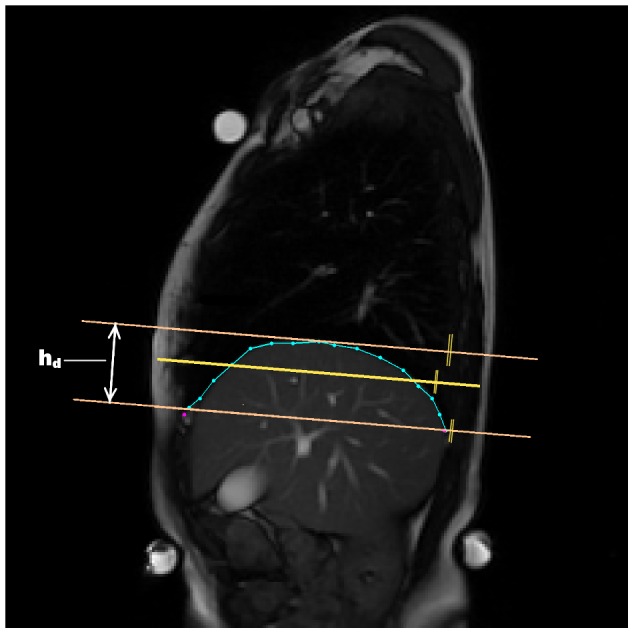
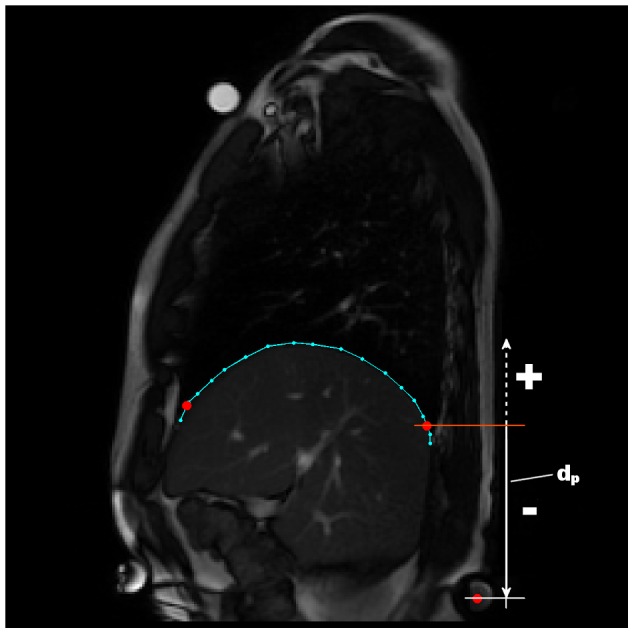
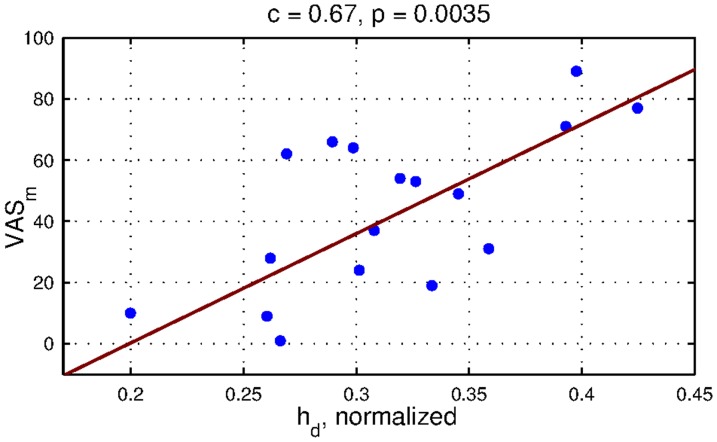
We present a postural analysis of diaphragm function using magnetic resonance imaging (MRI). The main aim of the study was to identify changes in diaphragm motion and shape when postural demands on the body were increased (loading applied to a distal part of the extended lower extremities against the flexion of the hips was used). Sixteen healthy subjects were compared with 17 subjects suffering from chronic low back pain and in whom structural spine disorders had been identified. Two sets of features were calculated from MRI recordings: dynamic parameters reflecting diaphragm action, and static parameters reflecting diaphragm anatomic characteristics. A statistical analysis showed that the diaphragm respiratory and postural changes were significantly slower, bigger in size and better balanced in the control group. When a load was applied to the lower limbs, the pathological subjects were mostly not able to maintain the respiratory diaphragm function, which was lowered significantly. Subjects from the control group showed more stable parameters of both respiratory and postural function. Our findings consistently affirmed worse muscle cooperation in the low back pain population subgroup. A clear relation with spinal findings and with low back pain remains undecided, but various findings in the literature were confirmed. The most important finding is the need to further address various mechanisms used by patients to compensate deep muscle insufficiency.
Overview
The claims and statistics of this paper haven’t been checked yet.
Free: it reads the open-access text and checks the first 5 claims that cite a source we can check. Create a free account to check every claim.
Integrity signals
Registry
Cites
Statistics
Figures
Verification
Claims the paper makes
The claims and statistics of this paper haven’t been checked yet.
Free: it reads the open-access text and checks the first 5 claims that cite a source we can check. Create a free account to check every claim.
Claims other papers make about this one
Each is checked against this paper’s own text: does it say what the citing paper says it does?
The cited source says what the claim attributes to it.
In the citing paper
“slow breathing was associated with greater diaphragm excursion in healthy humans, compared to patients with a chronic spinal pathology”
From The physiological effects of slow breathing in the healthy human (2017) · cites this paper as [16]
The cited source says what the claim attributes to it.
In the citing paper
“concluded that correct and balanced diaphragm performance helps to maintain abdominal pressure and “smooth” respiration [16].”
From The physiological effects of slow breathing in the healthy human (2017) · cites this paper as [16]
Self-check
Percentages, sums and reported differences re-computed from the paper’s own numbers.
The self-check needs the paper’s full text.
Citations
Cites
Magnetic Resonance Imaging of the Lumbar Spine in People without Back Pain
Jensen, M. C., Brant-Zawadzki, M. N., Obuchowski, N., Modic, M. T., Malkasian, D., & Ross, J. S. (1994) · New England Journal of Medicine · doi:10.1056/nejm199407143310201 · Cited by 2,402
Mechanical stability of the in vivo lumbar spine: implications for injury and chronic low back pain
Cholewicki, J., & McGill, S. (1996) · Clinical Biomechanics · doi:10.1016/0268-0033(95)00035-6 · Cited by 1,092
Kapandji, I. A. (1974) · Churchill Livingstone eBooks · Cited by 881
Hodges, P. W., & Richardson, C. A. (1999) · Archives of Physical Medicine and Rehabilitation · doi:10.1016/s0003-9993(99)90052-7 · Cited by 630
Evidence of Altered Lumbopelvic Muscle Recruitment in the Presence of Sacroiliac Joint Pain
Hungerford, B., Gilleard, W., & Hodges, P. (2003) · Spine · doi:10.1097/01.brs.0000076821.41875.1c · Cited by 416
Activation of the human diaphragm during a repetitive postural task
Hodges, P. W., & Gandevia, S. C. (2000) · The Journal of Physiology · doi:10.1111/j.1469-7793.2000.t01-1-00165.xm · Cited by 363
Changes in motor planning of feedforward postural responses of the trunk muscles in low back pain
Hodges, P. (2001) · Experimental Brain Research · doi:10.1007/s002210100873 · Cited by 348
Contraction of the human diaphragm during rapid postural adjustments
Hodges, P. W., Butler, J. E., McKenzie, D. K., & Gandevia, S. C. (1997) · The Journal of Physiology · doi:10.1111/j.1469-7793.1997.539bb.x · Cited by 309
Hodges, P. W., Gurfinkel, V. S., Brumagne, S., Smith, T. C., & Cordo, P. C. (2002) · Experimental Brain Research · doi:10.1007/s00221-002-1040-x · Cited by 282
Lumbar Stabilization: Core Concepts and Current Literature, Part 1
Barr, K. P., Griggs, M., & Cadby, T. (2005) · American Journal of Physical Medicine & Rehabilitation · doi:10.1097/01.phm.0000163709.70471.42 · Cited by 242
Research works printed but not linked: 1
- WC Chu, 2006, Spine, Spine, 2243
Cited by
The physiological effects of slow breathing in the healthy human
Russo, M. A., Santarelli, D. M., & O’Rourke, D. (2017) · Breathe · doi:10.1183/20734735.009817 · Cited by 665
“Another investigation of the diaphragm using MRI found that slow breathing was associated with greater diaphragm excursion in healthy humans, compared to patients with a chronic spinal pathology, and concluded that correct and balanced diaphragm performance helps to maintain abdominal pressure and “smooth” respiration…”
BackgroundNetwork of Breathing. Multifunctional Role of the Diaphragm: A Review
Kocjan, J., Adamek, M., Gzik‐Zroska, B., Czyżewski, D., & Rydel, M. (2017) · Advances in respiratory medicine · doi:10.5603/arm.2017.0037 · Cited by 162
Impact of diaphragm function parameters on balance maintenance
Kocjan, J., Gzik‐Zroska, B., Nowakowska-Lipiec, K., Burkacki, M., Suchoń, S., Michnik, R., Czyżewski, D., & Adamek, M. (2018) · PLoS ONE · doi:10.1371/journal.pone.0208697 · Cited by 121
Calvo‐Lobo, C., Almazán-Polo, J., Vallejo, R., Losa‐Iglesias, M. E., Palomo‐López, P., Rodríguez‐Sanz, D., & López‐López, D. (2019) · Physical Therapy in Sport · doi:10.1016/j.ptsp.2019.03.015 · Cited by 82
Manual evaluation of the diaphragm muscle
Bordoni, B., Marelli, F., Morabito, B., & Sacconi, B. (2016) · International Journal of COPD · doi:10.2147/copd.s111634 · Cited by 83
“44 In case of dysfunction of the diaphragm, this costal movement is usually limited.”
Background
Metadata
- Authors
- Vostatek, P., Novák, D., Rychnovský, T., & Rychnovská, Š.
- Affiliations
- Czech Technical University in Prague (CZ)
- Corresponding author
- Vostatek, Pavel
- ORCID
- Novák, Daniel
- Venue
- PLoS ONE
- Publisher
- Public Library of Science (PLoS)
- Published
- 2013-03-14
- Volume
- 8
- Issue
- 3
- Pages
- e56724
- ISSN
- 1932-6203 (ISSN-L)
- PMC
- PMC3597716
- OpenAlex
- W1983764086
- Semantic Scholar
- e91c4e57ce15dae9b3b25cf54f969b689fdd7d35
- Cited by
- 81
- References
- 51
- Citations by year
- 2026: 2 · 2025: 10 · 2024: 8 · 2023: 6 · 2022: 16 · 2021: 9 · 2020: 6 · 2019: 4 · 2018: 5 · 2017: 4 · 2016: 8 · 2015: 2 · 2013: 1
- FWCI
- 2.69
- Type
- journal article
- Language
- en
- Open access
- gold
- doi.org
- Locations
- PLoS ONE (publishedVersion, cc-by)
- Europe PMC (PubMed Central) (publishedVersion, cc-by)
- PubMed Central (publishedVersion, cc-by)
- PubMed (publishedVersion)
- DOAJ (DOAJ: Directory of Open Access Journals) (submittedVersion, cc-by-sa)
- Topics
- Health Sciences › Health Professions › Physical Therapy, Sports Therapy and Rehabilitation › Musculoskeletal pain and rehabilitation
- Health Sciences › Medicine › Orthopedics and Sports Medicine › Spine and Intervertebral Disc Pathology
- Health Sciences › Medicine › Surgery › Scoliosis diagnosis and treatment
- Keywords
- diaphragm, postural function, respiratory muscle function, chronic low back pain, spinal disorders, lower limb loading, diaphragm shape, compensatory mechanisms
- MeSH terms
- Adult, Diaphragm, Postural Balance, Female, Humans, Magnetic Resonance Imaging, Male, Middle Aged, Motion, Posture, Spine, Respiratory Mechanics, Young Adult
About these checks
Registry, retraction, Cites and statistics results are computed, not judged, with one exception: a printed reference that no index lists is read once by a model before it counts as a citation error. Claims are extracted by a model and kept only when their quote appears verbatim in the text; each cited source is then checked, with a model’s help, for whether it says what the claim relies on. Those verdicts can be wrong — read the claim’s quote and the cited source before relying on one.
Statistics and arithmetic are recomputed, not judged.
Confidence bands are shown only for fields calibrated on our annotated test set. None is calibrated yet, so no band is shown.
What counts as a claim ›How we measure confidence ›How we check this ›
Are you an author, or do you see a problem with this page? Request a review
How to cite
Cite CoChat for the checks on this page, and the paper for its own findings.
- This page
- CoChat. (2026). Citation check: Diaphragm Postural Function Analysis Using Magnetic Resonance Imaging. https://app.cochat.ai/papers/10.1371/journal.pone.0056724
- The paper
- Vostatek, P., Novák, D., Rychnovský, T., & Rychnovská, Š. (2013). Diaphragm Postural Function Analysis Using Magnetic Resonance Imaging. PLoS ONE. https://doi.org/10.1371/journal.pone.0056724
Data sources
Bibliographic data: Semantic Scholar, OpenAlex, Crossref.
Contains information from the Semantic Scholar Academic Graph Datasets, made available under the ODC Attribution License (ODC-BY 1.0).
Semantic Scholar’s data is described in: Kinney, R., et al. (2023). The Semantic Scholar Open Data Platform. arXiv:2301.10140.
