

The DOI matches its Crossref record; 3 of the 3 references it cites were found in a registry or an index.
The Confounding Effect of Population Structure on Bayesian Skyline Plot Inferences of Demographic History
Overview
The claims and statistics of this paper haven’t been checked yet.
Run the check — free, no account needed. It reads the open-access text and checks the sources it cites.
Integrity signals
Registry
Cites
Statistics
Figures
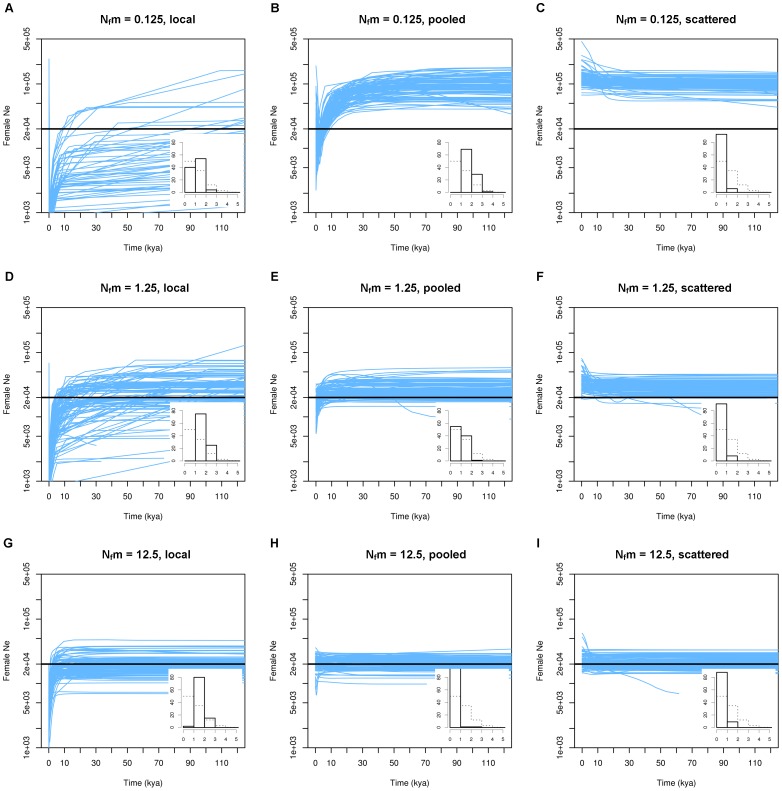
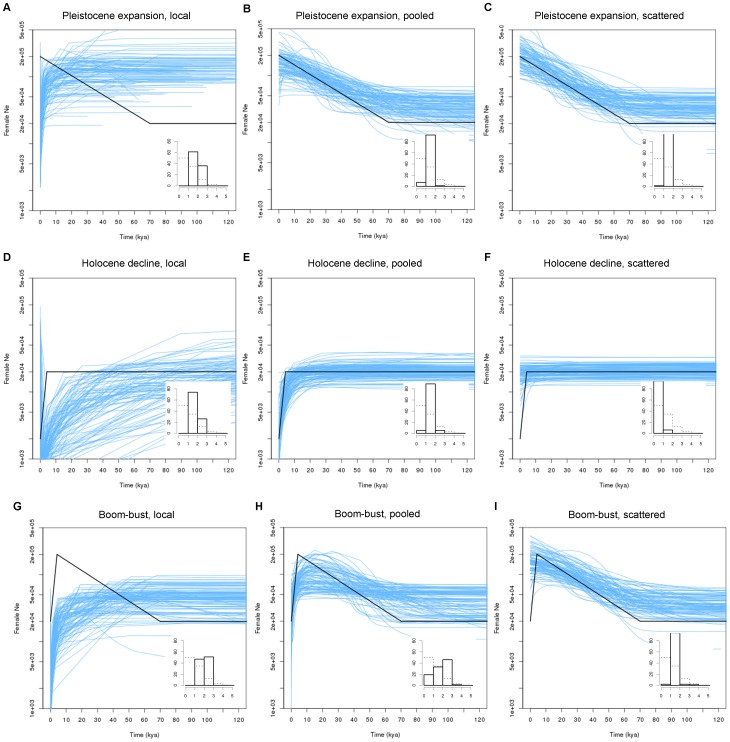
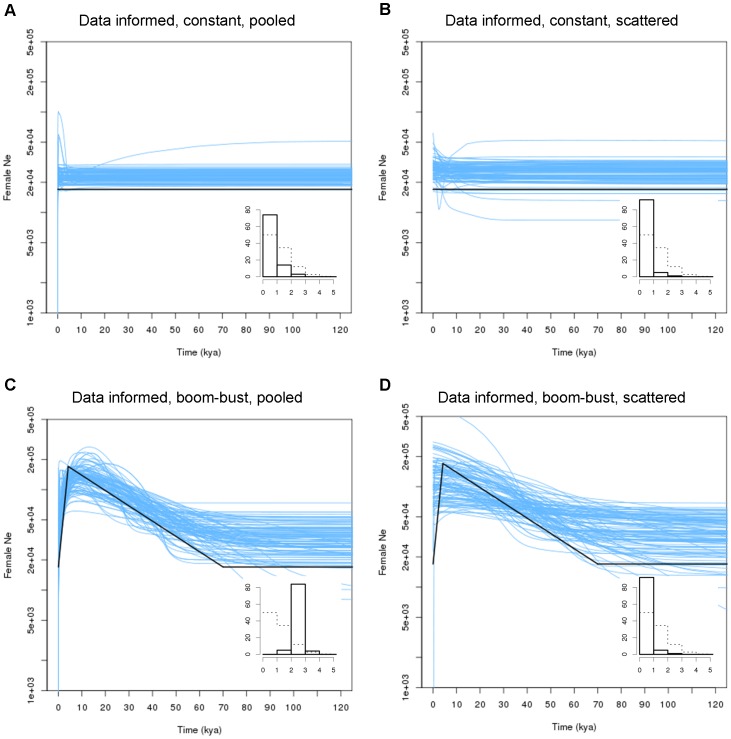
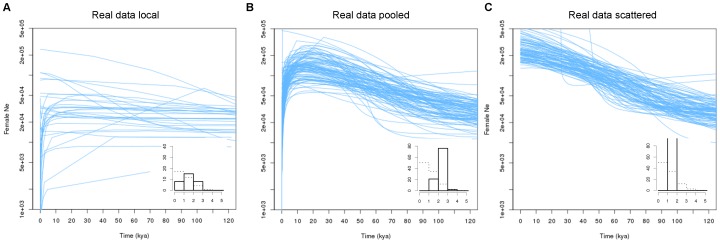
Verification
Claims the paper makes
The claims and statistics of this paper haven’t been checked yet.
Run the check — free, no account needed. It reads the open-access text and checks the sources it cites.
Claims other papers make about this one
Each is checked against this paper’s own text: does it say what the citing paper says it does?
In the citing paper
“Furthermore, an unbalanced sampling in a structured population has been shown to trigger spurious bottlenecks in BSPs88.”
From Patrilineal segmentary systems provide a peaceful explanation for the post-Neolithic Y-chromosome bottleneck (2024) · cites this paper as [88]
Self-check
Percentages, sums and reported differences re-computed from the paper’s own numbers.
The self-check needs the paper’s full text.
Citations
Cites
Genealogical trees, coalescent theory and the analysis of genetic polymorphisms
Rosenberg, N. A., & Nordborg, M. (2002) · Nature Reviews Genetics · doi:10.1038/nrg795 · Cited by 750
Rapid, global demographic expansions after the origins of agriculture
Gignoux, C. R., Henn, B. M., & Mountain, J. L. (2011) · Proceedings of the National Academy of Sciences · doi:10.1073/pnas.0914274108 · Cited by 267
Campos, P. F., Willerslev, E., Sher, A., Orlando, L., Axelsson, E., Tikhonov, A., Aaris-Sørensen, K., Greenwood, A. D., Kahlke, R.-D., Kosintsev, P., et al. (2010) · Proceedings of the National Academy of Sciences · doi:10.1073/pnas.0907189107 · Cited by 239
Research works printed but not linked: 27
- OG Pybus, 2000, An integrated framework for the inference of viral population history from reconstructed genealogies, Genetics, 155, 1429, 10.1093/genetics/155.3.1429 · DOI
- AJ Drummond, 2005, Bayesian coalescent inference of past population dynamics from molecular sequences, Mol Biol Evol, 22, 1185, 10.1093/molbev/msi103 · DOI
- QD Atkinson, 2008, mtDNA variation predicts population size in humans and reveals a major southern Asian chapter in human prehistory, Mol Biol Evol, 25, 468, 10.1093/molbev/msm277 · DOI
- NJR Fagundes, 2008, A reevaluation of the native American mtDNA genome diversity and its bearing on the models of early colonization of Beringia, PLoS One, 3(9), e3157, 10.1371/journal.pone.0003157 · DOI
- B Shapiro, 2004, Rise and fall of the Beringian steppe bison, Science, 306, 1561, 10.1126/science.1101074 · DOI
- ED Lorenzen, 2011, Species-specific responses of Late Quaternary megafauna to climate and humans, Nature, 479, 359, 10.1038/nature10574 · DOI · Paper page
- T Städler, 2009, The impact of sampling schemes on the site frequency spectrum in nonequilibrium subdivided populations, Genetics, 182, 205, 10.1534/genetics.108.094904 · DOI
- L Chikhi, 2010, The confounding effects of population structure, genetic diversity and the sampling scheme on the detection and quantification of population size changes, Genetics, 186, 983, 10.1534/genetics.110.118661 · DOI
- MB Peter, 2010, Distinguishing between population bottleneck and population subdivision by a Bayesian model choice procedure, Mol Ecol, 19, 4648, 10.1111/j.1365-294X.2010.04783.x · DOI
- Heled J, Drummond AJ (2008) Bayesian inference of population size history from multiple loci. BMC Evol Biol 8:doi:10.1186/1471-2148-8-289. · DOI
- SYW Ho, 2011, Skyline-plot methods for estimating demographic history from nucleotide sequences, Mol Ecol Resour, 11, 423, 10.1111/j.1755-0998.2011.02988.x · DOI
- J Wakeley, 1999, Non-equilibrium migration in human history, Genetics, 153, 1836, 10.1093/genetics/153.4.1863 · DOI
- MA Beaumont, 2004, Recent developments in genetic data analysis: What can they tell us about human demographic history?, Heredity, 92, 365, 10.1038/sj.hdy.6800447 · DOI
- R Nielsen, 2009, Statistical inferences in phylogeography, Mol Ecol, 18, 1034, 10.1111/j.1365-294X.2008.04059.x · DOI
- JR Pannell, 2003, Coalescence in a metapopulation with recurrent local extinction and recolonization, Evolution, 57, 949, 10.1111/j.0014-3820.2003.tb00307.x · DOI
- MA Beaumont, 1999, Detecting population expansion and decline using microsatellites, Genetics, 153, 2013, 10.1093/genetics/153.4.2013 · DOI
- Smitz N, Berthouly C, Cornelis D, Heller R, Van Hooft WF, <etal>et al</etal>.. (2013) Pan-African genetic structure in the African buffalo (Syncerus caffer): Investigating intraspecific divergence. Accepted for publication, PLoS One. · DOI
- R Heller, 2008, Mid-Holocene decline in African buffalos inferred from Bayesian coalescent-based analyses of microsatellites and mitochondrial DNA, Mol Ecol, 17, 4845, 10.1111/j.1365-294X.2008.03961.x · DOI
- R Heller, 2012, Cape buffalo mitogenomics reveals a Holocene shift in the African human-megafauna dynamics, Mol Ecol, 21, 3947, 10.1111/j.1365-294X.2012.05671.x · DOI
- YL Chan, 2006, Bayesian estimation of the timing and severity of a population bottleneck from ancient DNA, PLoS Genet, 2(4), e59, 10.1371/journal.pgen.0020059 · DOI
- RR Hudson, 1992, Estimation of levels of gene flow from DNA sequence data, Genetics, 132, 583, 10.1093/genetics/132.2.583 · DOI
- MC Whitlock, 1999, Indirect measures of gene flow and migration: FST ≠ 1/(4Nm +1), Heredity, 82, 117, 10.1038/sj.hdy.6884960 · DOI
- N Ray, 2003, Intra-deme molecular diversity in spatially expanding populations, Mol Biol Evol, 29, 76, 10.1093/molbev/msg009 · DOI
- Nordborg M, Krone SM (2002) Separation of time scales and convergence to the coalescent in structured populations, 194–232 in Modern Developments in Theoretical Population Genetics: The Legacy of Gustave Malécot, edited by M. Slatkin and M. Veuille. Oxford University Press, Oxford. · DOI
- P Sjödin, 2005, On the meaning and existence of an effective population size, Genetics, 169, 1061, 10.1534/genetics.104.026799 · DOI
- MK Kuhner, 2006, LAMARC 2.0: maximum likelihood and Bayesian estimation of population parameters, Bioinformatics, 22, 768, 10.1093/bioinformatics/btk051 · DOI
- J Hey, 2007, Integration within the Felsenstein equation for improved Markov chain Monte Carlo methods in population genetics, Proc Natl Acad Sci USA, 104, 2785, 10.1073/pnas.0611164104 · DOI
Cited by
A recent bottleneck of Y chromosome diversity coincides with a global change in culture
Karmin, M., Saag, L., Vicente, M., Sayres, M. A. W., Järve, M., Talas, U. G., Rootsi, S., Ilumäe, A.-M., Mägi, R., Mitt, M., et al. (2015) · Genome Research · doi:10.1101/gr.186684.114 · Cited by 485
Boitard, S., Rodríguez, W., Jay, F., Mona, S., & Austerlitz, F. (2016) · PLoS Genetics · doi:10.1371/journal.pgen.1005877 · Cited by 190
Guyon, L., Guez, J., Toupance, B., Heyer, E., & Chaix, R. (2024) · Nature Communications · doi:10.1038/s41467-024-47618-5 · Cited by 28
Metadata
- Authors
- Heller, R., Chikhi, L., & Siegismund, H. R.
- Venue
- PLoS ONE
- Publisher
- Public Library of Science (PLoS)
- Published
- 2013-05-07
- Volume
- 8
- Issue
- 5
- Pages
- e62992
- ISSN
- 1932-6203
- PMC
- PMC3646956
- Cited by
- 344
- References
- 3
- Language
- en
About these checks
Registry, retraction, Cites and statistics results are computed, not judged, with one exception: a printed reference that no index lists is read once by a model before it counts as a citation error. Claims are extracted by a model and kept only when their quote appears verbatim in the text; each cited source is then checked, with a model’s help, for whether it says what the claim relies on. Those verdicts can be wrong — read the claim’s quote and the cited source before relying on one.
Statistics and arithmetic are recomputed, not judged.
Confidence bands are shown only for fields calibrated on our annotated test set. None is calibrated yet, so no band is shown.
What counts as a claim ›How we measure confidence ›How we check this ›
Are you an author, or do you see a problem with this page? Request a review
