

The DOI matches its Crossref record; 20 of the 22 references it cites were found in a registry or an index, and 2 are not checked yet.
Hepatocyte Expression of the Senescence Marker p21 Is Linked to Fibrosis and an Adverse Liver-Related Outcome in Alcohol-Related Liver Disease
Open accessAbstract
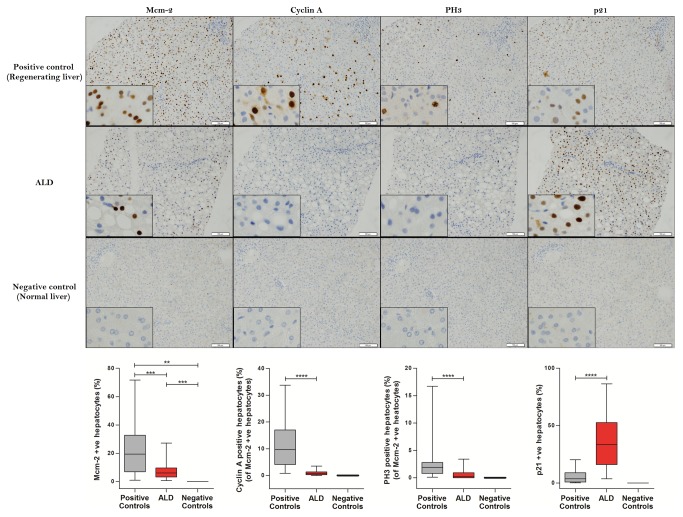
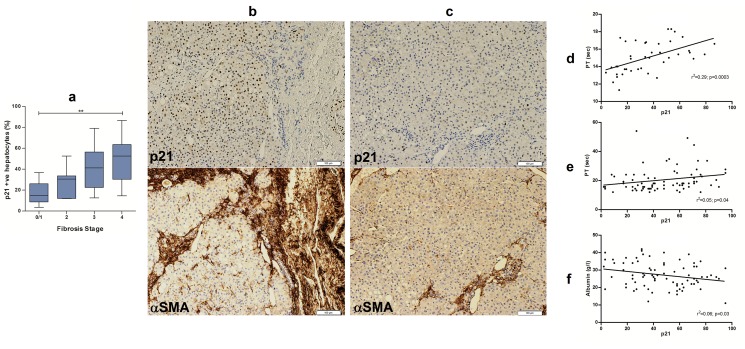
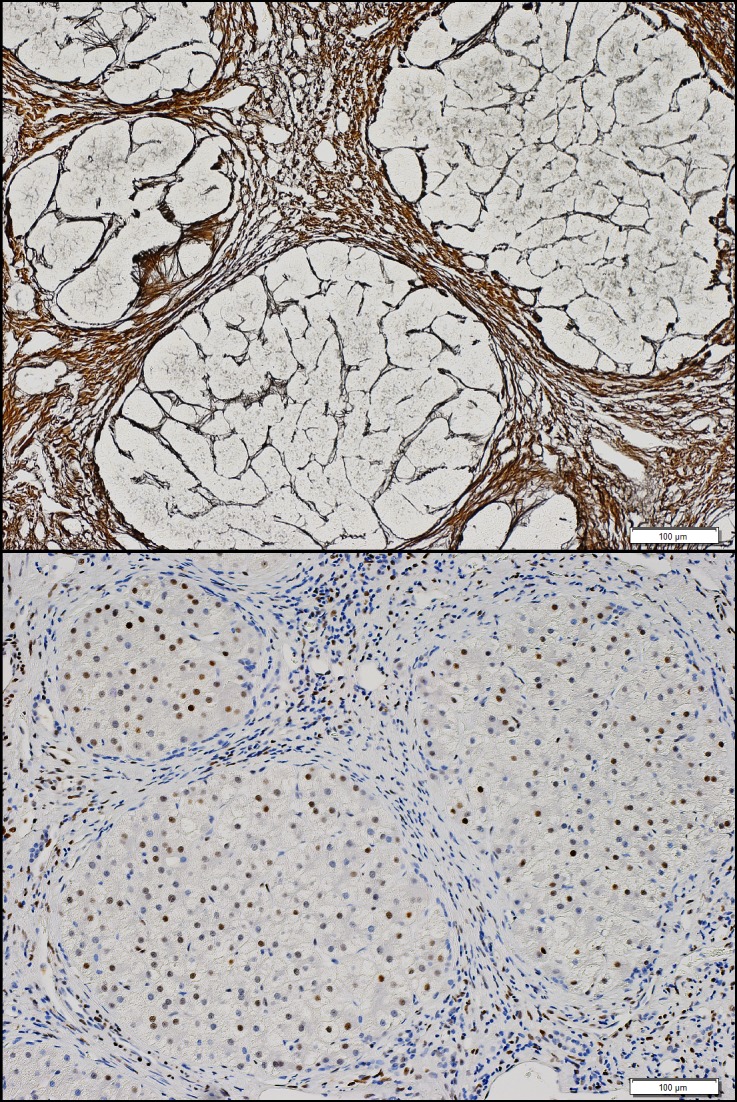
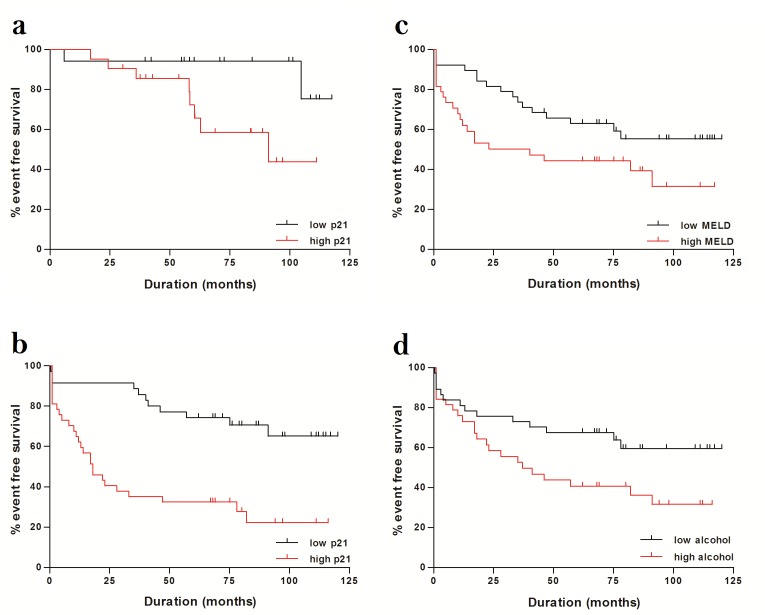
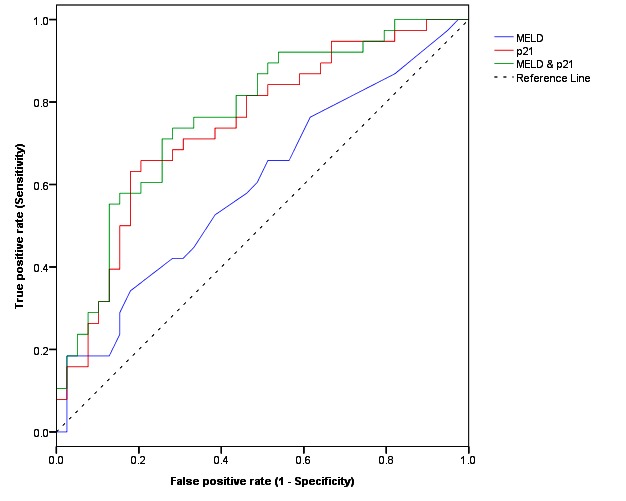
BACKGROUND AND AIM: Alcohol-related liver disease (ALD) remains a leading cause of liver-related morbidity and mortality. Age, fibrosis stage, MELD score and continued alcohol consumption predict outcome in everyday clinical practice. In previous studies increased hepatocyte nuclear area and hepatocyte expression of p21, both markers of senescence, were associated with increased fibrosis stage and a poor outcome in non-alcohol-related fatty liver disease, while increased hepatocyte nuclear area was related to liver dysfunction in ALD cirrhosis. This study, therefore, investigated the pattern of hepatocyte cell cycle phase distribution and hepatocyte p21 expression in relation to outcome in ALD. METHODS: Liver sections from two cohorts were studied. The first comprised 42 patients across the full spectrum of ALD. The second cohort comprised 77 patients with ALD cirrhosis. Immunohistochemistry assessed hepatocyte expression of cell cycle phase markers and p21. Regenerating liver (n=12) and "normal" liver sections (n=5) served as positive and negative controls, respectively. RESULTS: In the first cohort there was little cell cycle progression beyond G1/S phase and increased hepatocyte p21 expression (p<0.0001), which correlated independently with fibrosis stage (p=0.005) and an adverse liver-related outcome (p=0.03). In the second cohort, both hepatocyte p21 expression (p<0.001) and MELD score (p=0.006) were associated independently with an adverse liver-related outcome; this association was stronger with hepatocyte p21 expression (AUROC 0.74; p=0.0002) than with MELD score (AUROC 0.59; p=0.13). Further, hepatocyte p21 expression co-localised with increased hepatic stellate cell activation. CONCLUSIONS: The findings are consistent with impaired cell cycle progression beyond the G1/S phase in ALD. The striking independent associations between increased hepatocyte p21 expression and both fibrosis stage and an adverse liver-related outcome in both cohorts suggests hepatocyte senescence plays an important role in ALD. Measuring hepatocyte p21 expression is simple and cheap and in this series was a useful measure of long-term prognosis in ALD.
Overview
The claims and statistics of this paper haven’t been checked yet.
Run the check — free, no account needed. It reads the open-access text and checks the sources it cites.
Integrity signals
Registry
Cites
Statistics
Figures
Verification
Claims the paper makes
The claims and statistics of this paper haven’t been checked yet.
Run the check — free, no account needed. It reads the open-access text and checks the sources it cites.
Claims other papers make about this one
Each is checked against this paper’s own text: does it say what the citing paper says it does?
In the citing paper
“We found minimal hepatocyte senescence (Supplementary figure 1b), in contrast to advanced human diseases and rat models of HPC activation where high levels of hepatocyte senescence occur29.”
From Hepatic progenitor cells of biliary origin with liver repopulation capacity (2015) · cites this paper as [29]
Self-check
Percentages, sums and reported differences re-computed from the paper’s own numbers.
The self-check needs the paper’s full text.
Citations
Cites
Sherr, C. J. (1996) · Science · doi:10.1126/science.274.5293.1672 · Cited by 5,379
Cellular senescence: when bad things happen to good cells
Campisi, J., & d'Adda di Fagagna, F. (2007) · Nature Reviews Molecular Cell Biology · doi:10.1038/nrm2233 · Cited by 4,441
Alcoholic Liver Disease: Pathogenesis and New Therapeutic Targets
Gao, B., & Bataller, R. (2011) · Gastroenterology · doi:10.1053/j.gastro.2011.09.002 · Cited by 1,963
Living on a break: cellular senescence as a DNA-damage response
d'Adda di Fagagna, F. (2008) · Nature Reviews Cancer · doi:10.1038/nrc2440 · Cited by 1,170
O’Shea, R. S., Dasarathy, S., & McCullough, A. J. (2009) · Hepatology · doi:10.1002/hep.23258 · Cited by 1,085
The signals and pathways activating cellular senescence
Ben-Porath, I., & Weinberg, R. A. (2005) · The International Journal of Biochemistry & Cell Biology · doi:10.1016/j.biocel.2004.10.013 · Cited by 1,046
Lucey, M. R., Mathurin, P., & Morgan, T. R. M. (2009) · New England Journal of Medicine · doi:10.1056/nejmra0805786 · Cited by 896
Oxidative DNA damage and senescence of human diploid fibroblast cells.
Chen, Q., Fischer, A., Reagan, J. D., Yan, L. J., & Ames, B. N. (1995) · Proceedings of the National Academy of Sciences · doi:10.1073/pnas.92.10.4337 · Cited by 720
EASL Clinical Practical Guidelines: Management of Alcoholic Liver Disease
European Association for the Study of the Liver (2012) · Journal of Hepatology · doi:10.1016/j.jhep.2012.04.004 · Cited by 720
Alcohol and Oxidative Liver Injury
Dey, A., & Cederbaum, A. I. (2006) · Hepatology · doi:10.1002/hep.20957 · Cited by 560
Cited by
Sorted by citations
Inflammation and aging: signaling pathways and intervention therapies
Li, X., Li, C., Zhang, W., Wang, Y., Qian, P., & Huang, H. (2023) · Signal Transduction and Targeted Therapy · doi:10.1038/s41392-023-01502-8 · Cited by 1,443
Hepatic progenitor cells of biliary origin with liver repopulation capacity
Lu, W.-Y., Bird, T. G., Boulter, L., Tsuchiya, A., Cole, A. M., Hay, T., Guest, R. V., Wojtacha, D., Man, T. Y., Mackinnon, A., et al. (2015) · Nature Cell Biology · doi:10.1038/ncb3203 · Cited by 479
Evolving Concepts in the Pathogenesis of NASH: Beyond Steatosis and Inflammation
Peverill, W., Powell, L. W., & Skoien, R. (2014) · International Journal of Molecular Sciences · doi:10.3390/ijms15058591 · Cited by 387
Transcriptome signature of cellular senescence
Casella, G., Munk, R., Kim, K. M., Piao, Y., De, S., Abdelmohsen, K., & Gorospe, M. (2019) · Nucleic Acids Research · doi:10.1093/nar/gkz555 · Cited by 359
Hallmarks of Aging in the Liver
Hunt, N. J., Kang, S. W., Lockwood, G. P., Couteur, D. G. L., & Cogger, V. C. (2019) · Computational and Structural Biotechnology Journal · doi:10.1016/j.csbj.2019.07.021 · Cited by 320
Metadata
- Authors
- Aravinthan, A., Pietrosi, G., Hoare, M., Jupp, J., Marshall, A., Verrill, C., Davies, S., Bateman, A., Sheron, N., Allison, M., & Alexander, G. J. M.
- Affiliations
- University of Cambridge (GB)
- University Hospital Southampton NHS Foundation Trust (GB)
- Cambridge University Hospitals NHS Foundation Trust (GB)
- Corresponding author
- Alexander, Graeme J. M.
- ORCID
- Venue
- PLoS ONE
- Publisher
- Public Library of Science (PLoS)
- Published
- 2013-09-23
- Volume
- 8
- Issue
- 9
- Pages
- e72904
- ISSN
- 1932-6203 (ISSN-L)
- PMC
- PMC3781134
- OpenAlex
- W2026914673
- Cited by
- 117
- References
- 20
- Citations by year
- 2026: 16 · 2025: 13 · 2024: 12 · 2023: 8 · 2022: 7 · 2021: 13 · 2020: 4 · 2019: 9 · 2018: 6 · 2017: 11 · 2016: 5 · 2015: 7 · 2014: 6
- FWCI
- 4.49
- Type
- journal article
- Language
- en
- Open access
- gold
- doi.org
- Locations
- PLoS ONE (publishedVersion, cc-by)
- Europe PMC (PubMed Central) (publishedVersion, other-oa)
- PubMed Central (publishedVersion, cc-by)
- PubMed (publishedVersion)
- ePrints Soton (University of Southampton) (acceptedVersion)
- DOAJ (DOAJ: Directory of Open Access Journals) (submittedVersion, cc-by-sa)
- Topics
- Health Sciences › Medicine › Pathology and Forensic Medicine › Alcohol Consumption and Health Effects
- Health Sciences › Medicine › Hepatology › Liver physiology and pathology
- Health Sciences › Medicine › Hepatology › Liver Disease and Transplantation
- Keywords
- alcoholic liver disease, hepatocyte senescence, p21, liver fibrosis, hepatocyte cell cycle, G1/S phase, MELD score, hepatic stellate cell activation, liver cirrhosis, prognosis
- MeSH terms
- Adult, Aged, Biopsy, Female, Humans, Liver Cirrhosis, Liver Diseases, Alcoholic, Male, Middle Aged, Cohort Studies, Biomarkers, Cellular Senescence, Hepatocytes, Cyclin-Dependent Kinase Inhibitor p21
About these checks
Registry, retraction, Cites and statistics results are computed, not judged, with one exception: a printed reference that no index lists is read once by a model before it counts as a citation error. Claims are extracted by a model and kept only when their quote appears verbatim in the text; each cited source is then checked, with a model’s help, for whether it says what the claim relies on. Those verdicts can be wrong — read the claim’s quote and the cited source before relying on one.
Statistics and arithmetic are recomputed, not judged.
Confidence bands are shown only for fields calibrated on our annotated test set. None is calibrated yet, so no band is shown.
What counts as a claim ›How we measure confidence ›How we check this ›
Are you an author, or do you see a problem with this page? Request a review
