

The DOI matches its Crossref record; 60 of the 60 references it cites were found in a registry or an index.
Characterization of Novel CSF Tau and ptau Biomarkers for Alzheimer’s Disease
Open accessAbstract
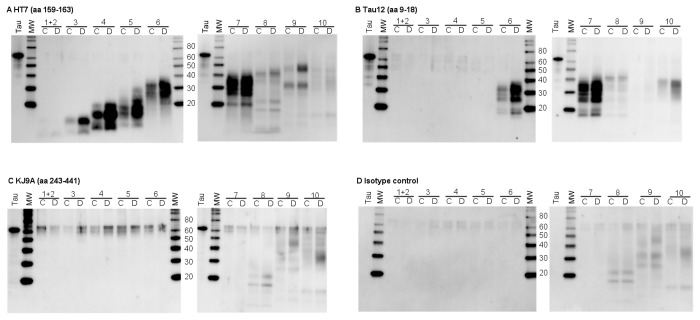
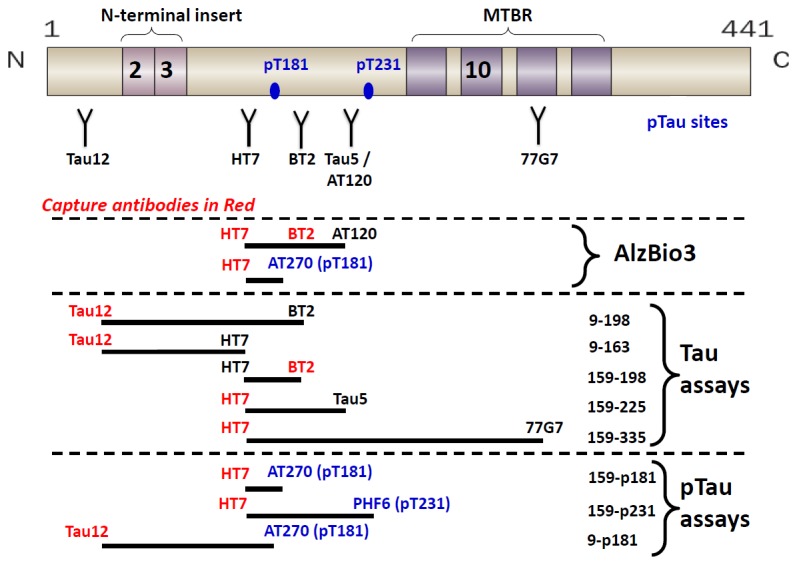
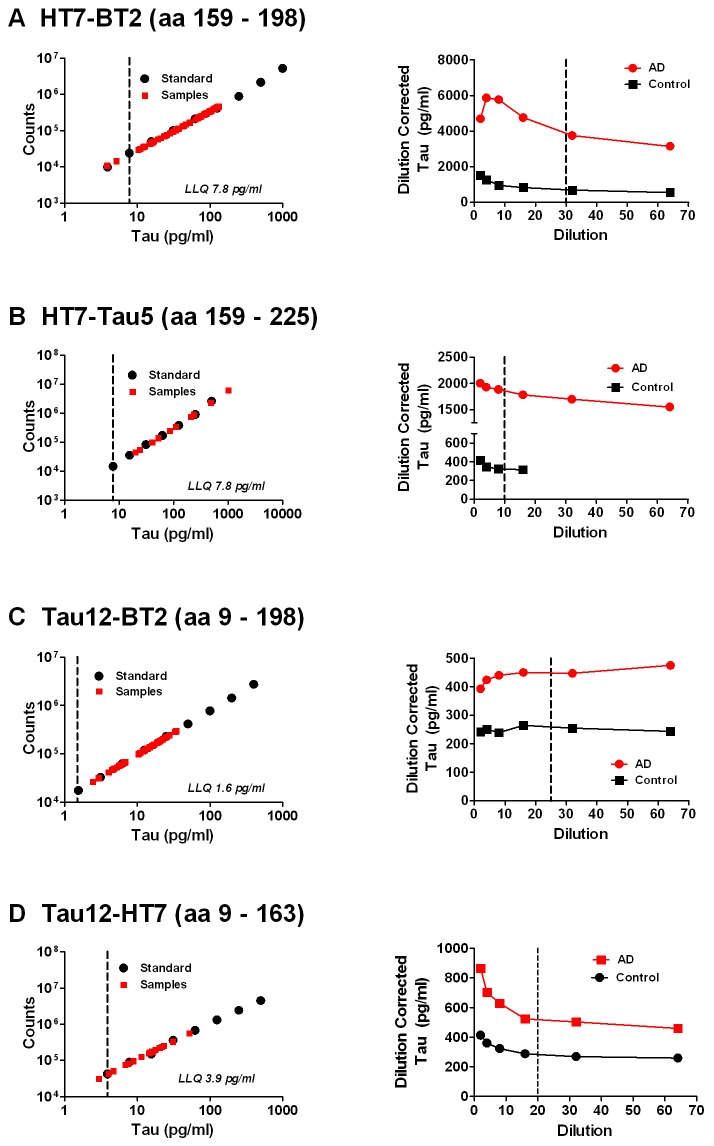
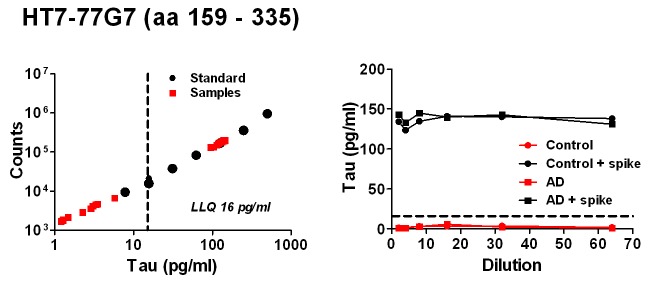
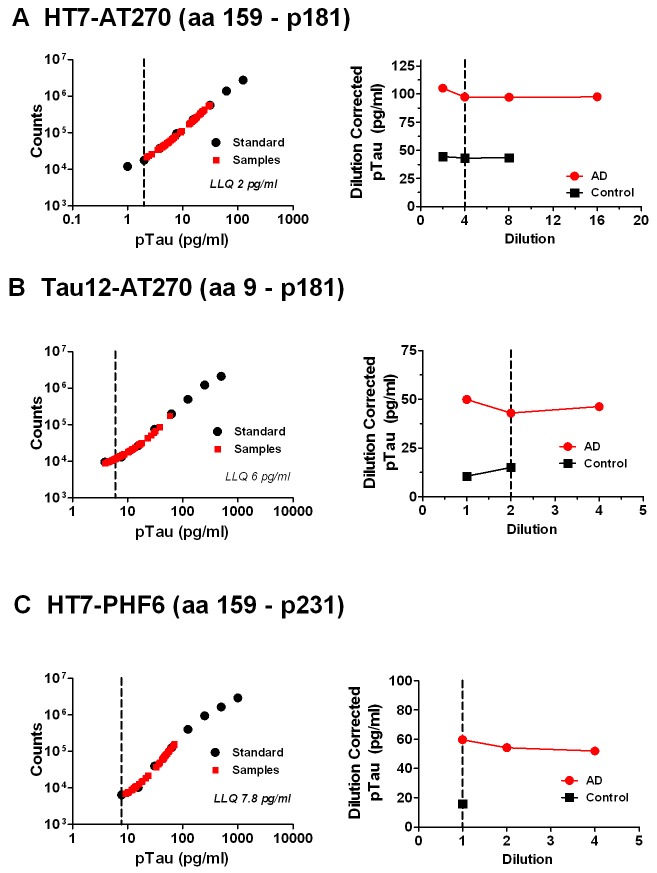
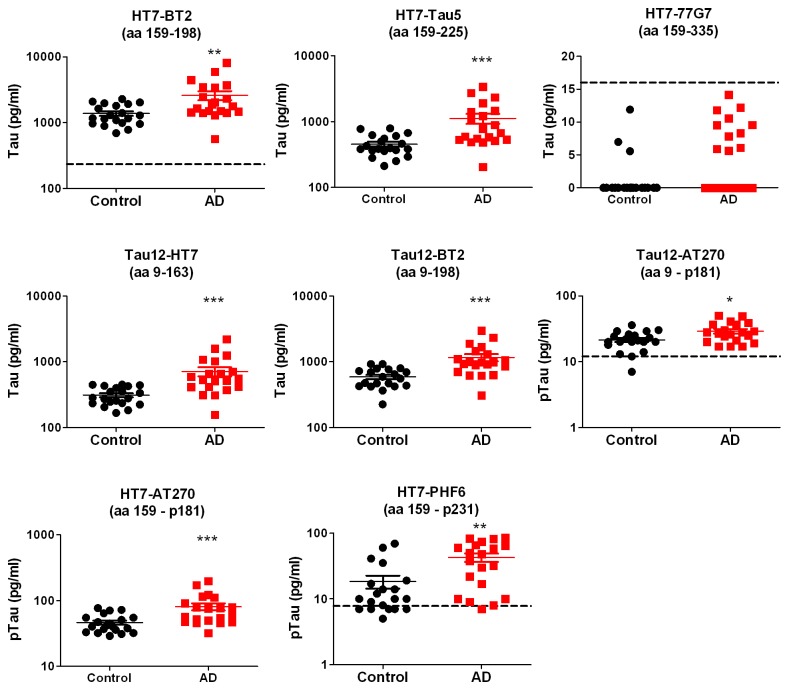
Cerebral spinal fluid (CSF) Aβ42, tau and p181tau are widely accepted biomarkers of Alzheimer's disease (AD). Numerous studies show that CSF tau and p181tau levels are elevated in mild-to-moderate AD compared to age-matched controls. In addition, these increases might predict preclinical AD in cognitively normal elderly. Despite their importance as biomarkers, the molecular nature of CSF tau and ptau is not known. In the current study, reverse-phase high performance liquid chromatography was used to enrich and concentrate tau prior to western-blot analysis. Multiple N-terminal and mid-domain fragments of tau were detected in pooled CSF with apparent sizes ranging from <20 kDa to ~40 kDa. The pattern of tau fragments in AD and control samples were similar. In contrast, full-length tau and C-terminal-containing fragments were not detected. To quantify levels, five tau ELISAs and three ptau ELISAs were developed to detect different overlapping regions of the protein. The discriminatory potential of each assay was determined using 20 AD and 20 age-matched control CSF samples. Of the tau ELISAs, the two assays specific for tau containing N-terminal sequences, amino acids 9-198 (numbering based on tau 441) and 9-163, exhibited the most significant differences between AD and control samples. In contrast, CSF tau was not detected with an ELISA specific for a more C-terminal region (amino acids 159-335). Significant discrimination was also observed with ptau assays measuring amino acids 159-p181 and 159-p231. Interestingly, the discriminatory potential of p181 was reduced when measured in the context of tau species containing amino acids 9-p181. Taken together, these results demonstrate that tau in CSF occurs as a series of fragments and that discrimination of AD from control is dependent on the subset of tau species measured. These assays provide novel tools to investigate CSF tau and ptau as biomarkers for other neurodegenerative diseases.
Overview
The claims and statistics of this paper haven’t been checked yet.
Run the check — free, no account needed. It reads the open-access text and checks the sources it cites.
Integrity signals
Registry
Cites
Statistics
Figures
Verification
Claims the paper makes
The claims and statistics of this paper haven’t been checked yet.
Run the check — free, no account needed. It reads the open-access text and checks the sources it cites.
Claims other papers make about this one
Each is checked against this paper’s own text: does it say what the citing paper says it does?
In the citing paper
“In CSF, full-length tau can only be detected by western blot, but not by other methods such as ELISA and IP-MS [216–219].”
From Molecular and cellular mechanisms underlying the pathogenesis of Alzheimer’s disease (2020) · cites this paper as [217]
In the citing paper
“Both full-length and truncated tau isoforms can be secreted.”
From Molecular and cellular mechanisms underlying the pathogenesis of Alzheimer’s disease (2020) · cites this paper as [217]
In the citing paper
“whereas the presence of full-length tau in the CSF is questionable.”
From Molecular and cellular mechanisms underlying the pathogenesis of Alzheimer’s disease (2020) · cites this paper as [217]
In the citing paper
“However, only the existence of truncated tau in CSF has been confirmed [216–218]”
From Molecular and cellular mechanisms underlying the pathogenesis of Alzheimer’s disease (2020) · cites this paper as [217]
Self-check
Percentages, sums and reported differences re-computed from the paper’s own numbers.
The self-check needs the paper’s full text.
Citations
Cites
Clinical and biomarker changes in dominantly inherited Alzheimer's disease
Bateman, R. J., Xiong, C., Benzinger, T. L. S., Fagan, A. M., Goate, A., Fox, N. C., Marcus, D. S., Cairns, N. J., Xie, X., Blazey, T. M., et al. (2012) · New England Journal of Medicine · doi:10.1056/nejmoa1202753 · Cited by 3,814
Blennow, K., de Leon, M. J., & Zetterberg, H. (2006) · The Lancet · doi:10.1016/s0140-6736(06)69113-7 · Cited by 3,134
Self-citationCerebrospinal fluid biomarker signature in Alzheimer's disease neuroimaging initiative subjects
Shaw, L. M., Vanderstichele, H., Knapik‐Czajka, M., Clark, C. M., Aisen, P. S., Petersen, R. C., Blennow, K., Soares, H., Simon, A., Lewczuk, P., et al. (2009) · Annals of Neurology · doi:10.1002/ana.21610 · Cited by 2,065
Self-citationHansson, O., Zetterberg, H., Buchhave, P., Londos, E., Blennow, K., & Minthon, L. (2006) · The Lancet Neurology · doi:10.1016/s1474-4422(06)70355-6 · Cited by 1,700
Self-citationInverse relation between in vivo amyloid imaging load and cerebrospinal fluid Aβ 42 in humans
Fagan, A. M., Mintun, M. A., Mach, R. H., Lee, S., Dence, C. S., Shah, A. R., LaRossa, G. N., Spinner, M. L., Klunk, W. E., Mathis, C. A., et al. (2006) · Annals of Neurology · doi:10.1002/ana.20730 · Cited by 1,246
CSF Biomarkers and Incipient Alzheimer Disease in Patients With Mild Cognitive Impairment
Mattsson, N. (2009) · JAMA · doi:10.1001/jama.2009.1064 · Cited by 1,176
Saman, S., Kim, W., Raya, M., Visnick, Y., Miro, S., Saman, S., Jackson, B., McKee, A. C., Alvarez, V. E., Lee, N. C. Y., et al. (2012) · Journal of Biological Chemistry · doi:10.1074/jbc.m111.277061 · Cited by 985
Tapiola, T., Alafuzoff, I., Herukka, S.-K., Parkkinen, L., Hartikainen, P., Soininen, H., & Pirttilä, T. (2009) · Archives of Neurology · doi:10.1001/archneurol.2008.596 · Cited by 896
Blennow, K., Wallin, A., Ågren, H., Spenger, C., Siegfried, J., & Vanmechelen, E. (1995) · Molecular and Chemical Neuropathology · doi:10.1007/bf02815140 · Cited by 789
Self-citationPET imaging of amyloid deposition in patients with mild cognitive impairment
Forsberg, A., Engler, H., Almkvist, O., Blomquist, G., Hagman, G., Wall, A. E., Ringheim, A., Långström, B., & Nordberg, A. K. (2007) · Neurobiology of Aging · doi:10.1016/j.neurobiolaging.2007.03.029 · Cited by 725
Tau forms in CSF as a reliable biomarker for progressive supranuclear palsy
Borroni, B., Malinverno, M., Gardoni, F., Alberici, A., Parnetti, L., Premi, E., Bonuccelli, U., Grassi, M., Perani, D., Calabresi, P., et al. (2008) · Neurology · doi:10.1212/01.wnl.0000335941.68602.39 · Cited by 686
Buchhave, P. (2012) · Archives of General Psychiatry · doi:10.1001/archgenpsychiatry.2011.155 · Cited by 664
Physiological release of endogenous tau is stimulated by neuronal activity
Pooler, A. M., Phillips, E. C., Lau, D. H. W., Noble, W., & Hanger, D. P. (2013) · The EMBO Reports · doi:10.1038/embor.2013.15 · Cited by 642
CSF Aβ 42 levels correlate with amyloid-neuropathology in a population-based autopsy study
Strozyk, D., Blennow, K., White, L. R., & Launer, L. J. (2003) · Neurology · doi:10.1212/01.wnl.0000046581.81650.d0 · Cited by 621
Self-citationVisser, P. J., Verhey, F., Knol, D. L., Scheltens, P., Wahlund, L.-O., Freund-Levi, Y., Tsolaki, M., Minthon, L., Wallin, Å. K., Hampel, H., et al. (2009) · The Lancet Neurology · doi:10.1016/s1474-4422(09)70139-5 · Cited by 614
Self-citationVanmechelen, E., Vanderstichele, H., Davidsson, P., Kerschaver, E. V., Perre, B. V. D., Sjögren, M. J. C., Andreasen, N. C., & Blennow, K. (2000) · Neuroscience Letters · doi:10.1016/s0304-3940(00)01036-3 · Cited by 487
Self-citationHampel, H., Buerger, K., Zinkowski, R., Teipel, S. J., Goernitz, A., Andreasen, N., Sjoegren, M., DeBernardis, J., Kerkman, D., Ishiguro, K., et al. (2004) · Archives of General Psychiatry · doi:10.1001/archpsyc.61.1.95 · Cited by 434
Self-citationThe Structural Basis of Monoclonal Antibody Alz50's Selectivity for Alzheimer's Disease Pathology
Carmel, G., Mager, E. M., Binder, L. I., & Kuret, J. (1996) · Journal of Biological Chemistry · doi:10.1074/jbc.271.51.32789 · Cited by 413
Clinical and Biomarker Changes in Dominantly Inherited Alzheimer's Disease
(2012) · New England Journal of Medicine · doi:10.1056/nejmx120056 · Cited by 385
Goedert, M., Jakes, R., Crowther, R. A., Cohen, P., Vanmechelen, E., Vandermeeren, M., & Cras, P. (1994) · Biochemical Journal · doi:10.1042/bj3010871 · Cited by 375
Fagan, A. M., Mintun, M. A., Shah, A. R., Aldea, P., Roe, C. M., Mach, R. H., Marcus, D., Morris, J. C., & Holtzman, D. M. (2009) · EMBO Molecular Medicine · doi:10.1002/emmm.200900048 · Cited by 353
Tau in cerebrospinal fluid: A potential diagnostic marker in Alzheimer's disease
Arai, H., Terajima, M., Miura, M., Higuchi, S., Muramatsu, T., Machida, N., Seiki, H., Takase, S., Clark, C., Lee, V. M., et al. (1995) · Annals of Neurology · doi:10.1002/ana.410380414 · Cited by 314
Büerger, K., Zinkowski, R. P., Teipel, S. J., Tapiola, T., Arai, H., Blennow, K., Andreasen, N., Hofmann‐Kiefer, K., DeBernardis, J. F., Kerkman, D. J., et al. (2002) · Archives of Neurology · doi:10.1001/archneur.59.8.1267 · Cited by 280
Self-citationItoh, N., Arai, H., Urakami, K., Ishiguro, K., Ohno, H., Hampel, H., Buerger, K., Wiltfang, J., Otto, M., Kretzschmar, H., et al. (2001) · Annals of Neurology · doi:10.1002/ana.1054 · Cited by 256
Both total and phosphorylated tau are increased in Alzheimer's disease
Sjögren, M. J. C. (2001) · Journal of Neurology Neurosurgery & Psychiatry · doi:10.1136/jnnp.70.5.624 · Cited by 253
Constitutive secretion of tau protein by an unconventional mechanism
Chai, X., Dage, J. L., & Citron, M. (2012) · Neurobiology of Disease · doi:10.1016/j.nbd.2012.05.021 · Cited by 238
Vigo‐Pelfrey, C., Seubert, P., Barbour, R., Blomquist, C., Lee, M., Lee, D., Coria, F., Chang, L., Miller, B. L., Lieberburg, I. M., et al. (1995) · Neurology · doi:10.1212/wnl.45.4.788 · Cited by 225
Amyloid beta 1-42 and tau in cerebrospinal fluid after severe traumatic brain injury
Franz, G., Beer, R., Kampfl, A., Engelhardt, K., Schmutzhard, E., Ulmer, H., & Deisenhammer, F. (2003) · Neurology · doi:10.1212/01.wnl.0000063313.57292.00 · Cited by 217
Cerebrospinal Fluid Markers for Alzheimer's Disease Evaluated after Acute Ischemic Stroke
Hesse, C., Rosengren, L., Vanmechelen, E., Vanderstichele, H., Jensen, C., Davidsson, P., & Blennow, K. (2000) · Journal of Alzheimer s Disease · doi:10.3233/jad-2000-23-402 · Cited by 215
Self-citationGhoshal, N. (2002) · Experimental Neurology · doi:10.1006/exnr.2002.8014 · Cited by 192
Quantification of Axonal Damage in Traumatic Brain Injury
Zemlan, F. P., Rosenberg, W. S., Luebbe, P., Campbell, T. A., Dean, G. E., Weiner, N. E., Cohen, J. A., Rudick, R. A., & Woo, D. (1999) · Journal of Neurochemistry · doi:10.1046/j.1471-4159.1999.0720741.x · Cited by 187
Hu, Y., He, S., Wang, X., Duan, Q., Grundke, I., Iqbal, K., & Wang, J. (2002) · American Journal Of Pathology · doi:10.1016/s0002-9440(10)62554-0 · Cited by 180
Alzheimer‐related neuronal protein A68: Specificity and distribution
Wolozin, B. L., & Davies, P. (1987) · Annals of Neurology · doi:10.1002/ana.410220412 · Cited by 178
Amyloid beta 1-42 and tau in cerebrospinal fluid after severe traumatic brain injury
Blennow, K., & Nellgård, B. (2004) · Neurology · doi:10.1212/wnl.62.1.159 · Cited by 176
Self-citationPhosphorylated tau in human cerebrospinal fluid is a diagnostic marker for Alzheimer's disease
Ishiguro, K., Ohno, H., Arai, H., Yamaguchi, H., Urakami, K., Park, J., Sato, K., Kohno, H., & Imahori, K. (1999) · Neuroscience Letters · doi:10.1016/s0304-3940(99)00476-0 · Cited by 175
Kohnken, R. E., Büerger, K., Zinkowski, R. P., Miller, C., Kerkman, D. J., DeBernardis, J. F., Shen, J., Möller, H., Davies, P., & Hampel, H. J. (2000) · Neuroscience Letters · doi:10.1016/s0304-3940(00)01178-2 · Cited by 173
Age and diagnostic performance of Alzheimer disease CSF biomarkers
Mattsson, N., Rosén, E., Hansson, O., Andreasen, N. C., Parnetti, L., Jonsson, M. A. G., Herukka, S., van der Flier, W. M., Blankenstein, M. A., Ewers, M., et al. (2012) · Neurology · doi:10.1212/wnl.0b013e3182477eed · Cited by 172
Self-citationProteostasis of tau. Tau overexpression results in its secretion via membrane vesicles
Simón, D., García‐García, E., Royo, F., Falcón‐Pérez, J. M., & Ávila, J. (2011) · FEBS Letters · doi:10.1016/j.febslet.2011.11.022 · Cited by 166
Johnson, G. V. W., Seubert, P., Cox, T. M., Motter, R., Brown, J. P., & Galasko, D. (1997) · Journal of Neurochemistry · doi:10.1046/j.1471-4159.1997.68010430.x · Cited by 162
Hyperphosphorylation and Cleavage at D421 Enhance Tau Secretion
Plouffe, V., Mohamed, N., Rivest‐McGraw, J., Bertrand, J., Lauzon, M., & Leclerc, N. M. (2012) · PLoS ONE · doi:10.1371/journal.pone.0036873 · Cited by 159
Hoffmann, R., Lee, V. M. ‐., Leight, S., Varga, I., & Ötvös, L. (1997) · Biochemistry · doi:10.1021/bi970380+ · Cited by 152
Wang, Y., Garg, S., Mandelkow, E., & Mandelkow�, E. (2010) · Biochemical Society Transactions · doi:10.1042/bst0380955 · Cited by 145
Mori, H., Hosoda, K., Matsubara, E., Nakamoto, T., Furiya, Y., Endoh, R., Usami, M., Shoji, M., Maruyama, S., & Hirai, S. (1995) · Neuroscience Letters · doi:10.1016/0304-3940(95)11291-4 · Cited by 128
Porzig, R., Singer, D. L., & Hoffmann, R. (2007) · Biochemical and Biophysical Research Communications · doi:10.1016/j.bbrc.2007.04.187 · Cited by 117
Cleavage of Tau by calpain in Alzheimer's disease: the quest for the toxic 17 kD fragment
Garg, S., Timm, T., Mandelkow, E.-M., Mandelkow, E., & Wang, Y. (2011) · Neurobiology of Aging · doi:10.1016/j.neurobiolaging.2010.09.008 · Cited by 103
Pattern of Tau forms in CSF is altered in progressive supranuclear palsy
Borroni, B., Gardoni, F., Parnetti, L., Magno, L., Malinverno, M., Saggese, E., Calabresi, P., Spillantini, M. G., Padovani, A., & Luca, M. D. (2007) · Neurobiology of Aging · doi:10.1016/j.neurobiolaging.2007.05.009 · Cited by 101
Tau Overexpression Results in Its Secretion via Membrane Vesicles
Simón, D., García‐García, E., Gómez‐Ramos, A., Falcón‐Pérez, J. M., Dı́az-Hernández, M., Hernández, F., & Ávila, J. (2012) · Neurodegenerative Diseases · doi:10.1159/000334915 · Cited by 99
Tau Transgenic Mice as Models for Cerebrospinal Fluid Tau Biomarkers
Barten, D. M., Cadelina, G. W., Hoque, N., DeCarr, L. B., Guss, V. L., Yang, L., Sankaranarayanan, S., Wes, P. D., Flynn, M. E., Meredith, J. E., et al. (2011) · Journal of Alzheimer s Disease · doi:10.3233/jad-2011-110161 · Cited by 94
Self-citationKim, W., Lee, S., & Hall, G. F. (2010) · FEBS Letters · doi:10.1016/j.febslet.2010.05.042 · Cited by 83
Luk, C. Y., Compta, Y., Magdalinou, N. K., Martı́, M. J., Hondhamuni, G., Zetterberg, H., Blennow, K., Constantinescu, R., Pijnenburg, Y. A. L., Mollenhauer, B., et al. (2012) · Journal of Neurochemistry · doi:10.1111/j.1471-4159.2012.07911.x · Cited by 65
Self-citationTau cleavage and tau aggregation in neurodegenerative disease
Hanger, D. P., & Wray, S. (2010) · Biochemical Society Transactions · doi:10.1042/bst0381016 · Cited by 60
Bahl, J. M. C., Heegaard, N. H. H., Falkenhorst, G., Laursen, H. B., Høgenhaven, H., Mølbak, K., Jespersgaard, C., Hougs, L., Waldemar, G., Johannsen, P., et al. (2008) · Neurobiology of Aging · doi:10.1016/j.neurobiolaging.2008.01.013 · Cited by 57
Mercken, M. H., Vandermeeren, M., Lübke, U., Six, J., Boons, J., Vanmechelen, E., VOORDE, A. V. D., & Gheuens, J. (1992) · Journal of Neurochemistry · doi:10.1111/j.1471-4159.1992.tb09754.x · Cited by 50
Recommendations for the incorporation of biomarkers into Alzheimer clinical trials: an overview
Morris, J. C., & Selkoe, D. J. (2011) · Neurobiology of Aging · doi:10.1016/j.neurobiolaging.2011.09.005 · Cited by 37
Measurement of Aβ1–42 in cerebrospinal fluid is influenced by matrix effects
Slemmon, J. R., Meredith, J. E., Guss, V. L., Andréasson, U., Andreasen, N., Zetterberg, H., & Blennow, K. (2011) · Journal of Neurochemistry · doi:10.1111/j.1471-4159.2011.07553.x · Cited by 36
Self-citationCerebrospinal Fluid Biomarkers for Alzheimer's Disease: More to Come?
Zetterberg, H., & Blennow, K. (2012) · Journal of Alzheimer s Disease · doi:10.3233/jad-2012-129035 · Cited by 34
Self-citationDiagnosis of progressive supranuclear palsy: can measurement of tau forms help?
Kuiperij, H. B., & Verbeek, M. M. (2010) · Neurobiology of Aging · doi:10.1016/j.neurobiolaging.2010.08.011 · Cited by 24
Singer, D. L., Soininen, H. S., Alafuzoff, I. I., & Hoffmann, R. (2009) · Analytical and Bioanalytical Chemistry · doi:10.1007/s00216-009-3208-8 · Cited by 21
Analysis of Human Tau in Cerebrospinal Fluid
Hanisch, K., Soininen, H., Alafuzoff, I., & Hoffmann, R. (2010) · Journal of Proteome Research · doi:10.1021/pr901002t · Cited by 17
Enrichment and analysis of Alzheimer's Aβ1-42 peptide in human plasma and whole blood
Ditto, N. T., Kline, T. R., Alfinito, P. D., & Slemmon, J. R. (2009) · Journal of Neuroscience Methods · doi:10.1016/j.jneumeth.2009.05.025 · Cited by 12
Self-citation
Cited by
Sorted by citations
Biomarkers for Alzheimer's disease: current status and prospects for the future
Blennow, K., & Zetterberg, H. (2018) · Journal of Internal Medicine · doi:10.1111/joim.12816 · Cited by 1,000
Self-citationMolecular and cellular mechanisms underlying the pathogenesis of Alzheimer’s disease
Guo, T., Zhang, D., Zeng, Y., Huang, T. Y., Xu, H., & Zhao, Y. (2020) · Molecular Neurodegeneration · doi:10.1186/s13024-020-00391-7 · Cited by 994
Tau PET imaging in neurodegenerative tauopathies—still a challenge
Leuzy, A., Chiotis, K., Lemoine, L., Gillberg, P.-G., Almkvist, O., Rodriguez-Vieitez, E., & Nordberg, A. (2019) · Molecular Psychiatry · doi:10.1038/s41380-018-0342-8 · Cited by 628
Tau Kinetics in Neurons and the Human Central Nervous System
Sato, C., Barthélemy, N. R., Mawuenyega, K. G., Patterson, B. W., Gordon, B. A., Jockel-Balsarotti, J., Sullivan, M., Crisp, M. J., Kasten, T., Kirmess, K. M., et al. (2018) · Neuron · doi:10.1016/j.neuron.2018.02.015 · Cited by 586
Current state of Alzheimer’s fluid biomarkers
Molinuevo, J. L., Ayton, S., Batrla, R., Bednar, M. M., Bittner, T., Cummings, J., Fagan, A. M., Hampel, H., Mielke, M. M., Mikulskis, A., et al. (2018) · Acta Neuropathologica · doi:10.1007/s00401-018-1932-x · Cited by 518
Self-citation
Metadata
- Authors
- Meredith Jr., J. E., Sankaranarayanan, S., Guss, V., Lanzetti, A. J., Berisha, F., Neely, R. J., Slemmon, J. R., Portelius, E., Zetterberg, H., Blennow, K., Soares, H., Ahlijanian, M., & Albright, C. F.
- Affiliations
- Bristol-Myers Squibb (United States) (US)
- University of Gothenburg (SE)
- UCL Queen Square Institute of Neurology (GB)
- ORCID
- Venue
- PLoS ONE
- Publisher
- Public Library of Science (PLoS)
- Published
- 2013-10-07
- Volume
- 8
- Issue
- 10
- Pages
- e76523
- ISSN
- 1932-6203 (ISSN-L)
- PMC
- PMC3792042
- OpenAlex
- W2024790026
- Cited by
- 209
- References
- 60
- Citations by year
- 2026: 6 · 2025: 13 · 2024: 14 · 2023: 14 · 2022: 11 · 2021: 19 · 2020: 23 · 2019: 28 · 2018: 29 · 2017: 16 · 2016: 11 · 2015: 13 · 2014: 11
- FWCI
- 8.10
- Type
- journal article
- Language
- en
- Open access
- gold
- doi.org
- Locations
- PLoS ONE (publishedVersion, cc-by)
- Europe PMC (PubMed Central) (publishedVersion, cc-by)
- PubMed Central (publishedVersion, cc-by)
- PubMed (publishedVersion)
- DOAJ (DOAJ: Directory of Open Access Journals) (submittedVersion, cc-by-sa)
- UCL Discovery (University College London) (submittedVersion)
- Figshare (submittedVersion, cc-by)
- Funders
- Bristol-Myers Squibb
- Vetenskapsrådet
- Topics
- Life Sciences › Neuroscience › Cellular and Molecular Neuroscience › Alzheimer's disease research and treatments
- Health Sciences › Medicine › Psychiatry and Mental health › Dementia and Cognitive Impairment Research
- Health Sciences › Medicine › Clinical Neurology › Cerebrospinal fluid and hydrocephalus
- Keywords
- Alzheimer's disease, cerebrospinal fluid, tau protein, phosphorylated tau, biomarkers, preclinical Alzheimer's disease, tau isoforms, diagnostic discrimination
- MeSH terms
- Aged, Aged, 80 and over, Alzheimer Disease, Chromatography, High Pressure Liquid, Enzyme-Linked Immunosorbent Assay, Humans, Male, Middle Aged, Molecular Weight, Peptide Fragments, Phosphorylation, Sensitivity and Specificity, Blotting, Western, Reproducibility of Results, Biomarkers, tau Proteins, Chromatography, Reverse-Phase
About these checks
Registry, retraction, Cites and statistics results are computed, not judged, with one exception: a printed reference that no index lists is read once by a model before it counts as a citation error. Claims are extracted by a model and kept only when their quote appears verbatim in the text; each cited source is then checked, with a model’s help, for whether it says what the claim relies on. Those verdicts can be wrong — read the claim’s quote and the cited source before relying on one.
Statistics and arithmetic are recomputed, not judged.
Confidence bands are shown only for fields calibrated on our annotated test set. None is calibrated yet, so no band is shown.
What counts as a claim ›How we measure confidence ›How we check this ›
Are you an author, or do you see a problem with this page? Request a review
