

The DOI matches its Crossref record; 2 of the 2 references it cites were found in a registry or an index.
Two-Step Source Tracing Strategy of Yersinia pestis and Its Historical Epidemiology in a Specific Region
Overview
The claims and statistics of this paper haven’t been checked yet.
Run the check — free, no account needed. It reads the open-access text and checks the sources it cites.
Integrity signals
Registry
Cites
Statistics
Figures
Verification
Claims the paper makes
The claims and statistics of this paper haven’t been checked yet.
Run the check — free, no account needed. It reads the open-access text and checks the sources it cites.
Claims other papers make about this one
Each is checked against this paper’s own text: does it say what the citing paper says it does?
In the citing paper
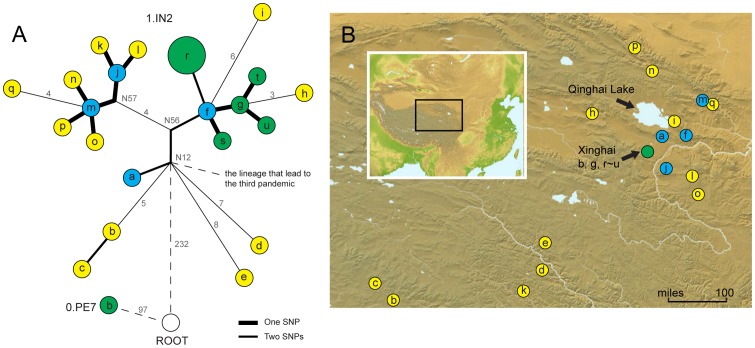
“The more recent article of Yan et al. (2014) points much more specifically to “a small region east of Qinghai Lake” as the possible origin point of Y. pestis.”
From Epilogue: A Hypothesis on the East Asian Beginnings of the Yersinia pestis Polytomy (2015) · cites this paper as Yan et al. (2014)
Self-check
Percentages, sums and reported differences re-computed from the paper’s own numbers.
The self-check needs the paper’s full text.
Citations
Cites
Yersinia pestis , the cause of plague, is a recently emerged clone of Yersinia pseudotuberculosis
Achtman, M., Zurth, K., Morelli, G., Torrea, G., Guiyoule, A., & Carniel, E. (1999) · Proceedings of the National Academy of Sciences · doi:10.1073/pnas.96.24.14043 · Cited by 1,126
Snitkin, E. S., Zelazny, A. M., Thomas, P. J., Stock, F., Program, N. C. S., Henderson, D. K., Palmore, T. N., & Segre, J. A. (2012) · Science Translational Medicine · doi:10.1126/scitranslmed.3004129 · Cited by 863
Research works printed but not linked: 39
- D Zhou, 2006, Molecular and physiological insights into plague transmission, virulence and etiology, Microbes Infect, 8, 273, 10.1016/j.micinf.2005.06.006 · DOI
- RD Perry, 1997, Yersinia pestis – etiologic agent of plague, Clin Microbiol Rev, 10, 35, 10.1128/CMR.10.1.35 · DOI
- MB Prentice, 2007, Plague, Lancet, 369, 1196, 10.1016/S0140-6736(07)60566-2 · DOI
- 2003, Human plague in 2000 and 2001, Wkly Epidemiol Rec, 78, 130
- J Kaiser, 2005, Select agents. Researchers relieved by final biosecurity rules, Science, 308, 31, 10.1126/science.308.5718.31a · DOI
- B Budowle, 2005, Microbial forensics: the next forensic challenge, Int J Legal Med, 119, 317, 10.1007/s00414-005-0535-y · DOI
- RF Yang, 2012, Microbial Forensics: A Powerful Tool for Pursuing Bioterrorism Perpetrators and the Need for an International Database, J Bioterr Biodef, S3, 007
- M Achtman, 2008, Evolution, population structure, and phylogeography of genetically monomorphic bacterial pathogens, Annu Rev Microbiol, 62, 53, 10.1146/annurev.micro.62.081307.162832 · DOI
- G Morelli, 2010, Yersinia pestis genome sequencing identifies patterns of global phylogenetic diversity, Nat Genet, 42, 1140, 10.1038/ng.705 · DOI · Paper page
- M Achtman, 2004, Microevolution and history of the plague bacillus, Yersinia pestis, Proc Natl Acad Sci U S A, 101, 17837, 10.1073/pnas.0408026101 · DOI · Paper page
- Y Li, 2008, Different region analysis for genotyping Yersinia pestis isolates from China, PLoS One, 3, e2166, 10.1371/journal.pone.0002166 · DOI
- Y Li, 2009, Genotyping and phylogenetic analysis of Yersinia pestis by MLVA: insights into the worldwide expansion of Central Asia plague foci, PLoS One, 4, e6000, 10.1371/journal.pone.0006000 · DOI
- D Zhou, 2004, DNA microarray analysis of genome dynamics in Yersinia pestis: insights into bacterial genome microevolution and niche adaptation, J Bacteriol, 186, 5138, 10.1128/JB.186.15.5138-5146.2004 · DOI
- Y Cui, 2008, Insight into microevolution of Yersinia pestis by clustered regularly interspaced short palindromic repeats, PLoS One, 3, e2652, 10.1371/journal.pone.0002652 · DOI
- JM Girard, 2004, Differential plague-transmission dynamics determine Yersinia pestis population genetic structure on local, regional, and global scales, Proc Natl Acad Sci U S A, 101, 8408, 10.1073/pnas.0401561101 · DOI
- I Comas, 2009, Genotyping of genetically monomorphic bacteria: DNA sequencing in Mycobacterium tuberculosis highlights the limitations of current methodologies, PLoS One, 4, e7815, 10.1371/journal.pone.0007815 · DOI
- Y Li, 2013, Features of Variable Number of Tandem Repeats in Yersinia pestis and the Development of a Hierarchical Genotyping Scheme, PLoS One, 8, e66567, 10.1371/journal.pone.0066567 · DOI
- T Pearson, 2004, Phylogenetic discovery bias in Bacillus anthracis using single-nucleotide polymorphisms from whole-genome sequencing, Proc Natl Acad Sci U S A, 101, 13536, 10.1073/pnas.0403844101 · DOI
- TD Read, 2002, Comparative genome sequencing for discovery of novel polymorphisms in Bacillus anthracis, Science, 296, 2028, 10.1126/science.1071837 · DOI
- P Keim, 2001, Molecular investigation of the Aum Shinrikyo anthrax release in Kameido, Japan, J Clin Microbiol, 39, 4566, 10.1128/JCM.39.12.4566-4567.2001 · DOI
- H Takahashi, 2004, Bacillus anthracis incident, Kameido, Tokyo, 1993, Emerg Infect Dis, 10, 117, 10.3201/eid1001.030238 · DOI
- RE Colman, 2009, Fine-scale identification of the most likely source of a human plague infection, Emerg Infect Dis, 15, 1623, 10.3201/eid1510.090188 · DOI
- SR Harris, 2010, Evolution of MRSA during hospital transmission and intercontinental spread, Science, 327, 469, 10.1126/science.1182395 · DOI
- KE Holt, 2008, High-throughput sequencing provides insights into genome variation and evolution in Salmonella Typhi, Nat Genet, 40, 987, 10.1038/ng.195 · DOI
- M He, 2010, Evolutionary dynamics of Clostridium difficile over short and long time scales, Proc Natl Acad Sci U S A, 107, 7527, 10.1073/pnas.0914322107 · DOI
- T Pearson, 2009, Phylogeographic reconstruction of a bacterial species with high levels of lateral gene transfer, BMC Biol, 7, 78, 10.1186/1741-7007-7-78 · DOI
- CU Koser, 2012, Rapid whole-genome sequencing for investigation of a neonatal MRSA outbreak, N Engl J Med, 366, 2267, 10.1056/NEJMoa1109910 · DOI
- JL Gardy, 2011, Whole-genome sequencing and social-network analysis of a tuberculosis outbreak, N Engl J Med, 364, 730, 10.1056/NEJMoa1003176 · DOI
- H Wang, 2011, A dog-associated primary pneumonic plague in Qinghai Province, China, Clin Infect Dis, 52, 185, 10.1093/cid/ciq107 · DOI
- Y Cui, 2013, Historical variations in mutation rate in an epidemic pathogen, Yersinia pestis, Proc Natl Acad Sci U S A, 110, 577, 10.1073/pnas.1205750110 · DOI
- Ji S (1988) Plague. BeijingChina: People's medical publishing house. 10–24 p. · DOI
- H Rohde, 2011, Open-source genomic analysis of Shiga-toxin-producing E. coli O104:H4, N Engl J Med, 365, 718, 10.1056/NEJMoa1107643 · DOI
- M Li, 2005, Asymptomatic Yersinia pestis infection, China, Emerg Infect Dis, 11, 1494, 10.3201/eid1109.041147 · DOI
- R Li, 2010, De novo assembly of human genomes with massively parallel short read sequencing, Genome Res, 20, 265, 10.1101/gr.097261.109 · DOI · Paper page
- R Li, 2008, SOAP: short oligonucleotide alignment program, Bioinformatics, 24, 713, 10.1093/bioinformatics/btn025 · DOI · Paper page
- S Kurtz, 2004, Versatile and open software for comparing large genomes, Genome Biol, 5, R12, 10.1186/gb-2004-5-2-r12 · DOI · Paper page
- S Guindon, 2003, A simple, fast, and accurate algorithm to estimate large phylogenies by maximum likelihood, Syst Biol, 52, 696, 10.1080/10635150390235520 · DOI
- S Kumar, 2008, MEGA: a biologist-centric software for evolutionary analysis of DNA and protein sequences, Brief Bioinform, 9, 299, 10.1093/bib/bbn017 · DOI
- A Stamatakis, 2005, RAxML-III: a fast program for maximum likelihood-based inference of large phylogenetic trees, Bioinformatics, 21, 456, 10.1093/bioinformatics/bti191 · DOI
Cited by
Taking "Pandemic" Seriously: Making the Black Death Global
Green, M. (2015) · The Medieval Globe · doi:10.17302/tmg.1-1.3 · Cited by 95
Epilogue: A Hypothesis on the East Asian Beginnings of the Yersinia pestis Polytomy
Hymes, R. (2015) · The Medieval Globe · doi:10.17302/tmg.1-1.11 · Cited by 18
Metadata
- Authors
- Yan, Y., Wang, H., Li, D., Yang, X., Wang, Z., Qi, Z., Zhang, Q., Cui, B., Guo, Z., Yu, C., Wang, J., Wang, J., Liu, G., Song, Y., Li, Y., Cui, Y., & Yang, R.
- Venue
- PLoS ONE
- Publisher
- Public Library of Science (PLoS)
- Published
- 2014-01-09
- Volume
- 9
- Issue
- 1
- Pages
- e85374
- ISSN
- 1932-6203
- PMC
- PMC3887043
- Cited by
- 9
- References
- 2
- Language
- en
About these checks
Registry, retraction, Cites and statistics results are computed, not judged, with one exception: a printed reference that no index lists is read once by a model before it counts as a citation error. Claims are extracted by a model and kept only when their quote appears verbatim in the text; each cited source is then checked, with a model’s help, for whether it says what the claim relies on. Those verdicts can be wrong — read the claim’s quote and the cited source before relying on one.
Statistics and arithmetic are recomputed, not judged.
Confidence bands are shown only for fields calibrated on our annotated test set. None is calibrated yet, so no band is shown.
What counts as a claim ›How we measure confidence ›How we check this ›
Are you an author, or do you see a problem with this page? Request a review
